Addictive and related behaviors, such as problem gambling, compulsive shopping, binge eating, and internet addiction, have been likened to substance addictions with respect to clinical presentation and underlying neurobiological mechanisms.Reference Morris and Voon 1 – Reference Fineberg, Potenza and Chamberlain 3 Despite their relatively high prevalence and comorbidity with other addictive disorders, the etiological mechanisms of behavioral addictions are not clearly understood, and their classification as disorders of impulse control, compulsivity, or addiction remains a topic of debate.Reference Black 4 , Reference Fineberg, Chamberlain and Goudriaan 5 Research on psychological disorders has recently shifted in focus from categorical to dimensional models, revealing that symptoms of psychopathology vary along a spectrum of severity extending into the nonclinical range and can be studied in community-based samples.Reference Krueger and DeYoung 6 , Reference Kotov, Krueger and Watson 7 Dimensional approaches also suggest that constellations of psychiatric symptoms may reflect the expression of a relatively circumscribed number of underlying phenotypic dimensions.Reference Kotov, Krueger and Watson 7 – Reference Krueger and Markon 9 A transdiagnostic approach investigating the dimensional phenotypes underlying co-occurrence of addictive and related behaviors may provide important theoretical and clinically relevant insights into their classification, etiology, and treatment.Reference Morris and Voon 1 , Reference Rodriguez-Seijas, Eaton and Krueger 10
Impulsivity and compulsivity are potentially promising transdiagnostic dimensional phenotypes that are characteristic of addiction-related disorders.Reference Robbins, Gillan, Smith, de Wit and Ersche 8 , Reference Dalley, Everitt and Robbins 11 Impulsivity describes a predisposition toward acting without forethought and without regard to potential adverse consequences.Reference Dalley, Everitt and Robbins 11 , Reference Moeller, Barratt, Dougherty, Schmitz and Swann 12 Compulsivity describes a tendency toward repetitive behavioral patterns that are maintained despite no longer being rewarded and/or being accompanied by undesirable consequences.Reference Robbins, Gillan, Smith, de Wit and Ersche 8 Impulsivity and compulsivity have been traditionally conceptualized as opposite ends of a single underlying spectrum, extending from risk-seeking (ie, reward-seeking) to risk-avoidance (ie, harm-avoidance).Reference Hollander 13 , Reference Hollander and Benzaquen 14 However, symptoms of impulsivity and compulsivity frequently co-occur, and comorbidity between impulsive and compulsive disorders are related to earlier onset, increased severity, and worse clinical outcomes.Reference Grant and Kim 15 – Reference Ruscio, Stein, Chiu and Kessler 17 Thus, impulsivity and compulsivity have been viewed more recently as distinct dimensional constructs that differentially contribute to disorders of addiction, as well as potentially underlying their comorbidity and symptom overlap.Reference Fineberg, Chamberlain and Goudriaan 5 , Reference Chamberlain, Stochl, Redden and Grant 18 An alternative and untested possibility is that impulsivity and compulsivity represent both distinct and overlapping phenotypic dimensions.Reference Robbins, Gillan, Smith, de Wit and Ersche 8 From this perspective, the overlap of impulsivity and compulsivity reflects a common disinhibition component, which may be important in terms of explaining the co-occurrence of addictive behaviors and related disorders.Reference Robbins, Gillan, Smith, de Wit and Ersche 8 , Reference Dalley, Everitt and Robbins 11 , Reference Gillan, Kosinski, Whelan, Phelps and Daw 19
Impulsivity and compulsivity are both multidimensional constructs that are often measured using task-based measures.Reference Fineberg, Chamberlain and Goudriaan 5 , Reference Dalley, Everitt and Robbins 11 , Reference Moeller, Barratt, Dougherty, Schmitz and Swann 12 However, task-based measures have been criticized for poor ecological validity, lack of sensitivity to behavioral addictions, and low inter-individual variability, thus reducing their utility in non-experimental, correlational research.Reference Morris and Voon 1 , Reference Moeller, Barratt, Dougherty, Schmitz and Swann 12 , Reference Cyders and Coskunpinar 20 , Reference Hedge, Powell and Sumner 21 An alternative approach is to measure impulsivity and compulsivity using self-report questionnaires, which enables many relevant cognitions and behaviors to be sampled across a broader context and time scale.Reference Cyders and Coskunpinar 20 The UPPS-P Impulsive Behavior ScaleReference Cyders, Smith, Spillane, Fischer, Annus and Peterson 22 , Reference Whiteside and Lynam 23 assesses individual differences across 5 distinct components of impulsivity that closely correspond to those identified in previous theories and neurobiological models of impulsivity.Reference Fineberg, Chamberlain and Goudriaan 5 , Reference Dalley, Everitt and Robbins 11 , Reference Stanford, Mathias, Dougherty, Lake, Anderson and Patton 24 Compulsivity is neither clearly characterized, nor as thoroughly investigated, as impulsivity, but can also be measured using self-report.Reference Fineberg, Potenza and Chamberlain 3 , Reference Fineberg, Chamberlain and Goudriaan 5 Intolerance of uncertainty and obsessive beliefs are related to obsessive compulsive disorder (OCD) and are considered to play a central role in the etiology of compulsive symptomatology.Reference Tolin, Abramowitz, Brigidi and Foa 25 – 27 OCD is the “archetypal” compulsive disorder and may constitute a viable model of compulsivity underlying similar disorders in the obsessive-compulsive spectrum.Reference Hollander and Benzaquen 14 , Reference Chamberlain, Leppink, Redden and Grant 28 Intolerance of uncertainty and obsessive beliefs may therefore be important indices of compulsivity in a broader range of problems characterized by this phenotype.
Study Objectives
Leveraging data collected from a large, self-selected, community-based sample with online testing and using a non-experimental, correlational research design we sought to address several gaps in the existing research literature on addictive and related behaviors.Reference Gillan and Daw 29 First, by including several behavioral addictions in our analyses—specifically pathological gambling, compulsive buying, and internet addiction in combination with more commonly researched problems, namely alcohol dependence, binge eating, and obsessive-compulsive symptoms. Second, we aimed to determine if these 6 addictive and related behaviors could be organized into co-occurring clusters reflecting their relative co-occurrence and similarity. Third, we aimed to test a novel model that conceptualizes impulsivity and compulsivity as overlapping dimensional phenotypes, consisting of both common and specific components. Fourth, we sought to determine whether the hypothesized overlapping disinhibition component and specific impulsivity and compulsivity components of our model would uniquely and additively explain variance in the co-occurrence of these 6 addiction-related problems.
Using hierarchical cluster analysis and confirmatory factor analysis (CFA), it was predicted that the 6 addiction-related problems would be organized into distinct clusters based on common etiology. We also hypothesized that a bifactor model, with a general disinhibition factor, and 2 group factors, namely impulsivity and compulsivity, would provide the best fit to the self-report data of impulsivity, intolerance of uncertainty, and obsessive beliefs, as revealed by CFA.Reference Reise 30 We refer to this hypothesized model as the overlapping dimensional phenotypes model of impulsivity and compulsivity. Finally, using structural regression analysis, we hypothesized that covariance of symptoms within distinct clusters of addictive and related behaviors would be explained by different components of the overlapping dimensional phenotypes model.
Methods
Participants
An initial sample of 588 adults (aged 18–55 years) was recruited online through the Amazon Mechanical Turk community. Participants provided written informed consent prior to completing the online battery of self-report questionnaires and were reimbursed $2 (USD) per hour for their time. Participants who failed to respond correctly to more than 2% of the control questions, which were randomly distributed throughout the survey, were excluded. The final sample consisted of 487 participants (50.7% female) with a mean age of 34.2 years (SD = 9.3), largely recruited from within the United States (93.3%), with a small proportion from Australia (6.1%). The sample was randomly split into 2 groups, calibration (n = 244) and validation (n = 243) subsamples, for cross-validation of the models using invariance testing. The proportion of male (53.69 and 44.86%) and female (46.31 and 55.14%) participants was not significantly different across the subsamples (χ2(1) = 3.8, p = .051). Mean age of participants was slightly lower in the calibration (M = 33.10, SD = 9.19) compared to the validation (M = 35.35, SD = 9.37) subsample (t (485) = −2.671, p = .008). Ethics approval to conduct the study was obtained from the Monash University Human Research Ethics Committee. All data supporting this study can be accessed at the Open Science Framework, Tiego et al. (2018, February 13) (https://osf.io/qa9eh/).
Measures
Measures of impulsivity and compulsivity
The 59-item UPPS-P Impulsivity scaleReference Cyders, Smith, Spillane, Fischer, Annus and Peterson 22 , Reference Whiteside and Lynam 23 measures impulsivity on a 4-point Likert scale (1 = agree strongly to 4 = disagree strongly) across 5 dimensions of impulsivity: (1) Negative Urgency—impulsiveness in response to the experience of negative affect; (2) Sensation Seeking—reward-sensitivity/excitement seeking; (3) Lack of Premeditation—tendency to act without deliberation and forethought; (4) Lack of Perseverance—inability to remain focused and complete a task that is boring or difficult; (5) Positive Urgency—impulsiveness in response to the experience of positive affect. Thirty-nine of the items were recoded such that higher scores represented greater levels of impulsivity in each domain. The Obsessive Beliefs Questionnaire 44-item version (OBQ-44) was used to measure obsessive beliefs across 3 domains [(1) Importance and Control of Thoughts; (2) Perfectionism and Intolerance of Uncertainty; (3) Responsibility and Threat Estimation] using a 7-point Likert-scale (1 = disagree very much to 7 = agree very much). 27 , Reference Myers, Fisher and Wells 31 The Intolerance of Uncertainty Scale–short version (IUS-12) is a 12-item self-report questionnaire used to measure maladaptive/negative beliefs about uncertainty and its consequences in 2 related domains [(1) Desire for Predictability and an Active Engagement in Seeking Certainty; (2) Paralysis of Cognition and Action in the Face of Uncertainty] scored using a 5-point Likert scale (1 = not at all characteristic of me to 5 = entirely characteristic of me).Reference Gentes and Ruscio 26 , Reference Carleton, Norton and Asmundson 32 , Reference Birrell, Meares, Wilkinson and Freeston 33
Measures of addictive and related behaviors
The Alcohol Use Disorder Identification Test (AUDIT) is a 10-item questionnaire, with responses scored from 0 to 4, developed as a screening instrument for hazardous and harmful levels of alcohol consumption, drinking behavior, and alcohol-related problems.Reference Saunders, Aasland, Babor, De La Fuente and Grant 34 The Problem Gambling Severity Index (PGSI) is a 9-item scale for measuring the severity of gambling problems in the general population using a 4-point Likert scale (0 = never to 3 = almost always).Reference Holtgraves 35 The Compulsive Buying Scale (CBS) is a 7-item questionnaire, scored on a 5-point Likert-scale (1 = very often to 5 = never), that was developed as a screening instrument for compulsive purchasing behaviors.Reference Faber and O’Guinn 36 Lower scores on the CBS indicate greater severity of compulsive buying symptoms. The Obsessive-Compulsive Inventory–Revised (OCI-R) is an 18-item self-report instrument that measures the severity of obsessive and compulsive symptoms across 6 domains (washing, checking, obsessions, mental neutralizing, ordering, hoarding).Reference Foa, Huppert and Leiberg 37 Responses are scored on a 5-point Likert scale (1 = not at all to 5 = extremely). The Binge Eating Scale (BES) is a 16-item questionnaire, scored on a 4-point scale (0–3), that is designed to assess overt behaviors, underlying cognitions, and affective experiences associated with binge eating.Reference Gormally, Black, Daston and Rardin 38 The Generalized Pathological Internet Use Scale, Version 2 (GPIUS2) is a 29-item questionnaire to assess the prevalence of cognitions, behaviors, and negative outcomes associated with pathological internet use.Reference Caplan 39 , Reference Caplan 40 Item responses are scored on an 8-point scale (1 = definitely disagree to 8 = definitely agree). All these measures were designed for measuring symptoms in nonclinical populations and have excellent psychometric properties.Reference Holtgraves 35 , Reference Reinert and Allen 41 – Reference Abramowitz and Deacon 46
Statistical analysis
Hierarchical cluster analysis
Hierarchical cluster analysis was used to organize self-reported addictive and related behaviors across the 6 questionnaires in the calibration subsample into distinct homogenous clusters based on shared features.Reference Yim and Ramdeen 47 Analysis was conducted in IBM SPSS Statistics 23 using the squared Euclidean distance as the distance measure and average between-group linkage as the cluster method. The proximity matrix, agglomeration schedule, and dendrogram were used to determine the number and composition of clusters.Reference Yim and Ramdeen 47
Structural equation modeling
All models were estimated in Mplus 7.2 using the covariance matrix.Reference Muthén and Muthén 48 First-order confirmatory factor analysis (CFA) models of the UPPS-P, IUS-12, and OBQ-44 were estimated using the weighted least squares means and variance (WLSMV) adjusted estimator and theta parameterization. Higher-order CFA and structural regression models of the dimensional phenotypes and addictive and related behaviors were estimated using full information maximum likelihood and the Bollen–Stine bootstrap procedure with 10,000 posterior draws.Reference Muthén and Muthén 48 , Reference Enders 49 A competing-models strategy was used to determine the best fitting model in the calibration subsample followed by cross-validation in the validation subsample using invariance testing.Reference Byrne 50 – Reference Vandenberg and Lance 52 Latent variable scaling was performed using the fixed factor method.Reference Byrne 50 Post hoc model fitting was performed with Bonferroni adjustment; indicator cross-loadings and error covariances were freed for estimation 1 at a time with reference to theoretical plausibility and modification indices.Reference Kline 51 , Reference Silvia and MacCallum 53 A 2-step factor score regression method was used for the structural regression models to reduce model complexity, potential misspecification errors, and convergence problems.Reference Devlieger and Rosseel 54 , Reference Devlieger, Mayer and Rosseel 55 Model fit was assessed using a combination of absolute and approximate fit indices, including the chi square test statistic (χ 2) (p > .05 exact fit), root mean square error of approximation (RMSEA) (ε< .05 close approximate fit; ε = .05–.08 reasonable approximate fit; ε > 1.0 poor fit), comparative fit index (CFI) (>.95 good fit), and standardized root mean square residual (SRMR) (<.08 good fit) or weighted root mean residual (WRMR) for categorical variables.Reference Bagozzi and Yi 56 – Reference Yu 60 Competing nested models were compared using chi square difference testing (Δχ2).Reference Kline 51
Results
Analyses of missing values, normality, and outliers
Data screening was conducted in IBM SPSS Statistics 23. Only 3 participants were missing data across the total sample: 2 in the calibration subsample (1 was missing data on the AUDIT and PGSI, and the other was missing a value for the OCI-R) and 1 participant was missing data on the GPIUS2 in the validation subsample. Scores on the AUDIT were positively skewed and required a square root transformation. The distribution of values on the OCI-R exhibited extreme negative skew and required inverse transformations. Lower values on this scale therefore reflected more problems in subsequent modeling results. The CBS exhibited mild negative skew and required a negative square root transformation. The BES exhibited moderate positive skew and required logarithmic transformation. The distribution of values on the PGSI could not be improved by transformation and were therefore retained as raw scores. Prior to modeling the ICPs and OCRPs factors and the overlapping dimensional phenotypes model, each variable was screened for outliers using a sequential fence procedure constructed using the upper and lower quartiles, defined as f Q = n/4 + (1/4), and a 2.2 multiplicative of the interquartile range.Reference Hoaglin and Iglewicz 61 This method resulted in 4 observations identified as outliers and removed from the OBQ-44 factor score estimates in the validation subsample.
An omnibus test of multivariate normality based on Small’s statisticsReference Small 62 was significant in the calibration and validation subsamples for the 6 addictive and related behaviors [χ 2(12) = 336.046, p<.001; χ 2(12) = 347.903, p<.001]; the first-order factor score estimates used as indicator variables for the overlapping dimensional phenotypes model [χ 2(24) = 45.292, p = .005; χ 2(24) = 45.603, p = .005]; and the 9 variables included in the final structural regression model [χ 2(18) = 341.682, p<.001; χ 2(18) = 363.199, p<.001], indicating that the data sets violated the assumption of multivariate normality.Reference Small 62 – Reference DeCarlo 64 Although maximum likelihood estimation is robust to minor departures from multivariate normality, significant multivariate kurtosis can bias the χ 2 test statistic toward significance, leading to rejection of well-fitting models.Reference Enders 49 , Reference Byrne 50 Thus, the Bollen–Stine bootstrap procedure was applied with 10,000 posterior draws to obtain an adjusted probability value for the χ 2 test of model fit, as well as bootstrapped standard errors with 95% confidence intervals for the model parameter estimates.Reference Muthén and Muthén 48 , Reference Enders 49
Descriptive statistics
Descriptive statistics for the 9 self-report questionnaires are provided in Tables 1 and 2. The internal consistency reliability of the UPPS-P, IUS-12, and OBQ-44 subscales were all good to excellent. Questionnaires measuring the severity of addictive and related behaviors demonstrated generally excellent internal consistency and reliability. Problem severity was assessed for clinical significance using recommended cut-off scores for the AUDIT (> 8, n = 77), PGSI (≥ 8, n = 21), CBS (< –1.340, n = 48), OCI-R (≥ 21, n = 79), and BES (≥ 27, n = 167).Reference Holtgraves 35 – Reference Foa, Huppert and Leiberg 37 , Reference Caplan 40 , Reference Reinert and Allen 41 More than half the sample (n = 245) reported at least 1 clinically significant problem, and almost a quarter of the sample (n = 99) reported 2 or more addictive and related behaviors reaching clinical levels of severity.
Table 1 Descriptive statistics for the addiction-related problem scales used in the current study

Note. M = mean; CI = confidence interval; LL = lower limit; UL = upper limit; SD = standard deviation; N = sample size.
AUDIT = Alcohol Use Disorder Identification Test; PGSI = Problem Gambling Severity Index; CBS = Compulsive Buying Scale; OCI-R = Obsessive-Compulsive Inventory-Revised; BES = Binge Eating Scale; GPIUS2 = Generalized Pathological Internet Use Scale – Version 2.
1 Square root transformation;
2 negative square root transformation;
3 inverse transformation;
4 logarithmic transformation.
aInternal consistency reliability calculated as Cronbach’s alpha (α).
* p<.05.
Table 2 Descriptive statistics for the UPPS-P, IUS-12, and OBQ-44 scales and subscales used in the current study

Note. N = 487. M = mean; CI = confidence interval; LL = lower limit; UL = upper limit; SD = standard deviation; n = size of subsample.
UPPS = UPPS - P Impulsive Behavior Scale; PosUrge = Positive Urgency; NegUrge = Negative Urgency; Premed = Lack of Premeditation; Persev = Lack of Perseverance; SensSeek = Sensation Seeking; IUS-12 = Intolerance of Uncertainty – 12-item version; Pred = Desire for Predictability and an Active Engagement in Seeking Certainty; Para = Paralysis of Cognition and Action in the Face of Uncertainty; OBQ-44 = Obsessive Beliefs Questionnaire – 44-item version; ICT = Importance and Control of Thoughts; RT = Responsibility and Threat Estimation; PC = Perfectionism.
aInternal consistency reliability calculated as Cronbach’s alpha (α).
* p<.05.
Hierarchical cluster analysis
Hierarchical cluster analysis revealed 2 distinct clusters of addictive and related behaviors in the calibration subsample. The first cluster included the OCI-R, GPIUS, and BES, and the second cluster comprised the AUDIT, PGSI, and CBS. Impulsivity has been implicated as an etiological factor underlying alcohol problems, pathological gambling, and compulsive buying.Reference Fineberg, Chamberlain and Goudriaan 5 , Reference Müller, Mitchell and de Zwaan 43 Conversely, compulsivity has been implicated in binge eating and internet addiction.Reference Hollander and Benzaquen 14 , Reference Kuss, Griffiths, Karila and Billieux 65 These clusters were therefore labeled impulse-control problems (ICPs) and obsessive-compulsive-related problems (OCRPs).
Structural equation modeling
Confirmatory factor analysis of addictive and related behaviors clusters
A 2-factor, congeneric measurement model distinguishing between ICPs (AUDIT, PGSI, and CBS) and OCRPs (OCI-R, BES, and GPIUS2) as distinct, but correlated, latent variables provided a good fit to the data in the calibration subsample [χ2(8) = 16.801, p = .126; RMSEA = .067; 90%CI = .019–.112; CFI = .955; SRMR = .035]. Constraining the factor intercorrelation between ICPs and OCRPs to 1 resulted in a significant decrement in fit [χ2(9) = 27.616, p<.05; RMSEA = .092; 90%CI = .054–.132; CFI = .906; SRMR = .047; Δχ2(1) = 10.815, p<.05], and an orthogonal 2-factor model failed to converge. Configural, metric, scalar, and partial strict measurement invariance were established for the model across subsamples, along with equivalence of the factor intercorrelation and equality of latent means for ICPs [t (485) = .228, p = .820] and OCRPs [t (485) = 1.217, p = .224].Reference Silvia and MacCallum 53 , Reference Whiteside, Lynam, Miller and Reynolds 67 Further results of these analyses are provided in Table 3.
Table 3 Results of CFA invariance testing for the impulse-control problems and obsessive-compulsive-related problems two-factor model
Note. df = degrees of freedom; χ 2 = chi square test statistic of model fit; p = probability value of the chi square test statistic obtained using the Bollen–Stine bootstrap procedure with 10,000 posterior draws; Δdf = delta degrees of freedom (df (B) – df (A)), B = baseline, more constrained model, A = alternative, less constrained model; Δχ 2 = delta chi square; calibration subsample n = 244; validation subsample n = 243.
1 Partial strict invariance, unstandardized residual variance for PGSI freely estimated in validation subsample.
First-order confirmatory factor analysis of the UPPS-P, IUS-12, and OBQ-44
Bifactor models were found to provide the optimal fit for the UPPS-P, IUS-12, and OBQ-44 in the calibration subsample compared to several alternative competing models reported in the research literature.Reference Cyders, Smith, Spillane, Fischer, Annus and Peterson 22 , 27 , Reference Myers, Fisher and Wells 31 , Reference Birrell, Meares, Wilkinson and Freeston 33 , Reference Whiteside, Lynam, Miller and Reynolds 67 The results of these analyses are provided in Tables S1–S3 (available online in the Supplementary Material). An advantage of bifactor models is that the variance of each measure is partitioned into distinct components that include a general factor, reflecting common variance across all items, and group factors capturing residual, subscale-specific variance.Reference Reise 30 The general and group factors were uncorrelated for the IUS-12 and OBQ-44, but the group factors were allowed to correlate in the UPPS-P. The OBQ-44 also included 4 item-cross loadings among the group factors. Uncorrelated group factors and absence of cross-loadings are not a strict requirement for statistical identification of the bi-factor model, however it simplifies interpretation and model diagnostics for the reliability of the group factors.Reference Reise 30 , Reference Rodriguez, Reise and Haviland 68 In the context of the current study, the residual covariance between group factors in the UPPS-P, suggesting an unmodeled general factor, was accommodated by using the factor score estimates as indicator variables for the second-order model determining how shared variance across the group factors contributed to the disinhibition, impulsivity, and compulsivity dimensions (see the next section).Reference Reise 30
Reliability of the general and group factors was evaluated by calculation of the H index and information functions for each of the general and group factors.Reference Reise and Waller 69 – Reference Hancock and Mueller 71 The H index varies from 0–1 with higher values indicating greater construct replicability. Values were .96, .94, and .97 for the 3 general factors and between .77 and .95 for the group factors on the UPPS-P and OBQ-44. Only the 2 group factors of the IUS-12 revealed less than adequate H index values (<.70), suggesting they may not be replicable constructs across studies.Reference Rodriguez, Reise and Haviland 70 , Reference Hancock and Mueller 71 Information functions for the 12 factors (see Figures S1–S3 in Supplementary Material) revealed that the latent traits (θ) were measured with relatively high levels of precision across a wide range of scores (± 3.5 SD), particularly the 3 general factors (I = 4–50).Reference Reise and Waller 69 , Reference Edelen and Reeve 72 Measurement of the group factors was less precise and more variable (I = 2–30; r xx = .50–.97), indicating lower reliability of the residualized subscales once common variance attributable to the general factor had been removed.Reference Reise 30 Calculation of the explained common variance (ECV) (.33, .69, .69) and percentage of uncorrelated correlations (PUC) (.52, .62, .61) revealed that none of the 3 measures was sufficiently unidimensional (ECV and PUC ≥.70) to collapse them into a unitary factor.Reference Rodriguez, Reise and Haviland 70 , Reference Reise, Scheines, Widaman and Haviland 73 Therefore, despite the typically observed reduction in the reliability of the residualized subscales, the group factors were capturing enough meaningful variance to be retained.Reference Rodriguez, Reise and Haviland 68 All 3 models were cross-validated in the validation subsample and demonstrated scalar invariance (see Table S4), indicating that the latent dimension represented by each general and group factor was measured equivalently and had the same interpretation across groups.Reference Kline 51
Second-order confirmatory factor analysis of the overlapping dimensional phenotypes model of impulsivity and compulsivity
Factor score estimates representing individual differences on each of the 12 first-order latent dimensions were entered as variables for estimation of the second-order dimensional phenotypes model. The correlation matrix of these variables for the calibration subsample is displayed in Table 4 (see Table S5 for validation subsample correlation matrix). Age was not significantly correlated with most of the variables and was therefore omitted from further analyses. The hypothesized overlapping dimensional phenotypes model, with a bifactor structure consisting of 1 general and 2 group factors, initially failed to provide an acceptable fit to the data [χ2(42) = 59.896, p<.001; RMSEA = .168; 90%CI = .151–.185; CFI = .674; SRMR = .140]. Several of the factor loadings were not significant, including the loading of sensation seeking-specific (λ = –.062, p ≥.05) and premeditation-specific (λ = .032, p ≥.05) on the general factor, as well as the loading of UPPS-P-General (λ = –.056, p ≥.05) on the impulsivity factor, and were therefore constrained to zero. Several indicator cross-loadings were freed for estimation based on modification indices, including lack of premeditation-specific (λ = –.607, p<.001) and lack of perseverance-specific (λ = –.624, p<.001) on the compulsivity factor and intolerance of uncertainty-general (λ = .197, p = .004) on the impulsivity factor. The loading of lack of perseverance-specific on the impulsivity factor was no longer significant and therefore constrained to zero (λ = –.139, p ≥.05). Urgency-specific also exhibited a secondary loading on the compulsivity factor that was freed for estimation (λ = –.221, p<.001). Five error covariances were also freed for estimation to obtain acceptable fit for the final model [χ2(37) = 59.896, p = .106; RMSEA = .050; 90%CI = .025–.073; CFI = .974; SRMR = .043]. Indicator cross-loadings and error covariances were statistically significant when adjusted for multiple post hoc comparisons (p<.006). The final model is displayed in Figure 1. Fit statistics for the competing measurement models are displayed in Table 5. The hypothesized overlapping dimensional phenotypes model provided the best fit to the data.
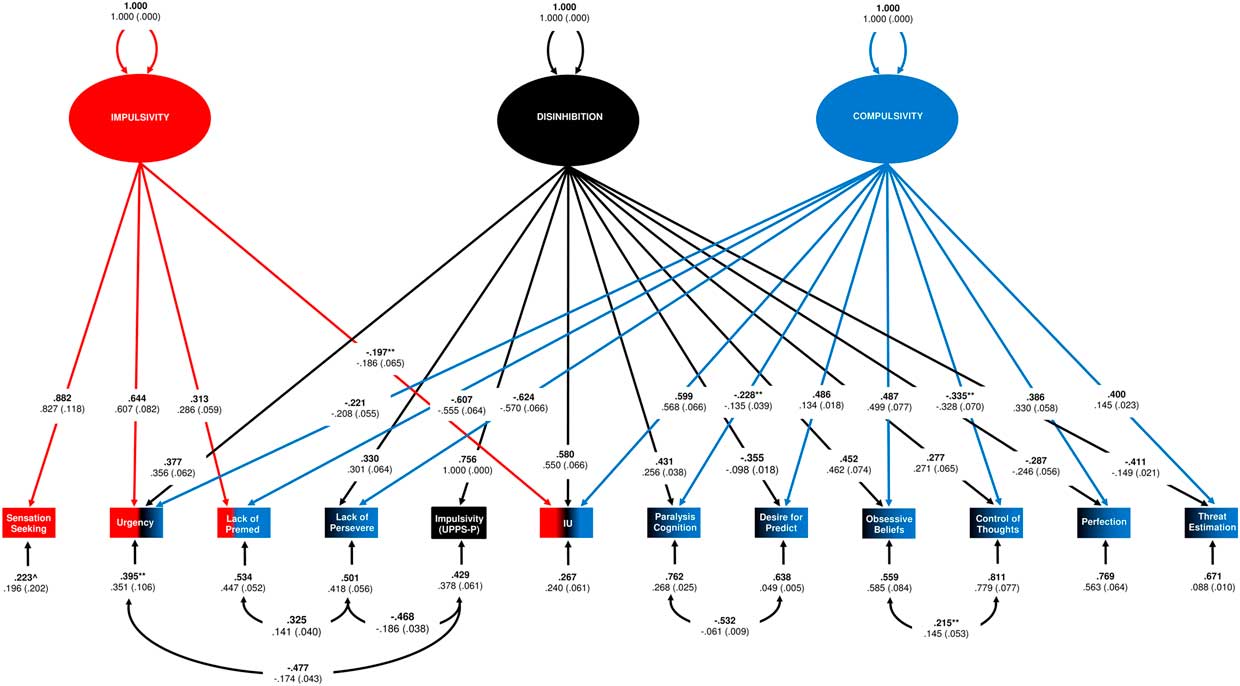
Figure 1 Results for the overlapping dimensional phenotypes model in the calibration subsample. Note. Sensation Seeking = Sensation Seeking-Specific (UPPS-P); Urgency = Positive/Negative Urgency-Specific (UPPS-P); Lack of Premed = Lack of Premeditation-Specific (UPPS-P); Lack of Persevere = Lack of Perseverance (UPPS-P); Impulsivity (UPPS-P) = General factor of the UPPS-P; IU = General factor of the IUS; Paralysis of Cognition = Paralysis of Cognition and Action in the face of Uncertainty-Specific (IUS); Desire for Predict = Desire for Predictability and an Active Engagement in Seeking Certainty -Specific (IUS); Obsessive Beliefs = General factor of the OBQ-44; Control of Thoughts = Importance and Control of Thoughts-Specific (OBQ-44); Perfection = Perfectionism-Specific (OBQ-44); Threat Estimation = Responsibility and Threat-Estimation-Specific (OBQ-44). All parameters were signifificant at p<.001 unless otherwise indicated. ** p<.01; * p<.05. Standardized parameter estimates are in bold type face, unstandardized estimates appear below with bootstrapped standard errors in brackets. All error covariances were significant at an adjusted threshold for multiple post hoc comparisons (p<.01). For identification purposes, factor scaling was set using the fixed factor method, such that the variances of 3 second-order dimensions were standardized and fixed at 1.000.
Table 4 Intercorrelations among the variables for the calibration subsample

Note. Impulsivity = Impulsivity-General (UPPS-P); Urgency = Negative and Positive Urgency-Specific (UPPS-P); Sensation Seek = Sensation Seeking-Specific (UPPS-P); Premeditation = Lack of Premeditation Specific (UPPS-P); Perseverance = Lack of Perseverance-Specific (UPPS-P); Intolerance = Intolerance of Uncertainty-General (IUS-12); Paralysis = Paralysis of Cognition and Action in the Face of Uncertainty-Specific (IUS-12); Predictability = Desire for Predictability-Specific (IUS-12); Obsessive = Obsessive Beliefs General (OBQ-44); Control = Importance and Control of Thoughts-Specific (OBQ-44); Perfection = Perfectionism-Specific (OBQ-44); Threat = Responsibility and Threat Estimation-Specific (OBQ-44); AUDIT = Alcohol Use Disorder Identification Test; PGSI = Problem Gambling Severity Index; CBS = Compulsive Buying Scale; OCI-R = Obsessive-Compulsive Inventory-Revised; BES = Binge Eating Scale; GPIUS2 = Generalized Pathological Internet Use Scale – Version 2.
1 Lower scores are indicative of greater frequency/severity of symptoms;
2 Variable underwent inverse transformation; therefore, lower scores indicate greater frequency / severity of symptoms. *** p<.001; ** p<.01; * p<.05; ^ p<.10. n = 244.
Table 5 Summary of fit statistics for the competing second-order confirmatory factor analysis models of impulsivity and compulsivity

Note. df = degrees of freedom; χ 2 = Chi square value for test of model fit estimated using maximum likelihood and the Bollen–Stine bootstrap procedure; p = significance value of the chi square test statistic with 10,000 posterior draws; RMSEA = root mean square error of approximation; CI = confidence interval; SRMR = standardized root mean residual; CFI = comparative fit index; AIC = Akaike information criterion; calibration subsample n = 244.
1 Included error covariance terms;
2 Latent variable covariance (psi) matrix was not positive definite indicating model misspecification;
3 Included indicator cross-loadings.
The H index was computed for the disinhibition, impulsivity, and compulsivity dimensions (H = .76, .81, .75). This indicated that each had adequate construct reliability (H≥.70) and that the overall measurement model was likely to be replicable across studies using the same measures.Reference Rodriguez, Reise and Haviland 70 , Reference Hancock and Mueller 71 The overlapping dimensional phenotypes model was also cross-validated in the validation subsample to ensure post hoc model changes did not result in over-fitting. The model demonstrated partial configural, partial metric, and full scalar invariance in the validation subsample (see Table 6).Reference Byrne, Shavelson and Muthén 66 The differences in unstandardized loading estimates were relatively small, and in combination with equivalence of the intercepts, were unlikely to result in meaningful and substantive differences in measurement properties and interpretation of the 3 dimensions across subsamples.Reference Kline 51 , Reference Steinmetz 74 Equality of latent means was also established for the disinhibition [t (485) = . –004, p = .997], impulsivity [t (485) = –.083, p = .934], and compulsivity [t (485) = –.215, p = .830] factors. Equivalence of the residual variances for 9 of the indicator variables, along with the 3 common error covariances, was also found. Table 7 lists the variables comprising each of the 3 dimensions, organized by strength and direction of the standardized loading estimates.
Table 6 Results of CFA invariance testing for the overlapping dimensional phenotypes model
Note. Df = degrees of freedom; χ 2 = chi square test statistic of model fit; p = probability value of the chi square test statistic obtained using the Bollen–Stine bootstrap procedure with 10,000 posterior draws; Δdf = delta degrees of freedom (df (B) – df (A)), B = baseline, more constrained model, A = alternative, less constrained model; Δχ 2 = delta chi square; calibration subsample n = 244; validation subsample n = 243.
1 Partial configural invariance – the model in the validation sample did not include a statistically significant loading of Perfectionism-Specific on the general factor or Urgency-Specific on the Compulsivity factor.
2 The model in the validation subsample also included three of the same error covariances – Lack of Perseverance-Specific with Lack of Premeditation-Specific (r = .322, p = .002) and Impulsivity-General (UPPS-P) (r = -.249, p = .006) and Impulsivity-General (UPPS-P) with Urgency-Specific (r = –.413, p<.001); and five different error covariances – Importance and Control of Thoughts-Specific with Lack of Perseverance-Specific (r = –.291, p<.001) and Urgency-Specific (r = .266, p = .006); Responsibility and Threat Estimation-Specific with Perfectionism-Specific (r = –.217, p = .003) and Obsessive Beliefs-General (r = .307, p = .002); and Desire for Predictability and an Active Engagement in Seeking Certainty-Specific with Intolerance of Uncertainty-General (r = –.497, p = .014), significant at an adjusted level for multiple post hoc comparisons (α<.01) (except for Desire for Predictability and an Active Engagement in Seeking Certainty-Specific with Intolerance of Uncertainty-General).
3 Partial metric invariance: there were 8 statistically significant differences in the unstandardized loading estimates between subgroups: the loading of Urgency-Specific, Responsibility and Threat Estimation-Specific, and Desire for Predictability and an Active Engagement in Seeking Certainty-Specific on the Disinhibition factor; Urgency-Specific and Lack of Premeditation-Specific on the Impulsivity factor, and Responsibility and Threat Estimation-Specific, Lack of Premeditation-Specific, and Desire for Predictability and an Active Engagement in Seeking Certainty-Specific on the Compulsivity factor.
4 Partial strict invariance: There were 3 statistically significant differences in the unstandardised residual variances Desire for Predictability and an Active Engagement in Seeking Certainty-Specific, Paralysis of Cognition and Action in the Face of Uncertainty, and Responsibility and Threat Estimation-Specific.
Table 7 Relative contribution of the first-order factors to the second-order dimensional phenotypes

Note. The first-order factors are listed in order of the strength of their standardized loading estimates, with the strongest positive loadings at the top and the strongest negative loadings at the bottom.
1 Loading not present in the validation subsample.
Structural regression models of dimensional phenotypes as predictors of impulse control problems and obsessive-compulsive-related problems
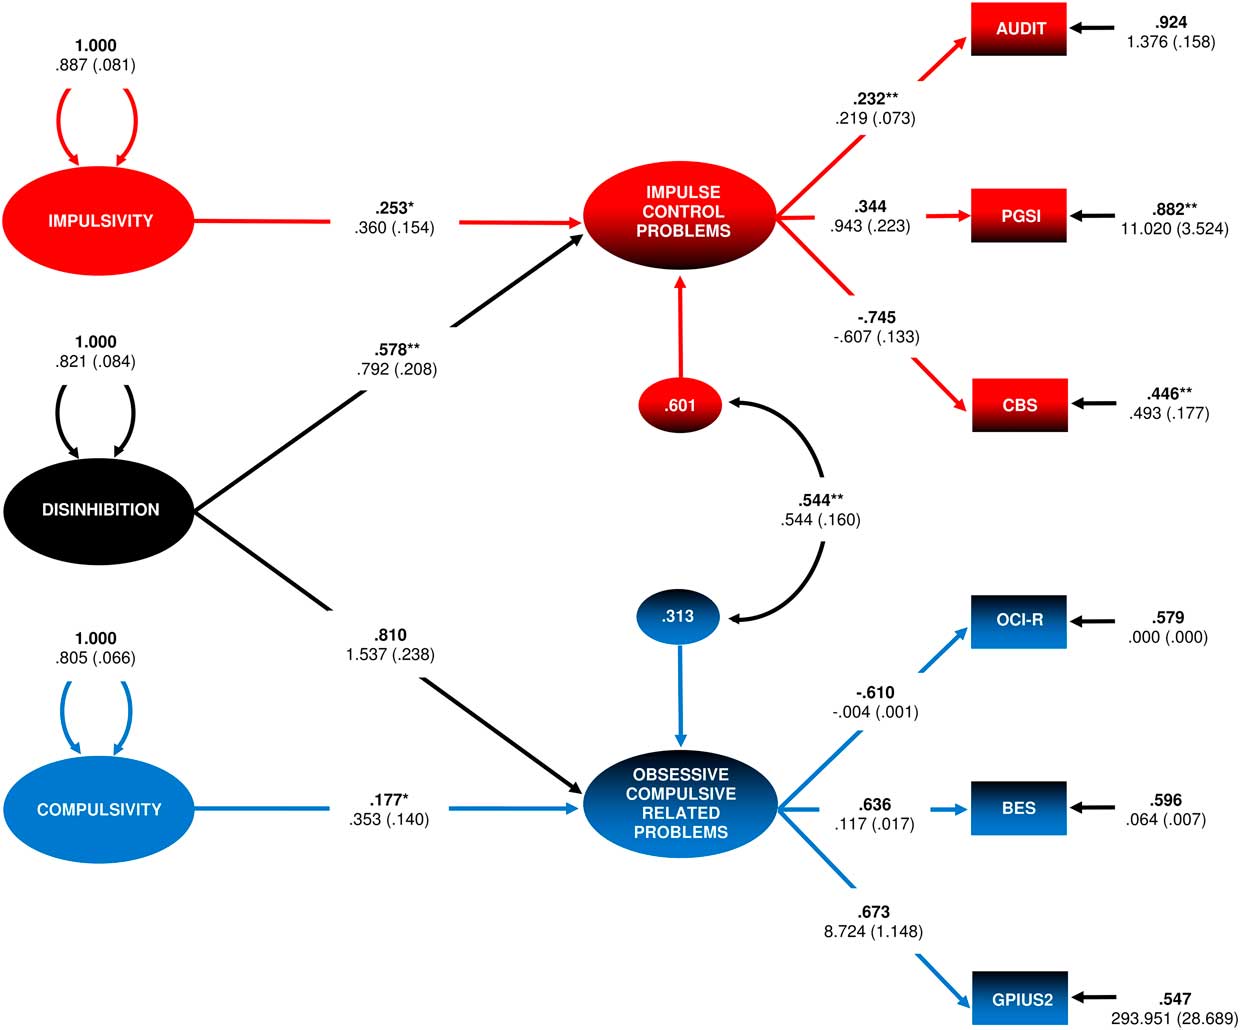
Factor score estimates were created in Mplus using the factor score regression method for the disinhibition, impulsivity, and compulsivity dimensions in the calibration subsample.Reference Muthén and Muthén 48 Factor score determinacies were high (ρ = .942, .908, .897), and the factor score estimates also had high levels of univocality and correlational accuracy (disinhibition with impulsivity, r = .064, p = .317, and compulsivity, r = –.061, p = .340; impulsivity with compulsivity, r = –.136, p = .034), indicating that the factor score estimates provided highly accurate measures of individual differences in the 3 latent variables.Reference Grice 75 , Reference DiStefano, Zhu and Mindrila 76 In addition, regression coefficients are unbiased when factor score estimates are the independent variables in a structural regression model.Reference Devlieger and Rosseel 54 , Reference Devlieger, Mayer and Rosseel 55 The factor score estimates were entered as uncorrelated, single indicator, latent variables—disinhibition, impulsivity, and compulsivity—along with the ICPs and OCRPs factors. The measurement model with 2 error covariances estimated between OCI-R and compulsivity (r = –.274, p = .001), and AUDIT and impulsivity (r = .193, p = .013), provided an acceptable fit to the data [χ2(21) = 36.183, p = .073; RMSEA = .054; 90%CI = .021–.084; CFI = .964; SRMR = .044]. The ICPs and OCRPs factors were both significantly correlated with disinhibition; however, only the OCRPs factor was significantly correlated with compulsivity. The GPIUS2 was the only indicator of the OCRPs factor correlated with impulsivity. Therefore, this residual correlation was freely estimated (r = .193, p = .013), and covariances between the OCRPs factor and impulsivity factor scores, and the ICPs factor and compulsivity factor scores, were constrained to zero.
The ICPs and OCRPs factors were then regressed onto disinhibition (γ = –.561, p = .001 and γ = –.790, p<.001), and impulsivity (γ = –.236, p = .043) and compulsivity (γ = .171, p = .019), respectively. The factor intercorrelation between ICPs and OCRPs decreased (ϕ = .640, p<.001 to ψ = .544, p = .001), indicating that disinhibition explained a proportion (27.75%) of their empirical association. The model is displayed in Figure 2 and explained 39.9% and 68.7% of the variance in the ICPs and OCRPs factors, respectively. The structural regression model was tested for invariance in the validation subsample. In the validation subsample, GPIUS2 and impulsivity factor scores were not significantly correlated (r = –.007, p≥.05), and the regression of OCRPs on compulsivity factor scores was also not statistically significant (γ = –.077, p = .349). These parameters were constrained to 0. The model otherwise demonstrated configural invariance across subsamples [χ2(46) = 78.899, p = .077; RMSEA = .054; 90%CI = .033 − .074; CFI = .960; SRMR = .045]. Constraining all parameters to be equal across groups, including the regression coefficients and factor score variances of the dimensional phenotypes, resulted in acceptable fit [χ2(59) = 85.142, p = .193; RMSEA = .043; 90%CI = .020 − .062; CFI = .968; SRMR = .050; Δχ2(13) = 6.243, p≥.05], indicating statistical equivalence of the structural model.

Figure 2 Final structural regression model of the three components of the overlapping dimensional phenotypes model predicting variance in impulse control problems (ICPs) and obsessive-compulsive-related problems (OCRPs). Note. AUDIT = Alcohol Use Disorder Identification Test; PGSI = Problem Gambling Severity Index; CBS = Compulsive Buying Scale; OCI-R = Obsessive-Compulsive Inventory-Revised (inverse transformation); BES = Binge Eating Scale; GPIUS2 = Generalized Pathological Internet Use Scale – Version 2. All parameters were significant at p<.001 unless otherwise indicated.** p<.01; * p<.05. Standardized parameter estimates are in bold type face, unstandardized estimates appear below with bootstrapped standard errors in brackets. The model included three error covariances, which have been omitted for clarity: OCI-R and Compulsivity factor scores (r = –.291, p = .001), as well as AUDIT and GPIUS2 with Impulsivity factor scores (r = .194, p = .004 and r = .194, p = .004), all significant at an adjusted level for multiple post hoc comparisons (α<.017).
Discussion
Addictive and related behaviors, including harmful alcohol use, pathological gambling, compulsive buying, obsessive-compulsive symptoms, binge eating, and internet addiction, formed distinct co-occurring clusters that paralleled previous categorizations of behavioral addictions into impulse-control and obsessive-compulsive and related disorders.Reference Hollander and Rosen 77 , Reference Berlin and Hollander 78 The hypothesized overlapping dimensional phenotypes bifactor model provided the best fit to the data obtained from self-report questionnaires measuring different types of impulsivity, intolerance of uncertainty, and obsessive beliefs, compared to several competing models. The impulsivity dimension was characterized by high levels of sensation seeking, approach-related behaviors (negative and positive urgency), and lack of forethought. It therefore corresponds to the “reward-seeking” end of the risk-seeking/risk-avoidance continuum originally described by Hollander and colleagues.Reference Hollander 13 , Reference Hollander and Benzaquen 14 Conversely, the compulsivity dimension parallels the “harm-avoidance” end of the risk-seeking/risk-avoidance continuum, in that it appeared to capture increased need for certainty, obsessiveness, increased premeditation, and behavioral withdrawal (low positive and negative urgency).Reference Hollander 13 , Reference Hollander and Benzaquen 14
The general disinhibition dimension comprised high levels of impulsivity and behavioral approach in combination with intolerance of uncertainty and obsessive beliefs. Disinhibition as a unique dimensional phenotype is a novel and potentially important finding that challenges existing models of impulsivity and compulsivity.Reference Robbins, Gillan, Smith, de Wit and Ersche 8 , Reference Hollander and Benzaquen 14 , Reference Chamberlain, Stochl, Redden and Grant 18 The cognitive and behavioral characteristics underlying impulsivity and compulsivity had traditionally been conceptualized as opposite ends of a unidimensional spectrum, suggesting that these constructs should be anti-correlated.Reference Hollander 13 , Reference Hollander and Benzaquen 14 Findings from a more recent study indicated that impulsivity and compulsivity were only weakly positively related constructs, sharing approximately 7% variance, and were better represented as a correlated 2-factor model than a bifactor model.Reference Chamberlain, Stochl, Redden and Grant 18 In contrast, we found that measures of impulsivity and compulsivity shared a large proportion of their variance, and that this shared variance was the strongest predictor of the co-occurrence of addictive and related behaviors. Individual differences on the disinhibition dimension explained a substantial proportion (33.4% and 65.6%, respectively) of the variance in the ICPs and OCRPs factors, suggesting that this unique dimensional phenotype contributes substantially to the co-occurrence of these problems. In principle, it is possible to represent impulsivity and compulsivity as a correlated 2-factor model, which is statistically nested under a bifactor model.Reference Reise 30 However, we contend that a bifactor modeling approach is better suited to characterizing these phenotypes in this and future studies, because it enables the large proportion of variance that is shared across impulsivity and compulsivity, versus what is specific to each of these phenotypes, to be extracted and their unique associations with other variables analyzed.Reference Reise 30 , Reference Kircanski, White and Tseng 79
The impulsivity dimension significantly predicted additional unique variance in ICPs across both subsamples, and the compulsivity dimension predicted additional variance in OCRPs in the calibration subsample. Therefore, the variance captured by these 2 specific dimensions uniquely contributed to the co-occurrence of addictive behaviors generally defined as impulsive and compulsive. Impulsivity, and sensation-seeking more specifically, have previously been shown to be important predictors of alcohol abuse, pathological gambling, and compulsive buying.Reference Müller, Mitchell and de Zwaan 43 , Reference Coskunpinar, Dir and Cyders 80 – Reference Hittner and Swickert 82 The present findings suggest that increased sensation-seeking and behavioral approach represent an additional and dissociable risk from more general levels of impulsivity captured by the disinhibition dimension. Obsessive beliefs and intolerance of uncertainty have previously emerged as risk factors for different types of psychopathology, including OCD, major depressive disorder, and generalized anxiety disorder.Reference Tolin, Abramowitz, Brigidi and Foa 25 , Reference Gentes and Ruscio 26 , Reference Mahoney and McEvoy 83 , Reference Carleton, Mulvogue, Thibodeau, McCabe and Antony 84 These cognitive biases may be associated with both a general transdiagnostic vulnerability for developing addictive problems, as well as a more specific risk factor for addictive behaviors characterized by compulsivity.
An implication of the current study is that it may be possible to divide addiction-related problems into distinct subgroups based on common pathogenic mechanisms, which could be informative with respect to identifying effective transdiagnostic treatment targets.Reference Kotov, Krueger and Watson 7 , Reference Eaton, Rodriguez-Seijas, Carragher and Krueger 85 The overlapping dimensional phenotypes model may assist in characterizing vulnerability to addictive behaviors, as well as developing effective transdiagnostic measures and interventions.Reference Robbins, Gillan, Smith, de Wit and Ersche 8 , Reference Fontenelle, Oostermeijer, Harrison, Pantelis and Yücel 86 Targeted treatment of intolerance of uncertainty, for example, has demonstrated efficacy for ameliorating symptom severity across a range of disorders and may represent a viable transdiagnostic intervention target for treating co-occurring addictive behaviors.Reference Boswell, Thompson-Hollands, Farchione and Barlow 87 , Reference Einstein 88
Online data collection has been promoted as a viable approach to research in dimensional psychiatry with the benefits of increased sample size, statistical power, and generalizability.Reference Gillan, Kosinski, Whelan, Phelps and Daw 19 , Reference Gillan and Daw 29 The participant sample used in the current study reported addictive behaviors across the full range of severity that extended into the clinical range. However, the use of a self-selected, community-based sample may limit generalizability of results to clinical populations. In addition, only a small number of addictive behaviors were investigated. Inclusion of a wider range of behavioral and substance-related addictions would facilitate a more detailed analysis of the co-occurrence of addiction problems and the relative contribution of underlying dimensional phenotypes. Furthermore, compulsivity and impulsivity are both heterogeneous constructs and are unlikely to be fully assessed by self-report alone.Reference Robbins, Gillan, Smith, de Wit and Ersche 8 , Reference Cyders and Coskunpinar 20 , Reference Stahl, Voss and Schmitz 89 , Reference Grant and Kim 90 The present findings require replication using a multi-method approach that includes behavioral tasks.
Bifactor models have become an increasingly used approach to study the structure of psychopathology, although they remain relatively rare in the research literature compared to alternative models.Reference Rodriguez, Reise and Haviland 68 This increasing use of bifactor modeling in psychopathology research has recently been criticized.Reference Bonifay, Lane and Reise 91 Among the leading criticisms of this approach are that the bi-factor model (1) has a tendency to demonstrate superior statistical fit to the data because it is over-parameterized compared to competing models; (2) the general factor reflects common method variance and other forms of noise and does not represent anything meaningful; and (3) the residual group factors are difficult to interpret and have weak psychometric properties.Reference Bonifay, Lane and Reise 91 The overlapping dimensional phenotypes model we have introduced has strong theoretical grounding based on the proposed overlap between impulsivity and compulsivity in terms of psychiatric epidemiology and neurobiology.Reference Fineberg, Potenza and Chamberlain 3 , Reference Robbins, Gillan, Smith, de Wit and Ersche 8 Thus, the bifactor model in the current study is not merely a case of best-fit, but a demonstration of data-theory consistency. The fact that the dimensional phenotypes differentially explained a large proportion of variance in the co-occurrence of addictive behaviors is further evidence that both general and group factors reflect some meaningful source of individual differences. The pattern of standardized loading estimates for the final bifactor model was also relatively simple and easily interpreted with respect to the theoretical framework informing the overlapping dimensional phenotypes model. Nevertheless, evidence for the validity and utility of the proposed model requires that the disinhibition, impulsivity, and compulsivity phenotypes are replicated in independent samples and map onto some aspect of “psychobiological reality,” for example genetic and neuroimaging data.Reference Rodriguez, Reise and Haviland 68 , Reference Bonifay, Lane and Reise 91
A final limitation was the use of factor score estimates from the CFA models of the UPPS-P, IUS-12, and OBQ-44 as the indicators for the second-order overlapping dimensional phenotypes model, which can lead to bias in factor loading estimates.Reference Devlieger, Mayer and Rosseel 55 , Reference Skrondal and Laake 92 However, parceling the data by using raw scores from questionnaire subscales without regard to the underlying factor structure can result in parameter bias and model misspecification, as well as obscuring important sources of variance in multidimensional data.Reference Marsh, Lüdtke, Nagengast, AJS and Von Davier 93 , Reference Bandalos 94 Although this introduced added complexity to the analyses, the use of factor score estimates as indicators for a second-order model was the best approach to capturing the latent structure of the data.
Conclusion
A model was introduced consisting of 3 empirically distinct dimensional phenotypes—disinhibition, impulsivity, and compulsivity—that uniquely and additively explained some of the co-occurrence of different types of addictive and related behaviors. These findings may provide a novel perspective on potential transdiagnostic etiological mechanisms and treatment targets for addictive behaviors and other disorders related to impulsivity and compulsivity. Replication of the model in clinical samples, along with inclusion of additional substance-related and behavioral addictions in future studies, would assist in clarifying the broader role of these dimensional phenotypes to the co-occurrence of addictive behaviors and related problems.
Disclosures
Jeggan Tiego was supported by National Health and Medical Research Council (NHMRC) Project Grants 1002458 and 1046054. Linden Parkes and Andrew Dawson were supported by Australian Postgraduate Awards. Adrian Carter was supported by an NHMRC Career Development Fellowship (APP1123311); Rebecca Segrave was supported by the David Winston Turner Endowment Fund; Leonardo F. Fontenelle was supported by a Scientist of Our State scholarship from the Foundation for Research Support of the State of Rio de Janeiro (FAPERJ) (E-26/103.252/2011 & E-26/201.305/2014) and a Research Productivity (PQ-2014) scholarship from the National Council for Scientific and Technological Development (CNPq) (E-26/308237/2014-5); Murat Yucel was supported by a NHMRC Principal Research Fellowship (APP1117188) and the David Winston Turner Endowment Fund. Sanne Oostermeijer, Luisa Prochazkova, George Youssef, and Erin Oldenhof have nothing to disclose.
Supplementary material
To view supplementary material for this article, please visit https://doi.org/10.1017/S1092852918001244