
Unravelling the origin of organic matter (OM) in rivers, estuaries and coasts is essential for improving our knowledge on regional and global carbon transport from land to sea, and refining our understanding of local in-river sedimentary processes. Sedimentary natural OM in estuaries is a mixture of vegetation and soil-derived OM, and an aquatic fraction composed of autochthonous OM from riverine and marine systems. However, the terrigenous fraction also includes a component of anthropogenic OM that can modify the environmental health of flora and fauna in the river-estuary. To tackle this lack of information on the OM source in estuarine systems, several approaches have been used to estimate the contribution of terrigenous versus aquatic OM (Kim et al. Reference Kim, Zell, Moreira-Turcq, Perez, Abril, Mortillaro and Damste2012; Khan et al. Reference Khan, Vane, Horton, Hillier, Riding and Kendrick2015; Milker et al. Reference Milker, Horton, Vane, Engelhart, Nelson, Witter, Khan and Bridgeland2015).
Stable carbon isotope (δ13C) ratios and carbon/nitrogen (C/N) have been used routinely to provenance sedimentary OM in many coastal regions, but δ13C can be compromised by the wide range of values imparted by different terrigenous sources, and C/N ratios can suffer from the preferential remineralisation of N relative to C (Khan et al. Reference Khan, Vane, Horton, Hillier, Riding and Kendrick2015). Some of the limitations of the bulk geochemical approach (δ13C and C/N) can be overcome using chemical biomarkers specific to organisms (e.g., Kim et al. Reference Kim, Zell, Moreira-Turcq, Perez, Abril, Mortillaro and Damste2012; Zhu et al. Reference Zhu, Wagner, Talbot, Weijers, Pan and Pancost2013). Glycerol dialkyl glycerol tetraethers (GDGTs) are membrane lipids that have been used as biomarkers for archaea and bacteria. The branched GDGTs (brGDGTs) are produced by yet unknown soil bacteria, with indications of the Genus Acidobacteria as possible producers (Sinninghe Damsté et al. Reference Sinninghe Damste, Rijpstra, Hopmans, Foesel, Wust, Overmann and Stott2014). However, new studies are reporting the in-situ production of these compounds in river and lake systems (Buckles et al. Reference Buckles, Weijers, Tran, Waldron and Sinninghe Damsté2014; De Jonge et al. Reference De Jonge, Stadnitskaia, Hopmans, Cherkashov, Fedotov, Streletskaya, Vasiliev and Sinninghe Damsté2015; Sinninghe Damsté Reference Sinninghe Damste2016). Crenarchaeol, an isoprenoid GDGT, is produced by ammonia-oxidising archaea from the phylum Thaumarchaeota (Sinninghe Damsté et al. Reference Sinninghe Damste, Schouten, Hopmans, van Duin and Geenevasen2002). It is believed that marine archaea are important sources of this compound, with other potential unknown sources in soils and freshwaters. Therefore, the ratio between brGDGTs and crenarchaeol, defined as the branched and isoprenoid tetraether (BIT) index, is used as a proxy for soil OM input in marine environments (Hopmans et al. Reference Hopmans, Weijers, Schefuss, Herfort, Damste and Schouten2004). More recently, the index has been applied to a variety of non-marine aquatic ecosystems, including lakes and rivers (Schouten et al. Reference Schouten, Hopmans and Damste2013 and references therein).
Most studies that utilise the BIT index in rivers have focussed on river basins with large regional-scale catchments, e.g., the Amazon, Yenisei and Yellow rivers (Kim et al. Reference Kim, Zell, Moreira-Turcq, Perez, Abril, Mortillaro and Damste2012; De Jonge et al. Reference De Jonge, Stadnitskaia, Hopmans, Cherkashov, Fedotov and Sinninghe Damste2014, Reference De Jonge, Stadnitskaia, Hopmans, Cherkashov, Fedotov, Streletskaya, Vasiliev and Sinninghe Damsté2015; Wu et al. Reference Wu, Ruan, Ding, Zhao, Xu, Yang, Ding and Pei2014). Very few focus on smaller rivers with correspondingly moderate annual discharge rates of <2000m3s–1 (e.g., Kim et al. Reference Kim, Ludwig, Schouten, Kerherve, Herfort, Bonnin and Damste2007; Zell et al. Reference Zell, Kim, Balsinha, Dorhout, Fernandes, Baas and Damste2014; Lopes dos Santos & Vane Reference Lopes dos Santos and Vane2016). Several of these studies reported successful applications of the BIT index. For example, in rivers from the Gulf of Lions, France, the authors concluded that the BIT index is suitable to trace soil OM and applied it to report historical palaeoflood events (Kim et al. Reference Kim, Ludwig, Schouten, Kerherve, Herfort, Bonnin and Damste2007, Reference Kim, Buscail, Fanget, Eyrolle-Boyer, Bassetti, Dorhout, Baas, Berne and Damste2014). However, some results reported a mixture of soil- and river-derived brGDGTs and river- and marine-derived crenarchaeol (e.g., Buckles et al. Reference Buckles, Weijers, Tran, Waldron and Sinninghe Damsté2014; Kim et al. Reference Kim, Buscail, Fanget, Eyrolle-Boyer, Bassetti, Dorhout, Baas, Berne and Damste2014; Zell et al. Reference Zell, Kim, Balsinha, Dorhout, Fernandes, Baas and Damste2014; De Jonge et al. Reference De Jonge, Stadnitskaia, Hopmans, Cherkashov, Fedotov, Streletskaya, Vasiliev and Sinninghe Damsté2015; Sinninghe Damsté, Reference Sinninghe Damste2016), which can complicate interpretation of the proxy when applied in rivers. Furthermore, Lopes dos Santos & Vane (Reference Lopes dos Santos and Vane2016) found an increase in crenarchaeol concentrations in sediments from the Thames estuary that are strongly impacted by large-scale sewage outfalls and/or other industrial effluents emanating from Central and Greater London, UK. This unusual spatial distribution of crenarchaeol compromised the application of the BIT index in the vicinity of East London and suggested that the natural distribution of these compounds can be perturbed by anthropogenic activities.
The aim of this current study is to examine the behaviour of organic carbon (OC) in the River Clyde, by measuring the spatial distribution of sedimentary GDGTs and the BIT index. The specific objectives are: (1) to test if the BIT index is a reliable proxy to record soil carbon input in the different sections of the river (rural, urban and estuary); (2) to understand the extent of how anthropogenic disturbance (Glasgow city) may impact the natural distribution of the GDGTs; and (3) to compare the BIT index results with bulk geochemical proxies (δ13C, C/N).
1. Material and methods
1.1. Study area
The River Clyde, the third longest river in Scotland, is located in the W-central part of the country and is approximately 170km long. It has a catchment area of approximately 3200km2 and an average discharge of 70m3s–1. From its source in S Lanarkshire, the Clyde flows NW through agricultural areas, flowing through many urban areas such as Motherwell, Glasgow and Greenock (Fig. 1). The river became strongly polluted during the 18th and 19th centuries, due to the increased industrialisation of Glasgow that comprised industries like shipbuilding, iron and steel manufacture, engineering, coal mining, chemical production as well as paper and textile manufacture. Although these industrial activities have declined since the 19th Century, recent studies have shown that modern surface sediments are still a sink/source of organic contaminants from industries, domestic sewage effluents and diffuse pollution from rural sources (Vane et al. Reference Vane, Harrison and Kim2007, Reference Vane, Chenery, Harrison, Kim, Moss-Hayes and Jones2011). In addition to the high contribution of sedimentary anthropogenic carbon, the river may play an important role in the transport of natural carbon from rock erosion, vegetation and soil material into the sea (Galy et al. Reference Galy, Peucker-Ehrenbrink and Eglinton2015).
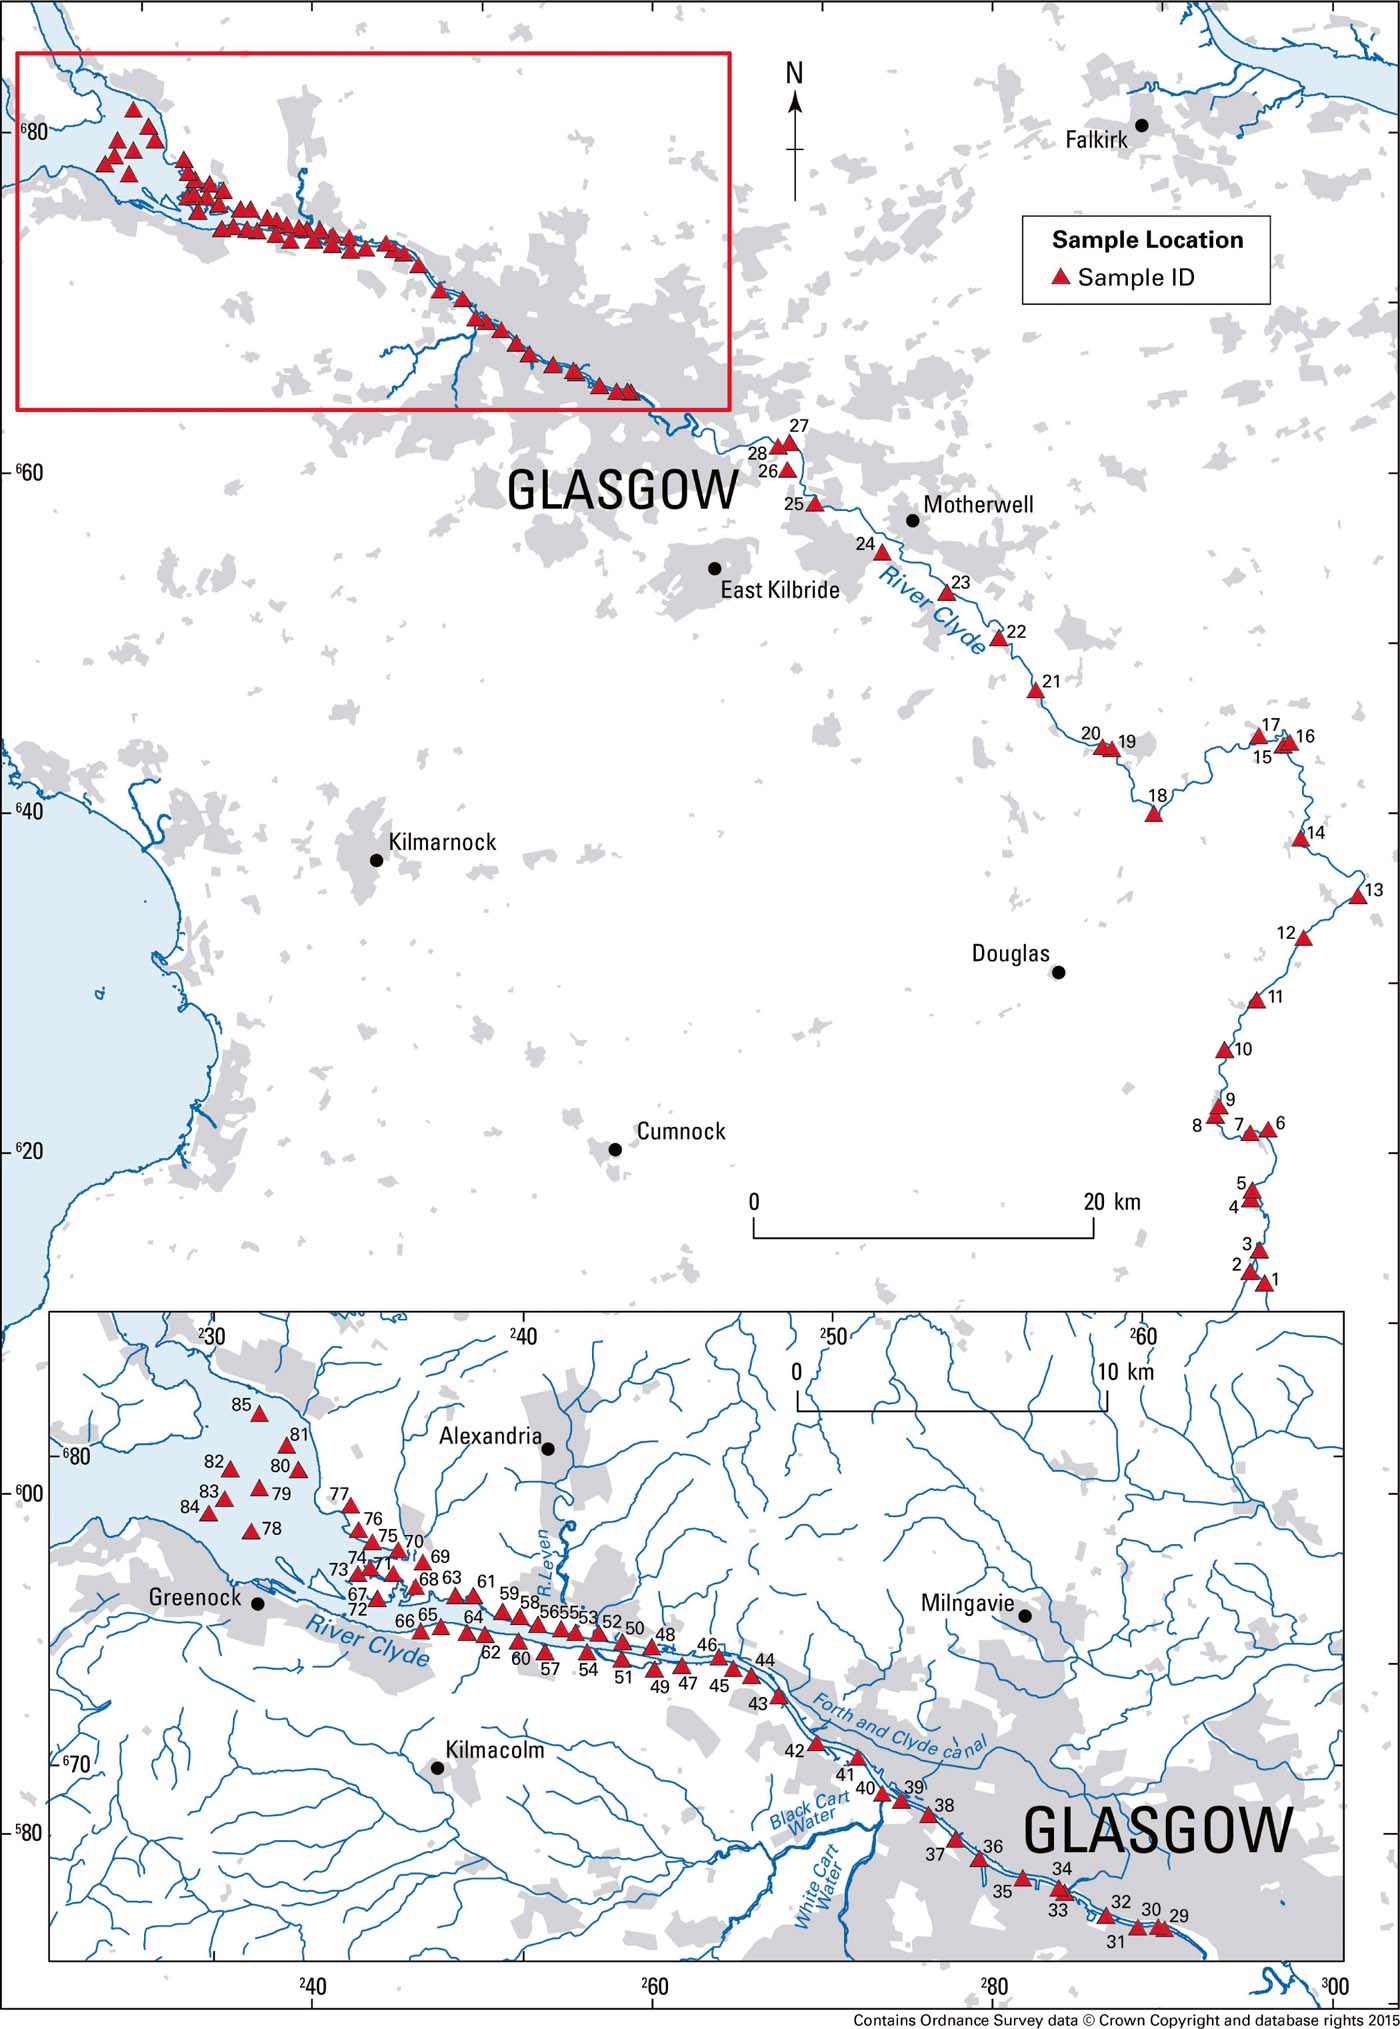
Figure 1 Location of surface sediment sample sites in the River Clyde, Scotland, UK.
1.2. Sample collection
Sample collection is described in Vane et al. (Reference Vane, Moss-Hayes, Kim, Edgley and Bearcock2018). Briefly, surface sediments (0–10cm depth), covering a maximum deposition time of 30 years (Vane et al. Reference Vane, Chenery, Harrison, Kim, Moss-Hayes and Jones2011, Reference Vane, Moss-Hayes, Kim, Edgley and Bearcock2018), from 85 sites from the upper reaches of the River Clyde to the outer estuary (Fig. 1), were collected from the active water channel using a steel trowel or a stainless steel van Veen grab. All sediments were kept in the dark, in cool boxes at approximately 4°C, and subsequently frozen (-18°C) prior to transport to the British Geological Survey (BGS) laboratories. Upon return to the laboratory, each sample was freeze-dried, disaggregated, passed through a brass sieve with an aperture of 2mm and milled in agate to approximately <40μm.
1.3. Total organic carbon (TOC), δ13C composition and total nitrogen (TN)
The method used to measure TOC is reported in Vane et al. (Reference Vane, Moss-Hayes, Kim, Edgley and Bearcock2018). δ 13C and TN were determined using a Europa Scientific Elemental Analyser. The reference material used for δ13C analysis was IA-R001 (δ13CVPDB (Pee Dee Belemnite) −26.4‰). For quality control purposes, check samples of IA-R001, IA-R005 (δ13CVPDB −26.0‰) and IA-R006 (δ13CVPDB −11.6‰) were analysed with the batches of samples. The instrumental reproducibility, based on the standard deviation of 16 runs, was ±0.05 for δ13C and ±0.02 for TN. IA-R001, IA-R005 and IA-R006 were calibrated against and traceable to IAEA-CH-6 (δ13CVPDB −10.4‰), an inter-laboratory comparison standard distributed by the International Atomic Energy Agency (IAEA), Vienna.
1.4. GDGT analyses
Freeze-dried sediments were extracted using an accelerated solvent extractor (Dionex 200) operated at 100°C and 7.6 × 10⁶Pa, with dichloromethane (DCM):MeOH (9:1, v:v) to obtain a total lipid extract (TLE). Internal standard C46 GDGT was added to the TLE, which was separated into an apolar and polar fraction in a glass pipette alumina oxide column, using n-hexane/DCM (9:1 v:v) and MeOH/DCM (1:1 v:v). The polar fraction was filtered through a polytetrafluoroethylene filter (0.45μm) and analysed using high-performance liquid chromatography–mass spectrometry (LC–MS), following a slightly modified method from Schouten et al. (Reference Schouten, Huguet, Hopmans, Kienhuis and Damste2007). The LC was an Ultimate 3000 series HPLC instrument, fitted with a Prevail Cyano column (2.1×150mm, 3μm; Alltech, Deerfield, IL, USA) maintained at 30°C. Tetraethers were eluted isocratically with 99% hexane and 1% isopropanol (IPA) for 5min, followed by a linear gradient to 1.8% IPA in 45min. Flow rate was 0.2mlmin–1. The MS system was a Thermo TSQ Quantiva MS instrument. Detection was achieved using atmospheric pressure positive ion chemical ionisation–MS (APCI–MS) operated in a single ion monitoring mode. Conditions for APCI–MS were as follows: sheath gas 20, auxiliary gas 2, ion transfer tube 325°C, vaporiser 400°C, positive ion discharge 2. GDGT distributions were determined by integrating the summed peak areas in the respective [M + H] + chromatograms and converted to concentrations by comparison to the internal standard peak. The BIT index was calculated according to Hopmans et al. (Reference Hopmans, Weijers, Schefuss, Herfort, Damste and Schouten2004) including the isomers for brGDGT IIa and IIIa:
 $$BIT = {[Ia] + [IIa] + [IIa^\prime] + [IIIa] + [IIIa^\prime] \over [Ia] + [IIa] + [IIa^\prime] + [IIIa] + [IIIa^\prime] + [IV]}$$
where [Ia], [IIa], [IIa′], [IIIa] and [IIIa′] are the concentration of branched GDGTs and [IV] the concentration of the isoprenoid GDGT, crenarchaeol (Fig. 2).

Figure 2 Molecular structures of brGDGTs (I–III) and crenarchaeol (IV) (De Jonge et al. Reference De Jonge, Stadnitskaia, Hopmans, Cherkashov, Fedotov and Sinninghe Damste2014).
The instrumental reproducibility of the BIT index was determined by duplicate measurements of all samples, with an average standard deviation of ±0.01. Statistical analysis was performed using Sigma Plot 13.
2. Results and discussion
2.1. TOC and TN in the Clyde sediments
The TOC concentration of the Clyde sediments is described in Vane et al. (Reference Vane, Moss-Hayes, Kim, Edgley and Bearcock2018). Briefly, TOC ranges from 0.08 to 6%, with higher values in the city of Glasgow (sites 29–47) and outer estuary (sites 78–85; Figs 1, 3). The authors explained this distribution as being due to higher anthropogenic activity in these areas, and supported this hypothesis by showing a concomitant increase in mercury concentrations and the presence of an unresolved complex mixture, suggesting oil input into these sites. TN also has a similar trend down the river, ranging from 0.02 to 0.6% (Fig. 3). An average N content of 0.04% is recorded in sediments of the upper river (sites 1–28), which increases to an average of 0.3% in the Glasgow area (sites 29–47). It then decreases to an average of 0.04% in the inner estuary, an area characterised by its low industrialisation and sewage effluents. Finally, TN increases to an average of 0.2% in the outer estuary. The increase in TOC and TN in the urban areas of Glasgow are expected due to major industrial activity and discharge from sewage treatment works, serving a population of 1.2 million. The outer estuary is affected in a similar way, due to a long history of ship yards, docks and marinas, and it receives waste from various municipal and industrial sources, including dredge spoil. This area also receives waters and sediments from the Sea Loch (Gareloch), which takes municipal and industrial effluents on the northern bank (Fig. 1). Although the TOC and TN in the River Clyde are quite variable, their content is comparable to previously reported values from the Clyde and other estuaries in the UK. For instance, TOC values ranging from 0.2 to 5% were reported in sediments from the Clyde estuary and Gareloch (Edgar et al. Reference Edgar, Davies, Hursthouse and Matthews1999). Similarly, Lopes dos Santos & Vane (Reference Lopes dos Santos and Vane2016) found maximum values of 6% TOC and 0.6% TN in the Thames estuary, which are comparable to the maximum values in the current study (Fig. 3).
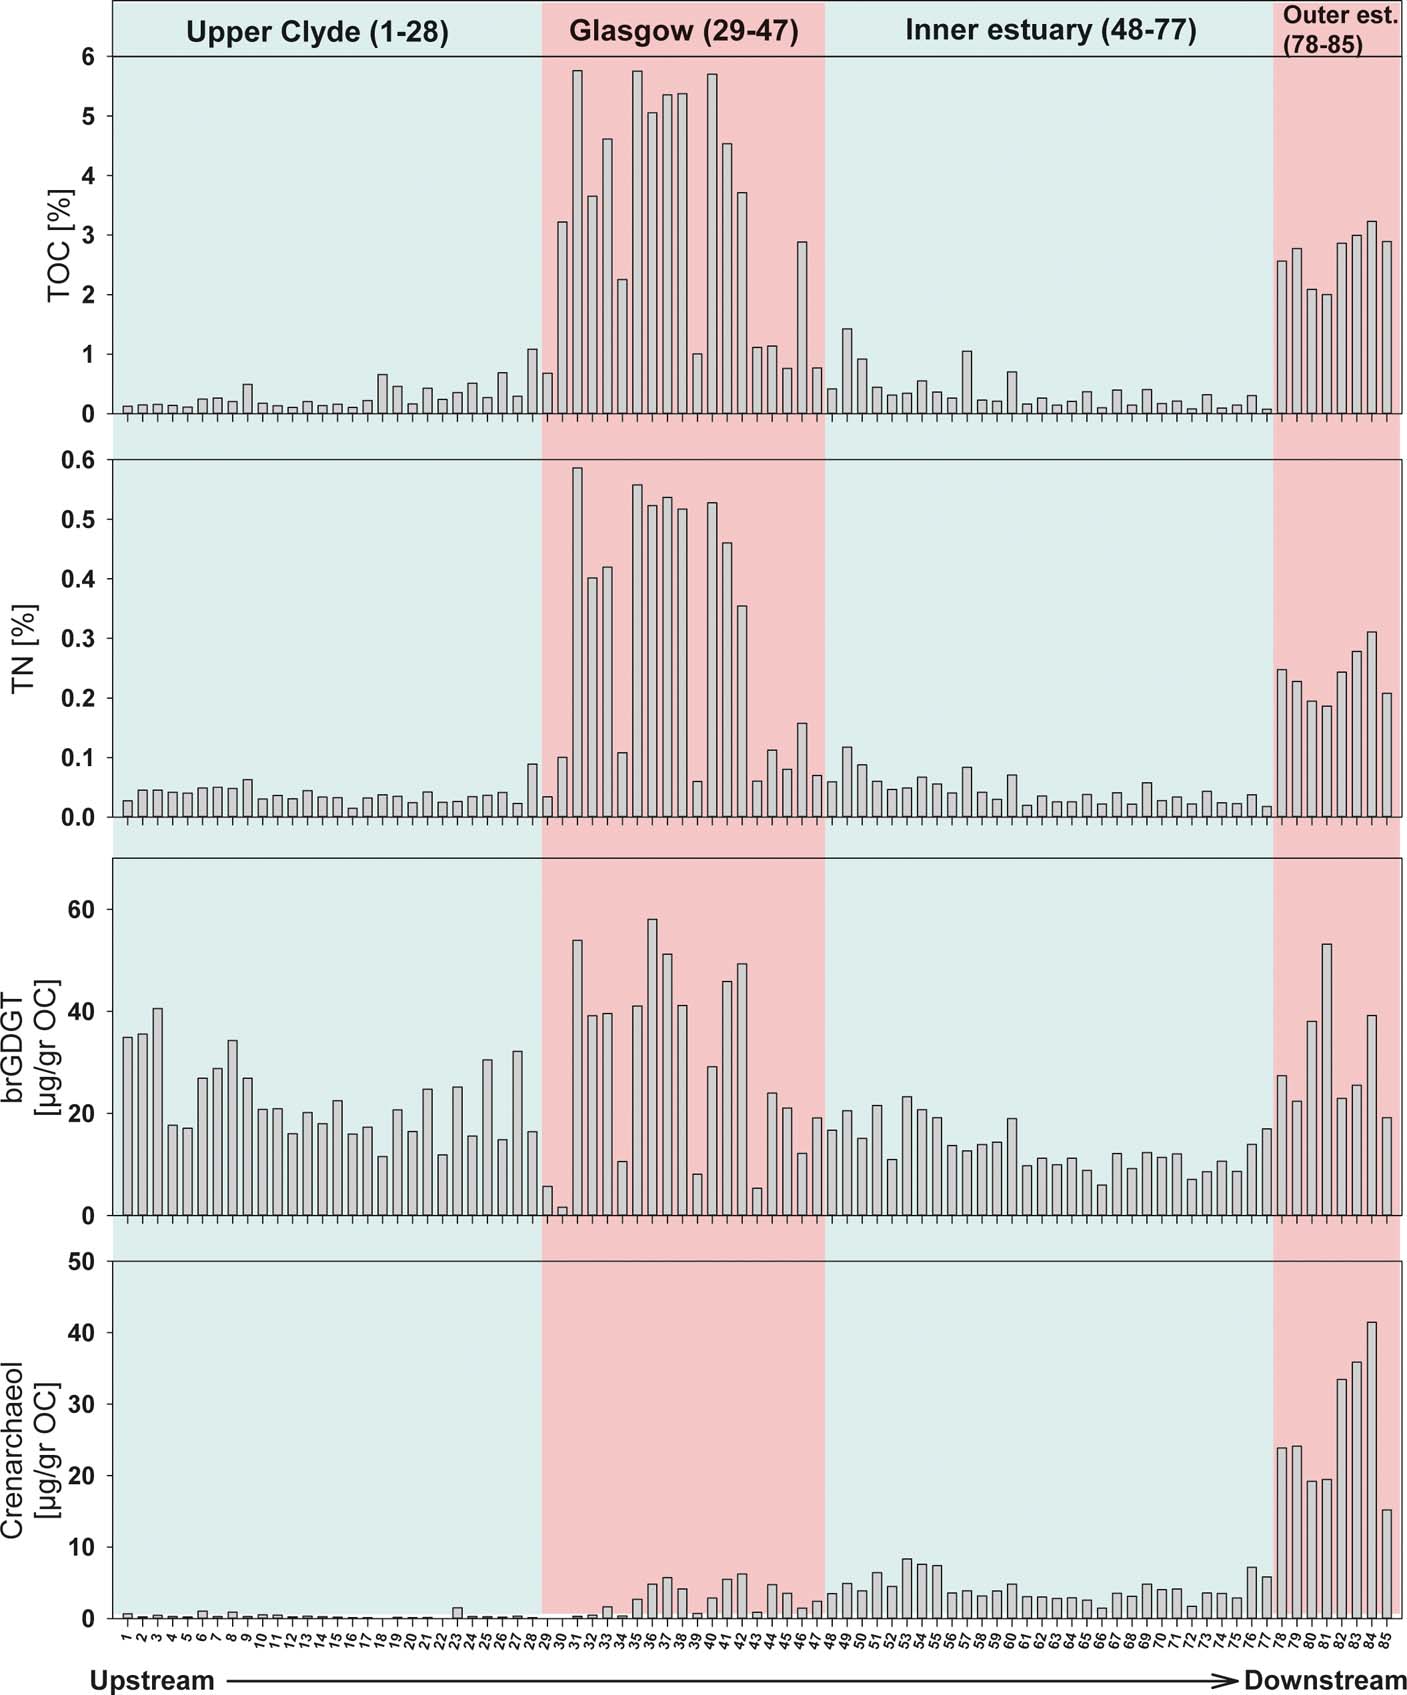
Figure 3 Spatial distribution of tetraether concentrations, total organic carbon (TOC) and total nitrogen (TN) in surface sediments from the River Clyde, Scotland, UK.
2.2. GDGTs in the Clyde sediments
The total concentration of brGDGT ranges from 1.6 to 58μgg–1 OC (Fig. 3), with higher concentrations in the upper river (sites 1–3), around Glasgow city area (sites 29–47) and at the outer estuary (sites 78–85; Fig. 3). The elevated concentrations observed in the upper river may be explained by either the peat-rich composition of the soils and/or the greater amount of eroded soil carried into the river due to the steeper gradients encountered in upland areas, as these compounds can be produced by soil heterotrophic bacteria. The high brGDGT concentration (>30μgg–1 OC) around urban Glasgow and in the outer estuary may be attributed to enhanced anthropogenic pollution and/or additional sedimentation of soil OM. This is substantiated by corresponding increases in TOC and TN at these areas, which suggest that if the in-situ production of brGDGTs is happening, the process does not generate enough material to overprint the soil-derived brGDGT concentrations.
The isoprenoid GDGT crenarchaeol ranges from minimum values of ∼0.01μgg–1 OC in sediments from the upper river to a maximum value of 42μgg–1 OC in sediments from the outer estuary (Fig. 3). This distribution along the River Clyde is expected, as crenarchaeol is believed to be mainly produced by marine Thaumarchaeota (DeLong et al. Reference DeLong, King, Massana, Cittone, Murray, Schleper and Wakeham1998). However, small amounts of crenarchaeol have been measured in soils, and their production has also been recorded in freshwater systems (Zell et al. Reference Zell, Kim, Balsinha, Dorhout, Fernandes, Baas and Damste2014). Nevertheless, in our study, crenarchaeol concentrations increase downstream of the tidal weir (Site 28) by 50 times, and by 800 times in the outer estuary, supporting the premise that in the saline zone, crenarchaeol is predominantly marine. Lopes dos Santos & Vane (Reference Lopes dos Santos and Vane2016) found that increased crenarchaeol concentrations in the Thames estuary sediments were related to anthropogenic pollution such as the discharge of treated sewage effluent in and around East London. Unfortunately, in this current study, the spatial sampling resolution does not allow for this forensic level of environmental interpretation. Overall, a different pattern from the Thames is evident in the River Clyde, in which similar amounts of crenarchaeol occur in the urban reaches of Glasgow and in the inner estuary (Fig. 3), which suggests that Glasgow does not perturb the expected land-to-sea concentration gradient.
To evaluate if the spatial abundance of the GDGTs observed in the Clyde river system is similar to those reported globally in other river systems, data from the literature are examined. The concentrations of brGDGTs in the River Clyde are comparable to other rivers across the world (Fig. 4). The maximum concentration of 58μgg–1 OC (mean ∼26μgg–1 OC) in the freshwater zone of the River Clyde is comparable to the maximum concentration of 40μgg–1 OC found in riverbank sediments from the Tagus River, Portugal (mean ∼10μgg–1 OC; Zell et al. Reference Zell, Kim, Balsinha, Dorhout, Fernandes, Baas and Damste2014). The maximum concentration of brGDGTs in the River Clyde is also comparable to the concentration maximum recorded in the Yellow River (∼53μgg–1 OC; mean ∼17μgg–1 OC; Wu et al. Reference Wu, Ruan, Ding, Zhao, Xu, Yang, Ding and Pei2014), but is higher than the concentration maximum of ∼5μgg–1 OC observed in the Amazon River (Kim et al. Reference Kim, Zell, Moreira-Turcq, Perez, Abril, Mortillaro and Damste2012). This lack of correspondence suggests that the concentrations of brGDGTs are not positively correlated with the catchment area, but with the extent of soil erosion. Identification of the main source areas for brGDGTs in the different catchments, by analysing catchment soils, and proper quantification of the amount of river-derived brGDGTs will help understand why smaller rivers can have higher concentrations of these compounds in comparison to larger rivers. However, it is important to note that the sampling pattern in most of the studies, including the current study, probably reflects a local distribution/concentration of brGDGTs, rather than the brGDGT distribution/concentration of the system. BrGDGT content in the Thames estuary sediments had a maximum value of ∼16μgg–1 OC (Lopes dos Santos & Vane Reference Lopes dos Santos and Vane2016), which is comparable to the concentrations found here for the Clyde inner estuary sites. However, the Clyde outer estuary sediments showed a maximum concentration almost four times greater than in the Thames estuary. This confirms that the Clyde outer estuary receives a large amount of soil- and river-derived material supporting the increase in TOC, TN and other anthropogenic products such as mercury and hydrocarbon fuels and lube oils (Vane et al. Reference Vane, Moss-Hayes, Kim, Edgley and Bearcock2018). The crenarchaeol concentrations recorded in the freshwater reaches of the River Clyde are comparable to the maximum crenarchaeol concentration in the sediments of the Tagus riverbank and the Yellow River (Fig. 4). Again, Amazon River sediments contained the lowest concentrations compared to the other rivers. Comparison between the Clyde and the Thames estuaries shows that the maximum concentration in the outer Clyde is double that reported in the Thames estuary (Lopes dos Santos & Vane Reference Lopes dos Santos and Vane2016), in-line with its more marine depositional setting (Fig. 1).
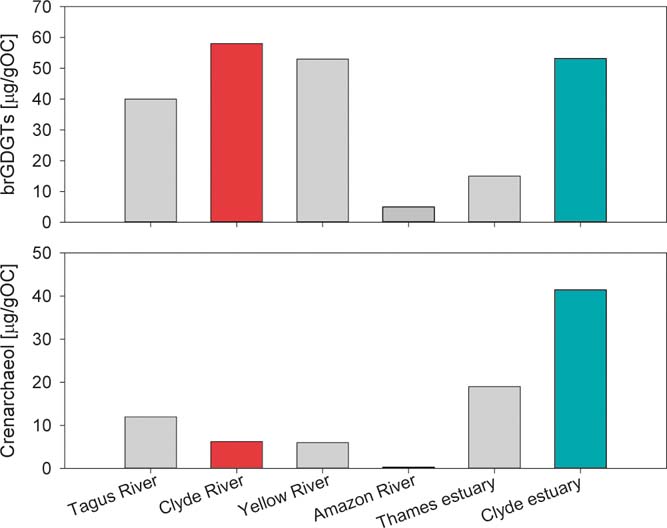
Figure 4 Comparison of maximum concentrations of sediment brGDGTs and crenarchaeol in different river systems: Tagus River (Zell et al. Reference Zell, Kim, Balsinha, Dorhout, Fernandes, Baas and Damste2014); Yellow River (Wu et al. Reference Wu, Ruan, Ding, Zhao, Xu, Yang, Ding and Pei2014); Amazon River (Kim et al. Reference Kim, Zell, Moreira-Turcq, Perez, Abril, Mortillaro and Damste2012); Thames estuary (Lopes dos Santos & Vane Reference Lopes dos Santos and Vane2016).
2.3. Fractional distribution of brGDGTs in the Clyde
In-situ production of the brGDGTs in the river cannot be completely excluded at this point as it has been recorded in other rivers (Zell et al. Reference Zell, Kim, Balsinha, Dorhout, Fernandes, Baas and Damste2014). To address this problem, a few methods have been used to try to determine the provenance of brGDGTs in river systems. Analysis of intact brGDGTs and separation of 5- and 6-Me brGDGTs are two ways to evaluate changes in sources of the brGDGTs (De Jonge et al. Reference De Jonge, Stadnitskaia, Hopmans, Cherkashov, Fedotov and Sinninghe Damste2014; Zell et al. Reference Zell, Kim, Balsinha, Dorhout, Fernandes, Baas and Damste2014; Freymond et al. Reference Freymond, Peterse, Fischer, Filip, Giosan and Eglinton2017). However, both methods involve new analytical techniques not used in this study. Another method used to identify the source of the brGDGTs is to examine their fractional abundance; i.e., the relative amount of brGDGTs with different methyl branches and cyclic structures (Sinninghe Damsté Reference Sinninghe Damste2016). The fractional abundance of the brGDGTs in this current study shows that the dominant brGDGTs in most of the samples are IIa+II′a (40%), followed by Ia (30%) and finally IIIa+III′a (15–20%), with an exception at the lower reaches of the upper Clyde zone, where the distribution is IIa+II′a (35%), followed by IIIa + III′a (32%) and finally Ia (17%) (Figs 2, 5). A clearer way to investigate this change is to examine the fractional abundance down the reach of the river-estuary system. The sum of the pentamethylated brGDGTs (II+II′a, b and c) is dominant for most of the river reach, with fractional abundance >40% (Fig. 6). It is noted that the percentage of hexamethylated brGDGTs (III+III′a, b and c) increases from sites 1 to 30, where it declines ∼10% and remains at values of ∼20%. By contrast, the tetramethylated brGDGTs (Ia, b and c) increase by ∼10% at Site 30, from where they gradually increase to similar proportions compared to the pentamethylated brGDGTs in the estuary. This change in fractional distribution occurs just downstream of the tidal limit of the River Clyde (Site 28). A possible reason for this is a change in the source of the brGDGTs: riverine- (in-situ) versus soil-derived (allochthonous), caused by the presence of the tidal weir and/or a change in salinity around this area that is modifying the community, influencing the tetraether distribution. Further work should compare the brGDGT fractional distribution in the Clyde sediments with the one in suspended material and soils around the River Clyde catchment, to determine their exact environmental source. Nevertheless, the variation in fractional distribution does not correlate with the variation of the brGDGT concentrations across the river, which suggests that the change in concentration is not due to a shift in OM source, but rather a change in the amount of material entering the river.
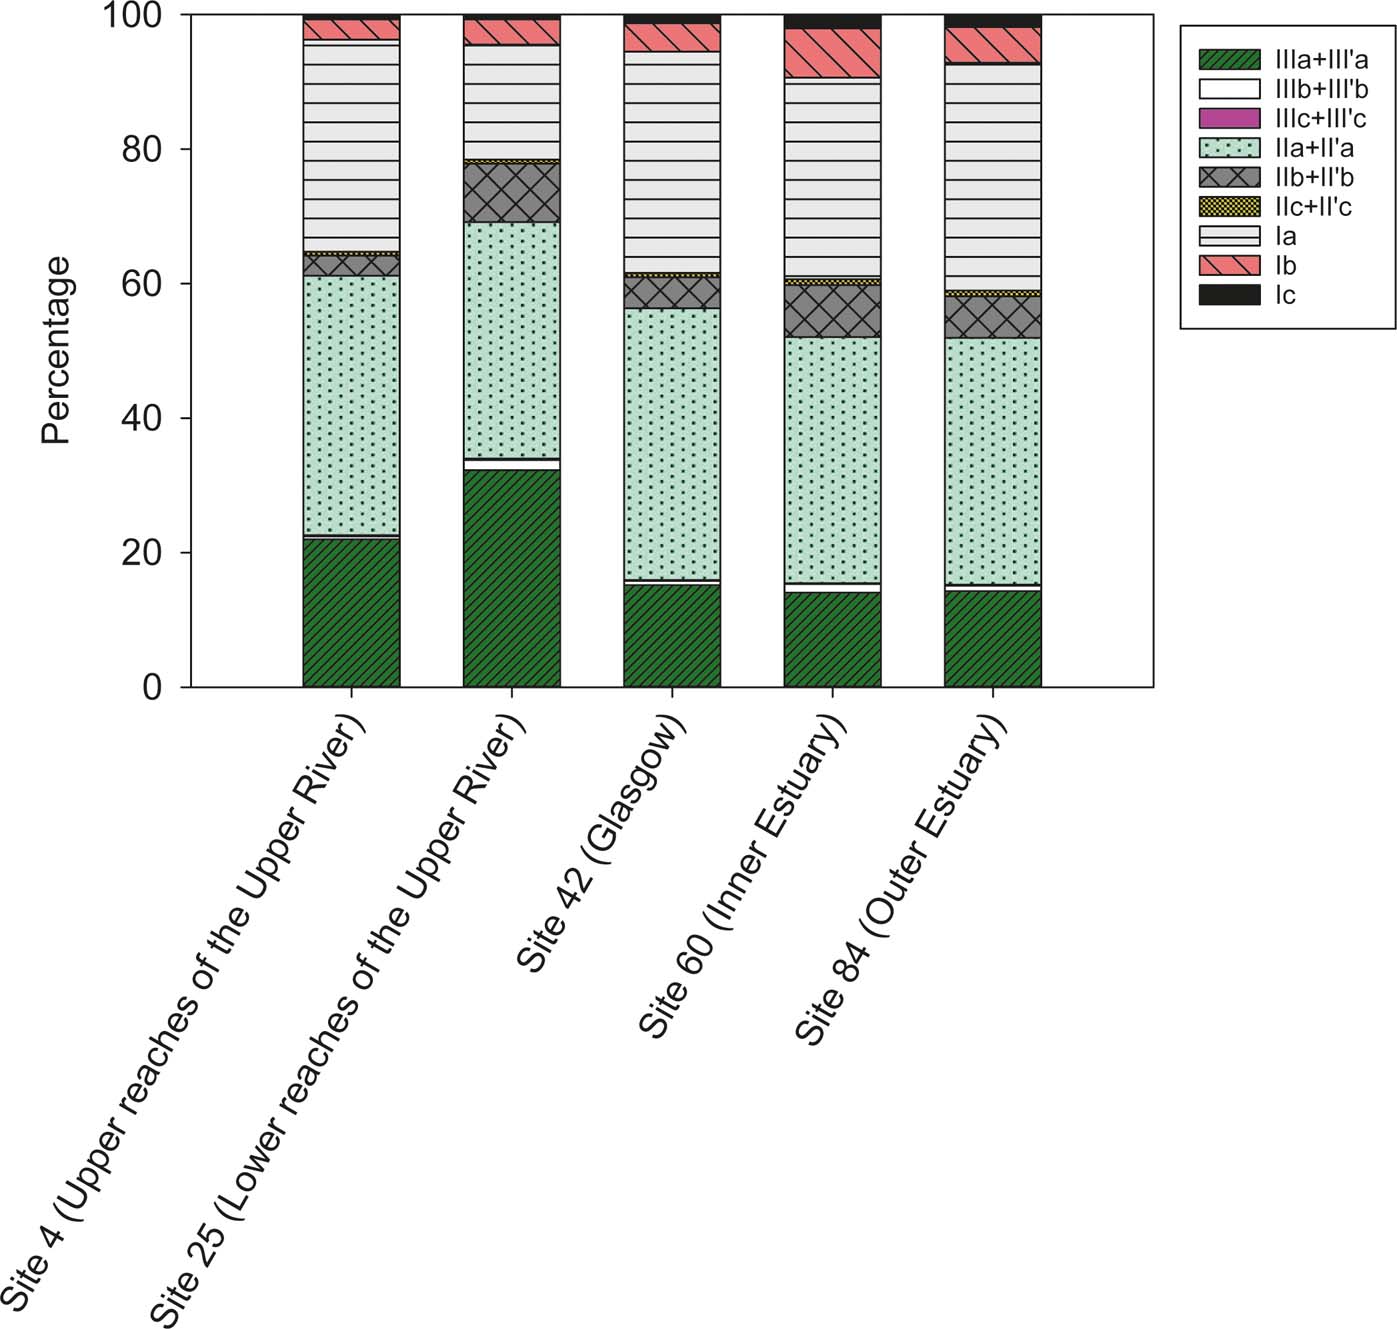
Figure 5 Comparison of the fractional distribution of brGDGTs in five sediment samples from the River Clyde, Scotland, UK.
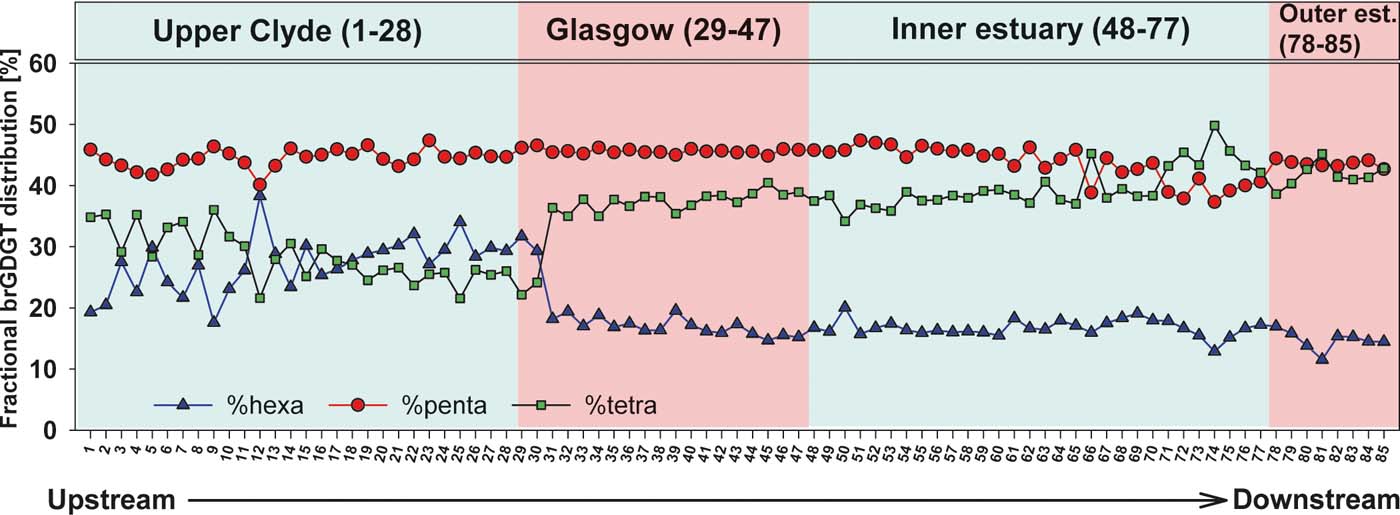
Figure 6 Downriver profile of the fractional distribution of brGDGTs in sediments from the River Clyde, Scotland, UK.
2.4. Terrigenous versus marine OM contribution in the Clyde sediments
In this study, three proxies (BIT, δ13C and C/N) are used to examine the terrigenous versus marine OM contribution in the Clyde sediments (Fig. 7). The sedimentary BIT index ranges from ∼1 in the upper river to a minimum value of ∼0.4 in the outer estuary. The highest values occur in the upper river, from sites 1 to 33. From there, it gradually decreases downstream due to the increase in the crenarchaeol, reflecting the rise in marine OM contribution. Indeed, the Mann–Whitney U test (P<0.001) shows significant difference between the four zones (upper Clyde, Glasgow, inner estuary and outer estuary), confirming that BIT can be used to differentiate these zones. A second approach applied in this study is based on the carbon isotopic signature of the sediments. The primary rationale of this method is that organic carbon from C3 terrigenous plants (δ13C values ranging from −28 to −25 ‰) are distinct from marine algae, which yield values ranging from −22 to −19 ‰ (Lamb et al. Reference Lamb, Vane, Rees, Wilson and Moss-Hayes2007; Khan et al. Reference Khan, Vane, Horton, Hillier, Riding and Kendrick2015). These values remain largely unchanged when stored in river and wetland sediments and can, therefore, facilitate an estimation of OM sources (Kemp et al. Reference Kemp, Vane, Horton and Culver2010; Engelhart et al. Reference Engelhart, Horton, Vane, Nelson, Witter, Brody and Hawkes2013). In this study, the δ13C profile ranges from −28 to −23 ‰, and, compared to the BIT index, it demonstrates that both proxies can record a gradual decline in relative abundance of the terrigenous OM towards the sea, although BIT is strongly influenced by the increase in crenarchaeol. Presumably, this is because of a variety of in-estuary processes, which include decreasing soil input and a variety of particulate C losses, such as photo-oxidation and/or microbial degradation that can occur in river-estuarine transition zones (Heip & Herman Reference Heip and Herman1995). However, the δ13C profile shows greater variability than the BIT index, particularly at sites from the upper Clyde, and shows more marine values (−23 ‰) in the seaward section of the inner estuary compared to the low BIT values (0.4) in the outer estuary. It is likely that the δ13C values in the Clyde represent a mixed natural and anthropogenic isotopic signal, from sources other than vegetation and marine algae, creating considerable variability in the downriver profile. A large isotopic variability can also be found in freshwater algae and macrophytes, which can partly explain the inconsistency of the δ13C profile, especially in the upper reaches of the river (Finlay & Kendall Reference Finlay, Kendall, Michener and Lajtha2007). Another proxy applied to the source apportionment of sedimentary C in the River Clyde is the C/N ratio. Some studies suggest a threshold criteria value of ≥15 or ≥20 (e.g., Saito et al. Reference Saito, Nishimura and Matsumoto1989; Sampei & Matsumoto Reference Sampei and Matsumoto2001) for a terrigenous signal (plants). In the Clyde, the C/N ratio ranges from 0.05 to 32, but the majority of samples yield C/N values of <12 (Fig. 7), suggesting a marine OM input throughout the river, even in the freshwater part, contradicting the other proxies. The low C/N values observed, even in the more upstream-inland sites, may be explained by the presence of inorganic N. Indeed, Sampei & Matsumoto (Reference Sampei and Matsumoto2001) proposed that when the TOC is less than 1%, the presence of inorganic N can lower the C/N considerably, giving an inaccurate indication of organic source. Similar problems have been encountered in the use of total %N in sediments from other river-estuary systems, e.g., Humber and Mississippi (Lamb et al. Reference Lamb, Vane, Rees, Wilson and Moss-Hayes2007; Khan et al. Reference Khan, Horton, McKee, Jerolmack, Falcini, Enache and Vane2013). This may explain the lack of correlation between C/N ratios, BIT and δ13C.
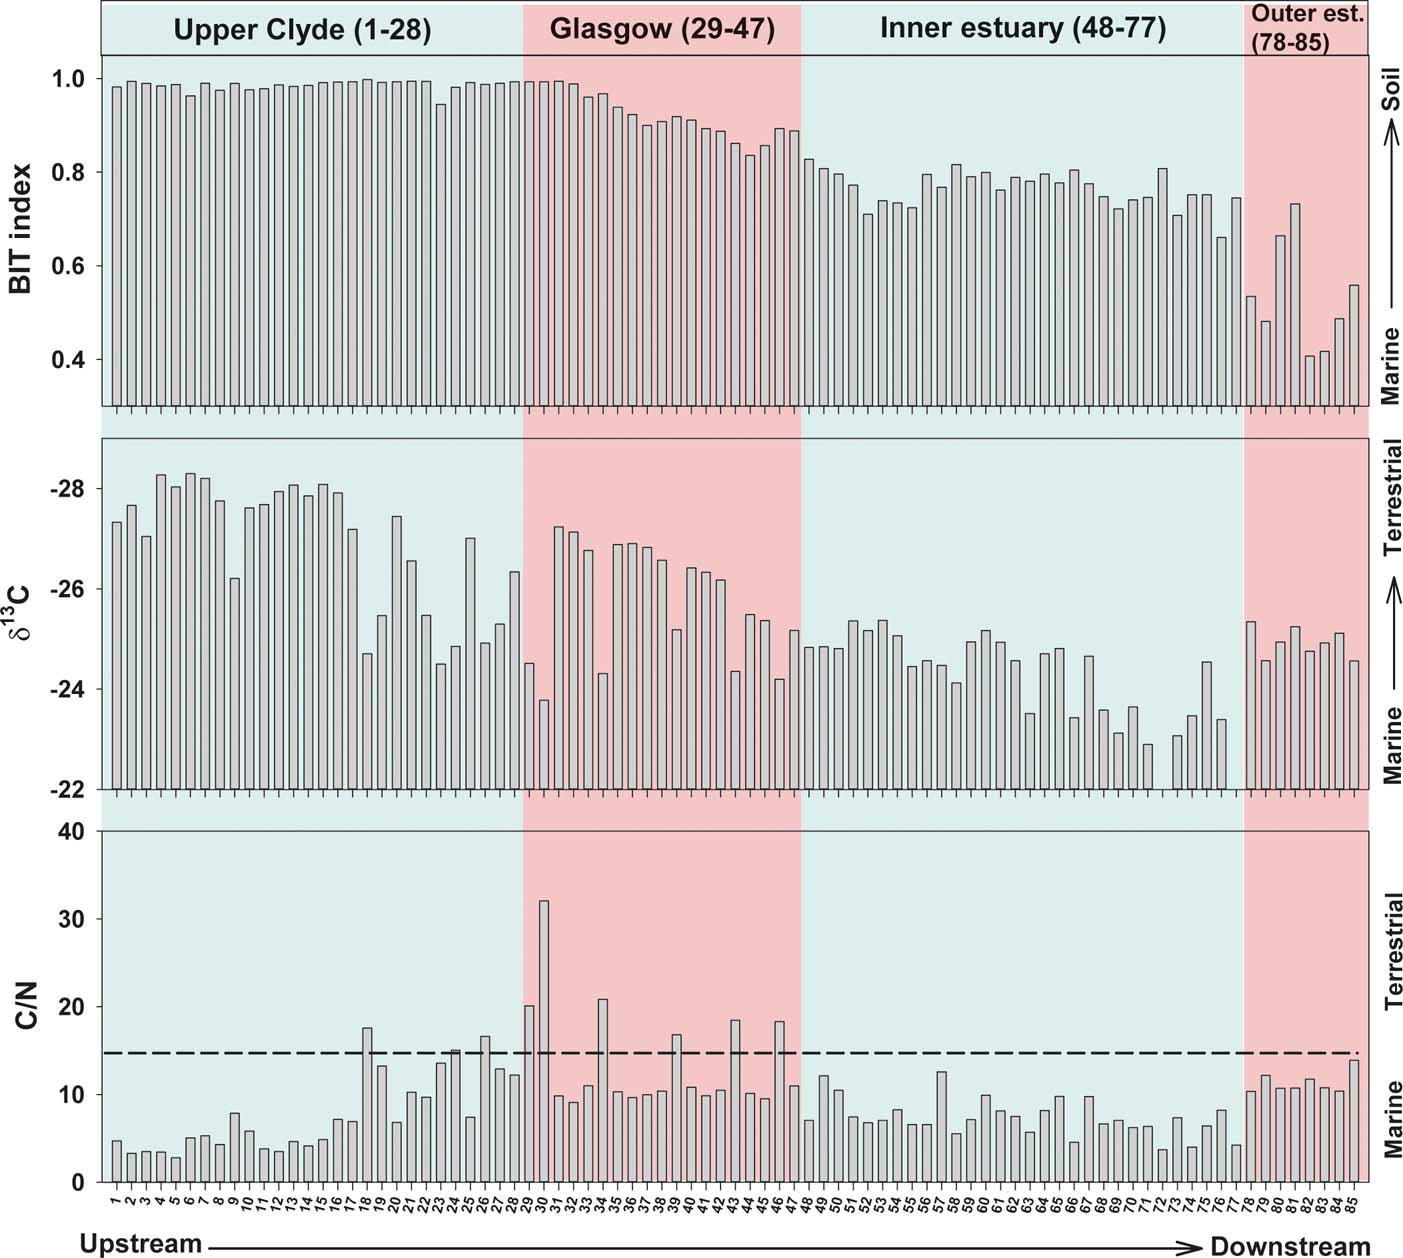
Figure 7 Comparison of the branched and isoprenoid tetraether (BIT), stable carbon isotope (δ13C) and carbon/nitrogen (C/N) profiles of surface sediments from the River Clyde, Scotland, UK.
3. Conclusions
From the spatial distribution of brGDGTs and crenarchaeol, it can be concluded that these compounds record the contribution of soil-derived versus marine-derived OM in the River Clyde. It is not possible to determine the extent of in-situ production of brGDGTs in the river, but it is clear that the downstream changes in brGDGT concentration are not strongly impacted by different brGDGT sources. The BIT index and δ13C are able to track changes in OM sources in the Clyde. However, the BIT index is mainly controlled by the marine input, whereas the δ13C is probably affected by different natural and anthropogenic sources. Conversely, the C/N ratio is an inaccurate indicator of OM source within the River Clyde. Although a higher input of terrigenous OM is recorded by TOC, TN and brGDGT concentrations in the surface sediments from Glasgow and outer estuary, none of the proxies (BIT index, δ13C and C/N) reflect these changes, due to a simultaneous increase of the numerator and denominator values. Further work should focus on the identification of the exact source of brGDGTs and crenarchaeol in urban-river settings to improve their utility as proxies in river systems, and to improve our understanding of land-to-ocean carbon transfer in the UK and worldwide.
4. Acknowledgements
The Clyde estuary samples used in this study were collected during a survey co-funded by the British Geological Survey (BGS) Estuarine Contamination project and Glasgow City Council. Thanks are due to the Scottish Environment Protection Agency (SEPA) who provided ship time (captain and crew) on the Research vessel Endrick II for the estuary survey. The collection of upper Clyde sediments was co-funded by the BGS Geochemical Baseline Survey of the Environment (G-BASE) and Estuarine Contamination projects. BGS colleagues Jenny Bearcock, Fiona Fordyce, Dave Jones, Bob Lister, Sarah Nice and Andreas Scheib, and all G-BASE student volunteers, are thanked for their assistance in sample collection. Support for this work was provided by Diarmad Campbell (CUSP) and Mike Ellis Landscape, Soils and Coasts, BGS. This paper is published with the permission of the Executive Director of the British Geological Survey, Natural Environment Research Council (NERC). BGS/NERC reference: PRP17/053.


