Introduction
Radiotherapy uses radiations from high-energy X-rays or particles to kill the cancer cells. The main goal of radiation therapy is to deliver tumouricidal dose to the target volume while minimising the dose to normal tissues. Radiotherapy has kept on improving with the advancement in computer-controlled accelerators and multi-leaf collimators which have allowed more precision and shaping of the radiation beam Reference Jordan and Williams1 . The impact of highly advanced gated treatment techniques such as intensity-modulated radiotherapy (IMRT) and volumetric-modulated radiotherapy (VMAT) has led to a paradigm shift in the radiotherapy treatment by enabling dose escalation as well as saving critical structures Reference Diwanji, Mohindra and Vyfhuis2 . Introduction of functional imaging and its incorporation to the radiotherapy planning process have led to improved delineation of gross tumour volume (GTV), thereby reducing the clinical target volume (CTV) to planning target volume (PTV) margins as well as the interobserver variability in delineation of tumours Reference Belohlavek, Carrio and Danna3 .
The oesophagus is a highly mobile organ due to the effects of swallowing and respiration. The imaging technique, the barium swallow, is the most common method used to diagnose the disease, but the size and extent of the disease can be diagnosed clearly by the endoscopic ultrasound (EUS) procedure and computed tomography (CT). Combined chemoradiation with or without surgery is commonly used to treat carcinoma oesophagus, and the use of concurrent chemoradition has been found to significantly increase the overall survival and cure rates compared to radiotherapy alone Reference Neuner, Patel and Suntharalingam4 . Dose considerations for oesophageal radiotherapy have been based mainly on the results of the radiation therapy oncology group (RTOG) 94–05 trial, in which the radiation dose of 50.4 Gy (45 Gy for the initial phase and 5.4 Gy for the boost phase) has been established as the standard dose for oesophageal chemoradiotherapy Reference Kachnic, Winter and Wasserman5 .
Contrast medium is administered both orally and intravenously to obtain optimal result from CT scan. Intravenous (IV) contrast (50 ml of IOHEXOL of concentration 350 mg I/ml) is injected for clear visualisation of vascular structures and oral contrast (50 ml of water mixed with 5 ml of Trazograf 76% concentration) for better delineation of oesophagus wall Reference Chandna, Siddesh, Jeevika and Kochar6 . The conventional contrast-enhanced CT-based contouring volumes do not depict the GTV exactly due to the poor contrast between the tumour and normal oesophagus Reference Njeh7 . This in turn overestimates the GTV volume, and generally a larger GTV results in a larger CTV and hence large PTV, thereby irradiating a lot of normal tissue. It is at this juncture that positron emission tomography (PET)-based tumour delineation is really helpful. PET CT acquisition has become mandatory for all patients who undergo high precision techniques as per recent technical document series (TECDOC)-1603. Addition of PET CT along with CT and MRI reduces the chances of geographical miss of tumour.
PET CT uses a radioactive tracer to find the metabolic activity of organ or tissue, one such commonly used radioactive tracer is fluorodeoxyglucose (FDG), so it is generally referred to as an FDG-PET scan. The role of PET in oesophagus cancers has been evaluated by several studies. Konski et al. (2005) performed CT and FDG-PET for radiation planning in 25 patients with oesophageal carcinoma; 18 of the 25 also had EUS for comparison. The length of the oesophageal GTV was compared between the three imaging modalities. Mean GTV as determined by CT scan was significantly longer than that determined by FDG-PET. Specifically, mean GTV lengths were 6.77, 5.4 and 5.1 cm, respectively, with CT, PET and EUS. The authors concluded that EUS and PET aid in precisely identifying the GTV for oesophageal cancer radiation planning Reference Konski, Doss and Milestone8 .
Quantification of FDG uptake on PET is generally analysed using standardised uptake values (SUV). SUV are obtained automatically on most modern-day PET/CT scanners. Proper SUV window selection while contouring is mandatory in defining the GTV volumes accurately. Fukunaga et al. (1998) found that 47 of 48 patients with oesophageal cancer had a primary tumour SUV greater than 2.0 (sensitivity of 98%). The mean SUV in primary tumours (6.99 ± 3.05; n = 48) was greater than normal oesophagus (1.34 ± 0.37; n = 10) Reference Fukunaga, Okazumi, Koide, Isono and Imazeki9 . Zhong et al. (2009) found that FDG PET-based GTV contouring at SUV 2.5 provided the closest estimation of gross tumour length in oesophageal cancers Reference Zhong, Yu and Zhang10 .
In the current scenario of carcinoma oesophagus, GTV generation is being done in the fused CT/PET images which include CT and PET information which covers more volume. In this study, we have attempted to use the PET uptake alone in the generation of gross tumour volumes and compared it against the conventional contrast-enhanced CT. We have also determined the effects of changes in target contours on the normal tissue doses by dosimetric comparison for the two scenarios.
Methods and Materials
Patient selection
Fifteen patients with carcinoma oesophagus (middle 1/3) who underwent RapidArc™ (Varian medical systems, Palo Alto, CA, USA) treatments were selected retrospectively for this study. All the patients were immobilised in supine position using 4 clamp Orfit (thermoplastic mask) with suitable head rest. Planning CT images were acquired for all patients in fasting condition at least 3 to 4 hours before scanning using Siemens definition 64-slice CT scanner (Siemens Medical Systems Concord, CA, USA). As per institutional protocol for oesophageal tumours, three sets of CT images were taken for all patients, namely, CT Plain, CTIV contrast and CToral contrast all of 3 mm slice thickness. CTIV contrast and oral contrast images were used for proper delineation of GTV, and CT plain images were used for the planning and dose calculation purposes. Similarly, all patients were asked to fast for at least 4 hours before PET CT scanning. Planning PET CT (with the same immobilisation and in the same treatment position) scanning was done using a Siemens biograph 16 slice PET scanner (Siemens Medical Systems Concord, CA, USA). CT images and PET CT images were fused using rigid registration algorithm in the Eclipse™ treatment planning system 13.6 (Varian medical systems, Palo Alto, CA, USA).
Contouring
Two sets of GTVs in fused CT plain images were generated by the radiation oncologists using the treatment planning system one with the help of contrast CT scan (GTVCT) and the other with only by PET uptake (GTVPET) by setting SUV level > 2.5. For the initial phase of 45 Gy, CTVs (CTVCT and CTVPET) were grown from the respective GTVs with the margin of 1.5 cm radially, 4.5 cm craniocaudally and 1.5 cm anterio-posteriorly, and for the second phase of 5.4 Gy, CTVs were generated from the respective GTVs with the margin of 1.5 cm all around Reference Wu, Bosch, Chang, Hong, Jabbour and Kleinberg11 . Similarly, PTVs were generated for both the CTVs, respectively, with the additional margin of 5 mm to account for setup variation and named identically. All the required critical structures such as lungs, heart and spinal cord were also delineated.
Planning
For all 15 patients, rapid arc plans were generated using the treatment planning system, plans were generated in both the PTVs (PTVCT and PTVPET) by using progressive resolution optimizer-3 (PRO-3), and dose calculations were performed using analytical anisotropic algorithm (AAA) with 2.5-mm grid resolution. During optimisation, criteria were set in order to cover the desired PTVs to 95% prescribed dose and critical structures to get as low as reasonably achievable without spoiling the PTV coverage and also by keeping corresponding GTV coverage close to 100% in order not to be biased on any particular method. The minimum PTV enclosed by 95% isodose line was 95%, and the maximum dose was kept within 107%. All patients were planned with dual-arc plans (1 arc starting from 179° to 181° counter clockwise and the other one starting from 181° to 179° clockwise). Treatment plans were done in two different phases of 45 Gy initially and 5.4 Gy for the boost phase.
Plan comparison
Volume of target contours was calculated using eclipse treatment planning system, and the reduction in volume (volume in CT – volume in PET) values was tabulated. Plan sum of both the plans was created, and cumulative dose volume histograms were used to evaluate the plan. Critical structures doses such as lung V20% (percentage of lung volume receiving 20% of the dose) and V10% (percentage of lung volume receiving 10% of the dose) for individual lungs and mean dose for combined lung, heart mean dose and V30% (percentage of heart volume receiving 30% of the dose), spinal cord maximum dose and planning organ-at-risk volume (PRV) 3 mm spinal cord maximum doses were tabulated for comparison.
Statistical analysis
To find the importance of significance, we utilised the Wilcoxon signed-rank test with two tails by using Microsoft office excel software version 2007. The null hypothesis was set that both PET-based and CT-based data have the same mean with 95% confidence limit. In this way, if we get p value less than or equivalent to 0.05, then the differences in the two strategies are statistically significant.
RESULTS
Volume comparison
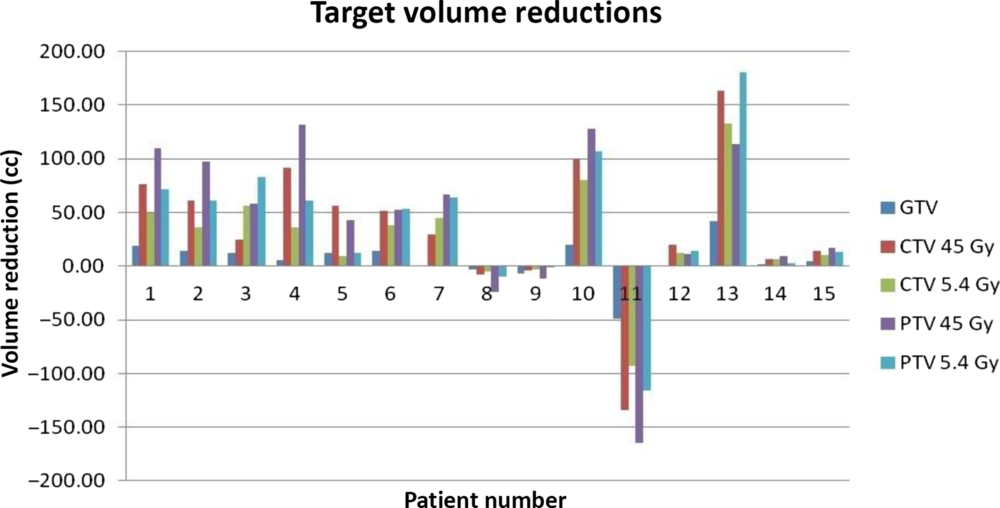
The plans which satisfied the clinical goals were taken for comparison. Volumes of GTV, CTV45, CTV5.4, PTV45 and PTV5.4 from both the scenarios were calculated from treatment planning system and the difference in volumes being determined by keeping the CT-based GTV as the reference. Figure 1 shows the change in volume of GTV, CTV 45, CTV 5.4, PTV 45 and PTV 5.4 for all 15 patients. The changes in volume varied among the patients with some having greater variation and some showed minimum variation and a very few had no difference. Patient 13 had the largest GTV reduction of 48.6%, patient 7 had the least reduction of 0.13% and patient 11 had the increase of GTV volume by 76.4%. Figure 2 depicts the difference in GTV delineation between PET derived and CT derived for patient 1.

Figure 1. Target volume reductions between CT- and PET-based GTV.

Figure 2. GTV delineation based on CT (cyan) and PET (orange) for patient 1.
As shown in Table 1, mean reduction (average reduction in GTV volume with respect to GTV derived from CT) in GTV was 5.76 ± 19.35 cc (p value 0.054), and mean reduction in CTV45 Gy and CTV5.4 Gy was 36.5 ± 65.61 cc and 27.44 ± 48.99 cc (p values 0.017 and 0.015), respectively. Similarly, reduction in PTV45 Gy and PTV 5.4 Gy was 42.40 ± 76.39 cc and 39.37 ± 66.19 cc (p values 0.036 and 0.023), respectively.
Table 1. Characteristics of change in target volume

* SD, standard deviation.
Dose comparison
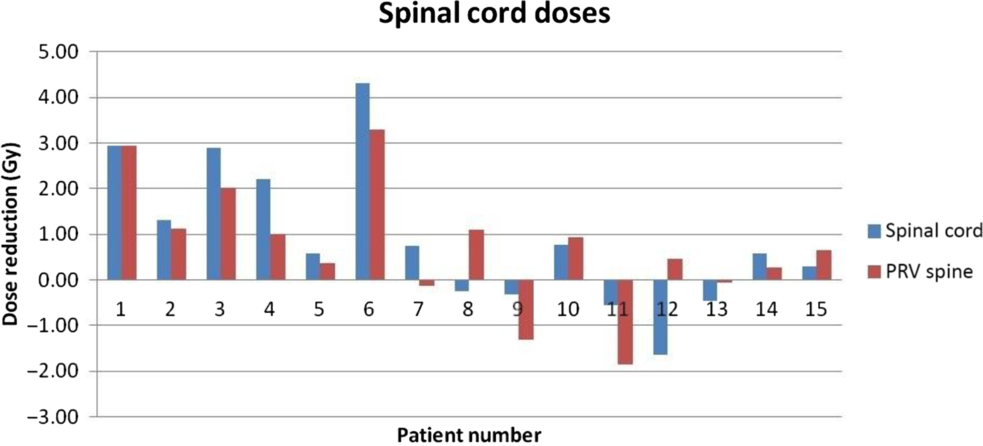
From the dose volume histogram (DVH) analysis, critical structure doses such as lung V20%, V10% and combined lung mean dose, heart mean and V30% doses and spinal cord doses were determined. Figures 3, 4 and 5 indicate the change in heart, lungs and spinal cord doses of all 15 patients, respectively. Figure 6 indicates the variation of critical structure doses between PET-based and CT-based GTV contouring for the patient 1, Respective GTV coverage showed almost close to 100% in both the methods.

Figure 3. Variation of heart dose between CT- and PET-based GTV.

Figure 4. Variation of lung dose between CT- and PET-based GTV.

Figure 5. Variation of spinal cord dose between CT- and PET-based GTV.

Figure 6. Variation of critical structure doses in CT- and PET-based GTV plans for patient 1.
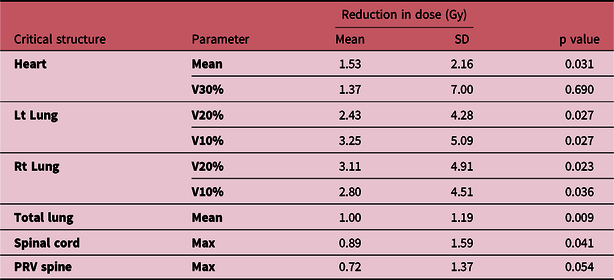
As shown in Table 2, mean reduction (average reduction in heart mean dose with respect to heart mean dose in CT) in heart mean dose was 1.53 ± 2.16 Gy (p value of 0.031). Heart V30% doses showed insignificant difference (p = 0.69). Mean reduction in left lung V20% and V10% was 2.43 ± 4.28 and 3.25 ± 5.09 Gy (p values of 0.027 and 0.027). Mean reduction in right lung V20% and V10% was 3.11 ± 4.91 Gy and 2.80 ± 4.51 Gy, respectively (p values of 0.023 and 0.036). Mean reduction in combined lung mean dose was 1.00 ± 1.19 Gy (p value 0.009). Spinal cord maximum dose to a point was always less than 50 Gy in all patients for both the plans. The p value of 0.041 for spine maximum dose shows that there was a significant difference in both the plans. However, the p value of 0.054 for PRV spine shows that there was no significance of PRV spinal cord dose in both the plans.
Table 2. Characteristics of change in critical structure doses

Discussion
Feasibility of PET-alone GTV delineation has been analysed in our work. The changes in tumour volume and critical structure dosages were varied among the patients. Moureau-Zabotto et al. (2005) found that the usage of PET data to CT-based radiotherapy treatment changed the GTV in 19 of 34 patients (56%). GTV was decreased in 12 (35%) patients and expanded in 7 (21%) Reference Moureau-Zabotto, Touboul and Lerouge12 . In our study, out of 15 patients, 12 patients (80%) showed reduction in GTV volume, and 3 patients (20%) showed increase in GTV volume over conventional CT-based contouring this may be because of the direct conversion of PET uptake as GTV. Except patients 8, 9, 11, all others showed reduction in GTV while using only PET uptake. Target volumes such as CTV 45, CTV 5.4, PTV 45 and PTV 5.4 showed significant reduction (p < 0.05) in volume while considering only PET for GTV generation. Five patients’ GTV reduced in the range of 0–10 cc, and seven patients’ GTV reduced more than 10 cc.
As for the heart mean dose is concerned, 10 out of 15 patients (66.7%) showed reduction in heart mean dose, and 7 out of 15 patients showed reduction in heart V30% dose. Patient 3 showed maximum reduction in heart mean dose, and this is due to the reduction of PTV volumes in anterior and caudal directions in PET-based GTV contouring. Patient 10 showed minimum deviation among all studied, and this is because of very minimum deviation of GTV in anterior direction. Patient 12 showed increase in heart dose since the PET-based GTV increased the PTV volumes considerably in the anterior direction.
Leong et al. (2006) described that changes in the depiction of the GTV by fused FDG-PET with CT influenced the level of aggregate lung volume receiving >20 Gy in 25 patients (74%), with doses decreased in 12 patients and incremented in 13 patients Reference Leong, Everitt and Yuen13 . Clinicopathological studies in patients undergoing resection show that CT scanning is very poor in finding the craniocaudal extension of tumour, and for nodal involvement, it is often inaccurate, but it is reasonably good in showing the radial extent than PET Reference Seol and Lee14,Reference Schiraldi, Popescu and Chiericozzi15 . PET is significantly more accurate in the assessment of nodes and longitudinal extension of the tumour. In our study while comparing the lung doses, it was found that 11 out of 15 patients (73%) showed decrement in left lung doses, 12 out of 15 patients (80%) showed decrement in right lung V20% doses and 13 patients (87%) showed decrement in right lung V10% doses. The reduction of lung doses was more in number due to the reduction of GTV in craniocaudal directions and in radial directions for most of the patients.
There are many studies about the impact of lung and heart doses on survival after radiotherapy in oesophageal cancers. Panjwani et al. (2016) studied cardiac toxicity after radiation in oesophageal cancers and found that incident of cardiac procedure and death due to cardiac problems increased in patients receiving radiation therapy Reference Panjwani, Fero and Murphy16 . Oh et al. (2018) studied the impact of lung and heart doses on survival after radiation and found that the outcome of the treatment could be improved by reducing the lung V20% dose considerably Reference Oh, Zhang and Brady17 . In other study, Shi et al. (2017) found that reducing the higher dose to heart and lung could significantly reduce the late toxic effects in patients cured with oesophageal cancer Reference Shi, Liao and Allen18 . Frandsen et al. (2015) found that for all patients receiving radiotherapy, the death from heart disease occurred at 1.46 times than those not receiving radiotherapy treatment Reference Frandsen, Boothe, Gaffney, Wilson and Lloyd19 . In this view, our study reduced heart mean dose (p = 0.031) and left and right lung V20% (p = 0.027 and 0.023) considerably and could very well reduce cardiac and lung late toxicities and improve the overall survival if this method is adopted.
P value of 0.041 for spinal cord shows that PET-based GTV generation can reduce spinal cord doses considerably. Several studies were conducted in order to find the significance of addition of PET information along with CT for carcinoma oesophagus but a very few only studied the PET alone GTV depiction. Yeung et al. (1999) studied 23 patients with oesophagus cancer PET alone correctly identified almost all primary tumours except one patient. FDG-PET had a sensitivity of 93% and specificity of 100% for detection of tumour at the primary site Reference Yeung, Macapinlac, Mazumdar, Bains, Finn and Larson20 .
Our outcomes ought to be interpreted by remembering two limitations. First, with the limitation of PET in finding the radial extension of the disease since CT is very good compared to PET in finding this Reference Schiraldi, Popescu and Chiericozzi15,Reference Anand, Singh and Dash21 , chances of radial miss may be possible in PET-alone GTV delineation. Second limitation is the sample size, since most of the studies supported the inclusion of PET and CT information for the generation of GTV to derive the confidence in PET-alone GTV generation for more number of studies to be conducted by keeping the outcome of the clinical results as well.
Since the current practice is to include both the PET and CT for GTV delineation, it is recommended to perform more prospective studies of outcomes (both local control and toxicity) and follow-ups when PET-only volumes are used which could be of greater interest to the wider oncology community.
Conclusion
Changes in the treatment volume and critical structure doses in this study show that PET-based GTV delineation reduces the treatment volume and critical structure doses significantly over CT-based GTV contouring for carcinoma oesophagus. Care must be taken while adopting only PET uptake for GTV generation in case of small volume tumours in order to avoid missing of tumour. Radial extent of the disease can be derived by also considering CT information.
Acknowledgements
None.
Financial support
This research received no specific grant from any funding agency, commercial or not-for-profit sectors.
Conflicts of interests
None.