


INTRODUCTION
Accurate description of the patterns of species distribution, biomass and abundance is crucial, since this information provides the basis for most ecological research (Benedetti-Cecchi et al., Reference Benedetti-Cecchi, Airoldi, Abbiati and Cinelli1996). In benthic communities, the estimation of patterns can be directly influenced by sampling procedures such as the number of samples, taxonomic resolution, sieve screen size (Bachelet, Reference Bachelet1990; James et al., Reference James, Lincoln-Smith and Fairweather1995; Tanaka & Leite, Reference Tanaka and Leite1998) and sampling depth (Schaffner, Reference Schaffner1990; Flach & Heip, Reference Flach and Heip1996).
Sieve mesh sizes commonly used for macrobenthic studies are 0.5 mm and 1.0 mm (Eleftheriou & Holme, Reference Eleftheriou, Holme, Holme and McIntyre1984; James et al., Reference James, Lincoln-Smith and Fairweather1995). Depending on the survey's purpose (e.g. population dynamics studies), it is imperative to determine the appropriate sieve size before initiating sampling at any scale (Mahadevan & Patton, Reference Mahadevan and Patton1979). For instance, in monitoring programmes, the assessment of macrobenthic community structure and productivity is a long and costly process that involves sorting, identifying and measuring large numbers of small organisms from the material collected (Gruenert et al., Reference Gruenert, Carr and Morin2007). Therefore, many pollution-monitoring studies adopt the 1.0 mm sieve as the most cost-effective method for balancing logistical constraints while maintaining the capacity to detect ecological changes (Lampadariou et al., Reference Lampadariou, Karakassis and Pearson2005). Nevertheless, sieve efficiency varies with taxonomic group and for individual species in the same taxonomic group (Rodrigues et al., Reference Rodrigues, Meireles, Pereira and Quintino2007); moreover, small-sized individuals/species, which may be important indicators of organic enrichment, are able to pass through the 1.0 mm mesh (Schlacher & Wooldridge, Reference Schlacher and Wooldridge1996a, Reference Schlacher and Wooldridgeb; Teixeira et al., Reference Teixeira, Salas, Pardal and Marques2007; Rodrigues et al., Reference Rodrigues, Meireles, Pereira and Quintino2007), necessitating the use of finer mesh sizes. Thus, the choice of a particular mesh size may affect the reliability of results (Thompson et al., Reference Thompson, Riddle and Stark2003; Lampadariou et al., Reference Lampadariou, Karakassis and Pearson2005).
Most comparative studies on the influence of different mesh sizes on estimates of macrobenthos composition have been carried out with communities of temperate marine and coastal areas, such as the Mediterranean (e.g. Benedetti-Cecchi et al., Reference Benedetti-Cecchi, Airoldi, Abbiati and Cinelli1996; Lampadariou et al., Reference Lampadariou, Karakassis and Pearson2005, Reference Lampadariou, Akoumianaki and Karakassis2008), North America (e.g. Ferraro & Cole, Reference Ferraro and Cole1990; Ferraro et al., Reference Ferraro, Swartz, Cole and Deben1994, Reference Ferraro, Cole and Olsen2006; Gruenert et al., Reference Gruenert, Carr and Morin2007), the Iberian Peninsula (e.g. Rodrigues et al., Reference Rodrigues, Meireles, Pereira and Quintino2007), Australia (James et al., Reference James, Lincoln-Smith and Fairweather1995), South Africa (Schlacher & Wooldridge, Reference Schlacher and Wooldridge1996a, Reference Schlacher and Wooldridgeb) and Antarctica (Thompson et al., Reference Thompson, Riddle and Stark2003), and also in the deep sea (Gage et al., Reference Gage, Hughes and Vecino2002). Information concerning the effect of sieve mesh sizes on quantitative estimates of the composition of tropical macrobenthic communities is still limited, in spite of the large number and diversity of studies on such communities (Tanaka & Leite, Reference Tanaka and Leite1998).
The importance of sediment sampling depth for describing the macrobenthos community is discussed in most literature dealing with the vertical distribution of benthic fauna (Schaffner, Reference Schaffner1990; Weston, Reference Weston1990; Flach & Heip, Reference Flach and Heip1996; Mannino & Montagna, Reference Mannino and Montagna1997; Flach et al., Reference Flach, Heip and Sandee1998; Ingole et al., Reference Ingole, Ansari, Rathod and Rodrigues1999; Wei, Reference Wei2006). All these surveys found some trend for abundance (sampling the upper centimetres of the sediment collected a higher proportion of macrofauna individuals), but not for biomass profiles; in addition, similarly to the information on sieves, the subject has been mainly explored in temperate areas and the deep sea, in contrast to the tropics (e.g. Gutiérrez et al., Reference Gutiérrez, Gallardo, Mayor, Neira, Vásquez, Sellanes, Rivas, Soto, Carrasco and Baltazar2000).
This study investigates the role of sieve mesh size and sediment sampling depth on the description of infaunal community patterns in tropical estuarine environments, in an attempt to discuss standardized sampling procedures for different ecological studies objectives in these ecosystems. Furthermore, we investigate whether some environmental parameters were better associated with the amplitude of changes in infaunal community due to the use of different sieve mesh sizes or sampling depths.
MATERIALS AND METHODS
Description of study areas
The study was undertaken in 12 estuarine areas situated along the 187-km coastline of Pernambuco State in north-eastern Brazil. Large parts of these estuaries are designated as Environmental Protection Areas by State Law No. 9,931, December 1986 (Noronha, Reference Noronha2008).
The Pernambuco coast, which runs from north to south, has a warm humid climate (with annual mean temperatures of 25–27°C), type As′ according to the Köppen climate classification system. Rainfall ranges from 1800 mm to 2364 mm per year, in two annual periods: a rainy season from March through to August, with mean monthly rainfall over 100 mm, and a dry season from September through to February, with mean monthly rainfall less than 100 mm (CPRH, 2006; Monteiro et al., Reference Monteiro, Leça, Koening and Macedo2010).
The main characteristics of the twelve studied estuarine systems and the geographical position of each sampling site are shown in Figure 1 and described in Table 1. These areas were chosen to represent a gradient of pollution (Table 1), ranging from a situation of ‘hypereutrophic and organically polluted’ (Pina Basin Estuarine Complex) to ‘human impact is still minimal’ (Paripe estuary). The ecological quality of these estuaries was previously investigated and results are given in Valença & Santos (Reference Valença and Santos2012).

Fig. 1. Location of studied areas (sites) along Pernambuco coastline (north-east Brazil).
Table 1. Characteristics and summary of the main disturbance sources in the estuarine systems sampled (mainly according to CPRH, 2006).

Sampling design
Samples for geochemical variables and macrofauna were collected at low tide, in the subtidal zone, in October 2007. Preliminary investigations were undertaken in these estuarine areas earlier during 2007, and the sites were chosen based on sediment characteristics, water salinity and level of disturbance (indicated by monitoring reports issued by CPRH, 2006). At each site, five replicate samples for quantitative macrofauna analyses were taken with a cylindrical corer (area: 40.71 cm2, depth: 20 cm), and separated in two layers: top (0–10 cm) and bottom (10–20 cm). All biological samples were preserved in 10% formaldehyde. Subsequently, samples from both layers were washed through 1.0 and 0.5 mm meshes, and the material retained on each sieve was fixed in 4% formaldehyde and stained with rose Bengal. The specimens were sorted and counted with the aid of a stereomicroscope, and were identified to the lowest possible taxonomic level.
Total abundance and biomass per replicate were calculated for the macrofauna retained on the 1.0 mm mesh sieve and the combined sieves (1.0 + 0.5 mm) for total depth (0–20 cm) and in the top layer (0–10 cm) and the combined layers (0–20 cm) for combined sieves (1.0 + 0.5 mm), and the results were compared for the effects of mesh size (1.0 mm × combined sieves for 0–20 cm) and sampling depth (0–10 cm × 0–20 cm for 1.0 + 0.5 mm). For biomass, organisms were preserved in formaldehyde prior to weighing (wet weight); values were averaged for the major taxonomic groups and then estimated as ash-free dry weight (g AFDW) following the conversion factors provided by Ricciardi & Bourget (Reference Ricciardi and Bourget1999). Because of the small size of most individuals, the shells of bivalves were included in the wet weight biomass values. For the polychaete Laeonereis culveri (Webster, 1880), however, the biomass (in g AFDW) was obtained by measuring the diameter at the level of the 5th setiger, in accordance with the growth models established by Florêncio (Reference Florêncio2000).
In parallel to the macrofauna samples, five replicates were obtained for each sediment environmental descriptor, which included granulometry, organic matter, total Nitrogen (cylindrical corer–area: 16.62 cm2, depth: 5 cm). Redox potential (Eh) was measured in the field, in the top (~2 cm) and bottom (~20 cm) layers. Microphytobenthos was also sampled at each site, with a smaller corer (area: 1.13 cm2, depth: 2 cm). In the overlying water, salinity and ammonia-N were each measured once. All methods used to determine these parameters are presented in Table 2.
Table 2. Methods used to measure environmental parameters.

Statistical analysis
The analyses included univariate and multivariate techniques. The distribution and composition of the macrobenthic communities in relation to sieve mesh size and sampling depth were analysed in terms of abundance (individuals/40.71 cm2) and biomass (g AFDW). Nevertheless, density (individuals/m2) was used for graphics to enable comparison with literature. The univariate indices of richness (S) and evenness (J′) were also calculated, using the PRIMER v6.0 software package (Clarke & Gorley, Reference Clarke and Gorley2006).
Analysis of variance (two-way ANOVA with fixed orthogonal factors sites and sampling procedure) was carried out to determine whether richness (S), evenness (J′) and diversity (as measured by Hill's diversity index N 1 or expH′) varied among the 14 sampling sites with the different sieves (1.0 mm × combined sieves), and also among sites with the sampling depths (0–10 cm × 0–20 cm) in the macrobenthic samples. N 1 values were chosen instead of the Shannon diversity index (H′) because the Hill's index seems to allow a better distribution of diversity values than the Shannon index, which ‘is so narrowly constrained in most circumstances [that it] can make interpretation difficult’ (Magurran, Reference Magurran2004). In order to check the assumption of homoscedasticity, Levene tests were applied (Sokal & Rohlf, Reference Sokal and Rohlf1997). The analyses of variance and Levene tests were calculated using the STATISTICA v7.0 program.
For macrofauna comparison and descriptive purposes, the multivariate techniques followed the standard methods according to Clarke & Warwick (Reference Clarke and Warwick1994). In order to reduce the clumping effect of some numerically dominant species, abundances were weighted by means of the dispersion index (Di) of each species per sample (Clarke et al., Reference Clarke, Chapman, Somerfield and Needham2006). Weighted abundance data were log (x + 1) transformed, and resemblances were calculated by the Bray–Curtis similarity measure. Distance-based permutational multivariate analysis of variance (PERMANOVA) was used to test for differences among sites and one of the methodological factors: ‘mesh size’ or ‘sampling depth’. The similarity matrices were plotted in a multidimensional scaling ordination (MDS). When significant differences among sites for the macrobenthos communities in relation to each factor (mesh size/sampling depths) were found, the similarity percentages (two-way SIMPER) (Clarke, Reference Clarke1993) was applied to indicate the taxa that contributed to distinguish each factor within the sites. MDS, PERMANOVA (Anderson, Reference Anderson2001) and SIMPER were conducted with PRIMER v6.0+ statistical package (Clarke & Gorley, Reference Clarke and Gorley2006).
Pearson correlation analyses were used to relate the environmental parameters to the retention efficiency, in terms of abundance and biomass values, of the 1.0 mm mesh compared to the combined meshes. The same analysis was done concerning the retention efficiency of the top layer of sediment (0–10 cm), compared to the whole sediment column (0–20 cm).
Finally, to evaluate the extent to which environmental parameters are better associated with the amplitude of estimated changes in community similarity due to the use of different sieve mesh sizes (1 mm compared to combined sieves) or sampling depths (0–10 cm compared to 0–20 cm), Bray–Curtis dissimilarities were calculated between the macrofaunal compositions obtained using the different sieve mesh sizes from each estuary (e.g. Capibaribe, Pina Basin1, …). The same method was followed to compare sampling depths. Then, Pearson correlation analyses were used to evaluate the association between environmental parameters and the mean dissimilarities caused by the differences in the sampling procedure. Pearson correlation analyses were performed in BIOESTAT v5.0 (Ayres et al., Reference Ayres, Ayres, Ayres and Santos2007). All statistical statements were based on a significance level of α = 5%.
RESULTS
Environmental data and microphytobenthos
The 14 sites showed differences in all the abiotic data (Table 3). Salinity values ranged between eight (in Mamucabas) and 40 psu (in Maracaípe); the majority of the sampling sites were in polyhaline/euhaline zones. Nitrogenous compounds were differently distributed in the water and the sediment: Paratibe and Jaboatão showed high ammonia-N values in their waters, while in the sediment, the Total-N concentrations were highest in the Santa Cruz Channel and Pina Basin2. Although the sand fraction predominated in the sediment composition of all the sites, the fine fraction (% silt–clay) was important in the Timbó estuary. However, the sediment median grain size showed a homogeneous distribution among the sites. The median redox potential was negative at all sites, ranging from –30.9 mV at Itapissuma to –178.1 mV at Pina Basin2. Organic matter content was highest at Pina Basin2, Capibaribe and the Santa Cruz Channel.
Table 3. Mean values (± standard deviation) of environmental data and microphytobenthos for the study areas. Sites: Itapissuma (It); Santa Cruz Channel (CC); Paripe (Pr); Timbó (Tb); Paratibe (Pa); Capibaribe (Cp); Pina Basin1(BP1); Pina Basin2 (BP2); Jaboatão (Jb); Pirapama (Pp); Ipojuca–Merepe (IM); Maracaípe (Ma); Ariquindá (Ar); Mamucabas (Mm).

Sediment chlorophyll-a and phaeopigment concentrations were both highest at Pina Basin2. The sediment chlorophyll-a ranged between 6.06 at Jaboatão and 70.21 µg/cm2 at Pina Basin2 while phaeopigments ranged from 5.86 at Mamucabas to 98.75 µg/cm2 at Pina Basin2 (Table 3).
Macrobenthic distribution and composition
A total of 14,257 individuals comprising 78 taxa, mainly annelids, were identified. Polychaeta was the most abundant (60% in the 1.0 mm and 48% in the combined sieves), followed by Oligochaeta (31% and 35%, respectively) and Nematoda (6% and 15%); the other groups represented less than 3%. Although they are usually numerically dominant in the smaller-sized meiobenthos group, nematodes retained on ‘macrobenthic sieves’ (1.0 + 0.5 mm) were responsible for almost 50% of the Paripe and Santa Cruz Channel community abundances. Nematodes were recorded at Paratibe, Capibaribe, Pina Basin1, Jaboatão, Pirapama and Mamucabas only with the finer-mesh sieve. The estimated relative contribution of taxonomic groups within each site differed with the mesh size, especially at Ipojuca–Merepe and Maracaípe, where the pronounced dominance of Polychaeta observed with the 1.0 mm sieve was superseded by Oligochaeta as estimated with the combined sieves (Figure 2).
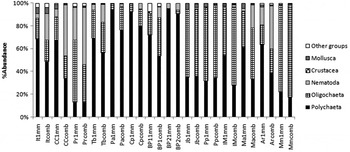
Fig. 2. Distribution of major taxonomic groups (% abundance) of macrobenthic fauna in the study areas, for different sieve mesh sizes. Legend: Sieves with 1.0 mm ( mm) and 0.5 and 1.0 mm combined (comb). Sites: Itapissuma (It); Santa Cruz Channel (CC); Paripe (Pr); Timbó (Tb); Paratibe (Pa); Capibaribe (Cp); Pina Basin1 (BP1); Pina Basin2 (BP2); Jaboatão (Jb); Pirapama (Pp); Ipojuca–Merepe (IM); Maracaípe (Ma); Ariquindá (Ar); Mamucabas (Mm).
Tubificidae species, nematodes, the polychaetes Streblospio sp., Laeonereis culveri, Capitella spp. complex, Mediomastus sp. and unidentified Nereididae made up over 90% of the total abundance, most macrobenthic animals being sampled at only four sites: Paripe (12.85%), Timbó (12.56%), Paratibe (11.73%) and Capibaribe (11.45%). In these areas, densities (for 1 + 0.5 mm sieves) attained values equal or superior to 80,000 ind/m2; by contrast, Ariquindá was the only estuary where fewer than 10,000 ind./m2 were recorded (Figure 3A). In general, densities ranged from three to five times higher for both sieves compared to the 1.0 mm sieve, except for Pina Basin1, where the difference was almost an order of magnitude.

Fig. 3. Density values (± standard deviation), expressed in number of individuals/m2, of macrobenthic fauna in the study areas, for different (A) sieve mesh sizes (for 0–20 cm) and (B) sampling depths (for 1 + 0.5 mm).
Conversely, most areas showed little evidence of differences in the estimated vertical distribution of densities (Figure 3B) and individual species, except at Mamucabas, where tubificid species were well represented in both the 0–10 cm and 10–20 cm strata.
Mollusca comprised more than 73% of the overall biomass, especially due to the high contribution of the bivalves Macoma sp., Lucina sp. and Anomalocardia brasiliana. The values of total biomass were also concentrated at four sites: Jaboatão (25.67%), Ipojuca–Merepe (23.17%), Timbó (21.22%) and Pirapama (8.92%). Total biomass values ranged from 0.17 g (1.0 mm) to 0.30 g (combined sieves) for Pina Basin2, to 21.24 g (1.0 mm) to 21.47 g (combined sieves) for Jaboatão (Figure 4A). Although the pronounced dominance of mollusc biomass was evident at half of the sites, at others: Capibaribe, Pina Basin1, Pina Basin2, Itapissuma, Mamucabas and Ariquindá, polychaete biomass values were higher and little affected by the mesh size.

Fig. 4. Biomass values (±standard deviation), expressed in ash-free dry weight (gAFDW), of macrobenthic fauna in the study areas, for different (A) sieve mesh sizes (for 0–20 cm) and (B) sampling depths (for 1 + 0.5 mm).
At some sites, the proportion of the biomass was similar in the upper and lower sediment layers, but at Timbó, Paratibe, Jaboatão, Pirapama and Ariquindá the biomass values increased in different proportions with the depth (Figure 4B).
Macrobenthic community pattern: sieve mesh and sampling depth
The analysis of the overall retention efficiency showed that the differences between the 1.0 mm and combined sieves were less pronounced for biomass, but they were very important for abundance. The 1.0 mm sieve retained only 27% of the total individuals, but at the same time was responsible for 77% of the total biomass. Among the sites, the site-to-site percentage variation in the macrobenthic communities' biomass was higher than for the abundance: retention on the 1.0 mm mesh varied from 10.69% at Pina Basin1 to 39.98% at Paratibe for abundance, and from 33.35% at Paripe to 99.72% at Ariquindá for biomass (Figure 5).

Fig. 5. Percentages of abundance and biomass values (±SD), of the faunal groups retained on a 1.0 mm sieve in the study areas (for 0–20 cm) .
Retention efficiency in terms of numbers of individuals on the 1.0 mm mesh was high for crustaceans (>87%) and molluscs (>60%). Efficiency was relatively low for polychaetes (35%), oligochaetes (24.75%), nemertines (41.38%), sipunculans (45.71%) and phoronids (16.67%) (Figure 6).

Fig. 6. Abundance values (number of individuals) of major taxonomic groups retained on different sieves (1.0 mm and 1.0 + 0.5 mm meshes) in the study areas.
The retention efficiency of individuals on the 1.0-mm mesh was not correlated to any of the environmental factors, only biomass data showed significant correlations with the following environmental descriptors: percentage of coarse sand (r = −0.694; P = 0.005), percentage of organic matter (r = −0.545; P = 0.043), total-N (r = −0.598; P = 0.02) and chlorophyll-a pigments (r = −0.679; P = 0.015).
Regarding sampling depth, the top layer (0–10 cm) contained almost all the individuals (94%), but contributed only 64% of the overall biomass. Among sites, except for Mamucabas, this layer comprised more than 92% of the abundance in each area, whereas biomass values in 0–10 cm ranged from 6.04% at Timbó to 97.69% at Maracaípe (Figure 7).

Fig. 7. Percentages of abundance and biomass values (± standard deviation), for the fauna in the upper layer (0–10 cm) fauna in the study areas (for 1 + 0.5 mm).
The bottom layer (10–20 cm) proved to contain significant proportions of the biomass of molluscs (79.67%), sipunculans (86.76%) and phoronids (65.91%). Conversely, crustaceans, chironomids, small flatworms and the majority of nematodes (97%) were found in the top layer (Figure 8).

Fig. 8. Biomass values (ash-free dry weight) of the major taxonomic groups considering sampling depth (0–10 cm and 0–20 cm) in the study areas.
The percentage of abundance in the top layer (0–10 cm) was correlated only with salinity (r = −0.551; P = 0.041), while the percentage of biomass (0–10 cm) showed a significant correlation with chlorophyll-a pigments (r = −0.672; P = 0.016).
In terms of univariate measures (Table 4), significant effects for both mesh sizes and sites were revealed by the two-way ANOVA for Hill's index N 1 (F1,112 = 5.17; P = 0.02 and F13,112 = 7.51; P < 0.001), richness S (F1,112 = 52.88; P < 0.001 and F13,112 = 9.21; P < 0.001) and equitability J′ (F1,112 = 4.06; P = 0.04 and F13,112 = 5.16; P < 0.001).
Table 4. Hill's diversity index (N 1), richness (S) and evenness (J′) averages for each site in relation to sieves.

In concordance with the N 1 diversity and equitability (J′), the macrobenthic community structure was significantly different between the sieve meshes (PERMANOVA, pseudo-F = 7.1951; P = 0.0001) and among the sites (PERMANOVA, pseudo-F = 9.0463; P = 0.0001), well represented in the MDS (Figure 9A). However, no significant interaction was observed between sites and sieve meshes (PERMANOVA, pseudo-F = 0.9255; P = 0.9135).

Fig. 9. Multidimensional scaling (MDS) plot of sampling similarities at each site in relation to (A) the sieves and (B) the sampling depth. Legend: Sieves 1.0 mm (1 mm) and 0.5 and 1.0 mm combined (comb). Sampling depth 0–10 cm (10 cm) and 0–20 cm (20 cm). Sites: Itapissuma (It); Santa Cruz Channel (CC); Paripe (Pr); Timbó (Tb); Paratibe (Pa); Capibaribe (Cp); Pina Basin1 (BP1); Pina Basin2 (BP2); Jaboatão (Jb); Pirapama (Pp); Ipojuca–Merepe (IM); Maracaípe (Ma); Ariquindá (Ar); Mamucabas (Mm).
Conversely, within the sites, the use of the 0.5 mm mesh did not significantly alter the estimates for community structure at most sites, excluding Paratibe (PERMANOVA, t = 1.9932; P = 0.0246) and the Santa Cruz Channel (PERMANOVA, t = 2.2362; P = 0.0072). The SIMPER analysis (Table 5) demonstrated that the differences between sieve mesh sizes at Paratibe were due to the polychaetes Laeonereis culveri, Capitella spp. complex and Neanthes sp.; tubificid oligochaetes; nematodes; and the crustacean Uca sp. In the Santa Cruz Channel, besides nematodes, the main taxa that contributed to distinguish the fauna retained on the two meshes were the polychaetes Exogone sp., Podarke sp. and Sigambra sp.; the oligochaete Tectidrilus sp.; and the bivalve Corbula sp.
Table 5. Similarity percentage analysis with taxa contribution to dissimilarity within the sites considering the use of 1.0 mm (1 mm) and combined sieves (comb). Mean abundance values in log (x + 1).

No significant differences were observed for any univariate indices regarding the sampling depth (Hill's index N 1: F1,112 = 0.068; P > 0.05; richness S: F1,112 = 1.003; P > 0.05; equitability J′: F1,112 = 0.013; P > 0.05 ). The same pattern was observed for the community as a whole, according to PERMANOVA (pseudo-F = 0.1796; P = 0.9997) and MDS results (Figure 9B). No significant interaction was found between sites and sampling depth (PERMANOVA, pseudo-F = 7.5499; P = 1.0000). The analysis also indicated that the sites became more distinct for the factor ‘sampling depth’ (pseudo-F = 12.997; P = 0.0001) when compared to ‘sieve meshes' with respect to abundance.
The factor ‘sieve meshes’ was the only one that showed significant differences for the macrobenthic community. Average dissimilarities between the macrofauna communities estimated by the 1.0 mm and combined meshes at each site varied from 28.76% at Paratibe to 58.97% at Pina Basin2, with an overall dissimilarity of 39.25%. Pearson's correlation between these average dissimilarities from each site and the subset of environmental variables strongly selected the total-N (r = 0.860; P < 0.0001), organic matter (r = 0.801; P < 0.001) and microphytobenthic pigments (r = 0.749; P = 0.005 for chlorophyll-a and r = 0.795; P = 0.002 for phaeopigments) as the best variables associated to the changes in fauna related to the sampling procedure (sieve meshes).
DISCUSSION
In this study, different procedures for describing spatial structure patterns of tropical estuarine macrobenthos were tested, and revealed that biological material processed with different mesh sizes and sampling depths can influence estimates of parameters from these communities. Indeed, the use of a 1.0 mm or 0.5 mm mesh had a more significant effect on the univariate parameters abundance and biomass than on community structure. As estimated by both meshes, macrobenthic communities from the study areas were numerically dominated by annelids, particularly polychaetes, which is commonly the most abundant and important taxon in tropical and subtropical estuarine macrofauna (Maurer & Vargas, Reference Maurer and Vargas1984; Alongi, Reference Alongi1990; Frouin, Reference Frouin2000; Dittmann, Reference Dittmann2001; Paiva, Reference Paiva2001; Ingole et al., Reference Ingole, Rodrigues and Ansari2002; Jayaraj et al., Reference Jayaraj, Sheeba, Jacob, Revichandran, Arun, Praseeda, Nisha and Rasheed2008). The presence of the polychaetes Streblospio sp., Laeonereis culveri, Capitella spp. complex, and Mediomastus sp. together with tubificid oligochaetes and nematodes, which dominated the sampling sites examined here, is also typical of estuarine environments elsewhere in Brazil (e.g. Bemvenuti et al., Reference Bemvenuti, Rosa-Filho and Elliott2003; Nalesso et al., Reference Nalesso, Joyeux, Quintana, Torezani and Otegui2005; Pagliosa & Barbosa, Reference Pagliosa and Barbosa2006; Rosa-Filho et al., Reference Rosa-Filho, Busman, Viana, Gregório and Oliveira2006; Barros et al., Reference Barros, Hatje, Figueiredo, Magalhães, Dóre and Emídio2008).
Conversely, the biomass data indicated that Mollusca dominated the communities. The biomass values derived from the two sieve fractions within sites were similar, but the occurrence of deep-burrowing adults of Macoma sp., Lucina sp. and Anomalocardia brasiliana in the 10–20 cm stratum made the differences between the sampling depths in some areas quite important. Even though these species together represented less than 1% of the total abundance they accounted for over 60% of the total biomass, which indicated that the macrofauna was clearly dominated in terms of numbers by small specimens.
Considering the efficiencies of the different mesh sizes for macrobenthos sampling, the extra information added by sieving with 0.5 mm mesh size had a strong effect on the average abundance. The relative retention efficiencies of different mesh sizes reported in the literature will diverge depending on the geographical area, habitat and benthic assemblage sampled (Table 6). In this study the variations of retention efficiency considering also biomass were very large among the sites, suggesting that inter-site comparisons of biomass may be affected by the choice of mesh size. Since most sites showed evidence of disturbance (see Table 1) and several sediment parameters (especially organic matter, total-N and microphytobenthos pigments) that are frequently associated with organic enrichment conditions were significantly correlated with biomass results, it is expected that in more polluted areas the retention efficiency will be lower, and it would be essential to use the material retained on the 0.5 mm mesh.
Table 6. Retention efficiency (%) recorded by macrobenthic community abundance studies using 1.0 and 1.0 + 0.5 mm (combined) sieves.

Comparative surveys of retention efficiency indicate that crustaceans, polychaetes and bivalves are usually selected to decreasing degrees by the same mesh size (Bachelet, Reference Bachelet1990; Tanaka & Leite, Reference Tanaka and Leite1998; Lampadariou et al., Reference Lampadariou, Karakassis and Pearson2005). In this study, while the few crustaceans present (<10 individuals) were observed on the 1.0 mm-mesh sieve, the bivalves (92% of the molluscs) were more efficiently retained on this mesh size than were the polychaetes, i.e. following a different order of selection (crustaceans > bivalves > polychaetes). These results are in accordance with those reported by Rodrigues et al. (Reference Rodrigues, Meireles, Pereira and Quintino2007) for the Tagus Estuary, Portugal, where a high abundance of Streblospio shrubsolii was responsible for the lower retention rate of polychaetes on the 1.0 mm mesh. In the present study, the same occurred due to the species Streblospio sp., Capitella spp. complex, Mediomastus sp. and juveniles of Laeonereis culveri.
Some studies have shown that, for comparison of communities by means of univariate indices, differences in species richness and diversity can be found between samples processed with 1.0 mm and 0.5 mm meshes (Bachelet, Reference Bachelet1990; Tanaka & Leite, Reference Tanaka and Leite1998). Bachelet (Reference Bachelet1990) found a significant increase in species richness with a change from 1.0 to 0.5 mm mesh in seasonal samples in the Gironde Estuary; however, the values of the Shannon index (H′) were similar between the two mesh sizes. In the tropical estuaries studied here, 66% of the species richness and 90% of the diversity (N 1) were recorded with the 1.0 mm mesh, indicating a similar trend. In spite of these and similar findings, some authors have suggested that meshes of different sizes would sample similarly in terms of species composition (James et al., Reference James, Lincoln-Smith and Fairweather1995; Schlacher & Wooldridge, Reference Schlacher and Wooldridge1996b; Gage et al., Reference Gage, Hughes and Vecino2002; Rodrigues et al., Reference Rodrigues, Meireles, Pereira and Quintino2007). In some cases, given that relatively higher costs are associated with the use of finer screens, sampling protocols employing 1.0 mm sieves can be more cost-effective for characterizing the macrobenthic community (Ferraro et al., Reference Ferraro, Swartz, Cole and Deben1994, Reference Ferraro, Cole and Olsen2006).
On the other hand, the macrobenthic communities of the Pernambuco estuaries were mainly composed of small-sized species that are indicators of pollution; therefore it is possible that information necessary to detect impacts in pollution assessments would be lost if the 1.0 mm rather than the 0.5 mm mesh were used.
Concerning the sampling depth, the importance of the upper layers for estimating the taxa composition and abundance structure of benthic communities is widely reported (Weston, Reference Weston1990; Flach & Heip, Reference Flach and Heip1996; Dauwe et al., Reference Dauwe, Herman and Heip1998; Flach et al., Reference Flach, Heip and Sandee1998; Ingole et al., Reference Ingole, Ansari, Rathod and Rodrigues1999; Wei, Reference Wei2006). In this study, over 90% of the macrofauna specimens and taxa were present in the top layer (0–10 cm). Flach & Heip (Reference Flach and Heip1996) and Flach et al. (Reference Flach, Heip and Sandee1998) showed that in deep-sea areas of the north-east Atlantic, macrobenthic fauna was concentrated in the first centimetre (40–80% and 25–59%, respectively). Gutiérrez et al. (Reference Gutiérrez, Gallardo, Mayor, Neira, Vásquez, Sellanes, Rivas, Soto, Carrasco and Baltazar2000) observed on the continental shelf of central Chile that 40–80% of the macrofauna was in the 0–2 cm layer, with 20–40% in the 2–5 cm layer. In estuaries, the proportion can be even higher: Mannino & Montagna (Reference Mannino and Montagna1997) found that in the Nueces Estuary, USA, more than 70% of the total abundance was in the 0–5 cm layer; while Rodrigues et al. (Reference Rodrigues, Meireles, Pereira and Quintino2007) recorded 87% in the corresponding layer in the Tagus Estuary.
A different pattern appeared in the vertical profile for total biomass, with inter-site comparisons significantly correlated with environmental descriptor (chlorophyll-a) associated with eutrophication condition and variations in distribution within the sediment strata among areas. At five sites, the highest biomass values (63–94%) were found below the first 10 cm, as a result of large deep-dwelling bivalves, sipunculans and phoronids. In these tropical estuaries, sampling only the upper centimetres of sediment would have missed many large deep-burrowing species that are few in number but account for most of the total biomass. Weston (Reference Weston1990) demonstrated the same dilemma: 90% of the macrofauna individuals were found in the 0–5 cm stratum, but 40–90% of the biomass was situated in the 5–20 cm stratum.
The significant correlations found for retention efficiencies (sieves) and vertical distribution (sampling depth) using the biomass data indicate the importance of using adequate procedures to estimate macrobenthic biomass. This is particularly important in pollution-monitoring programmes, given that most methods for detecting anthropogenic stress include this parameter among the primary community structural variables (Elliott & Quintino, Reference Elliott and Quintino2007). Furthermore, Warwick (Reference Warwick1986) has suggested that the relationship between species-abundance and species-biomass curves can reveal pollution-induced conditions, known as Abundance-Biomass-Comparisons (or ABC curves). According to Dauer (Reference Dauer1993), healthy benthic communities can be characterized by high biomass, dominated by long-lived, often deep-dwelling species (e.g. bivalve molluscs, maldanid polychaetes, etc.), and this might indicate a past history of good water/sediment quality. The importance of this relationship led Lampadariou et al. (Reference Lampadariou, Akoumianaki and Karakassis2008) to propose the size fractionation of macrofaunal biomass (Biomass Fractionation Index–BFI) as a monitoring tool to discriminate between impacted and unimpacted sites.
Macrofauna descriptors (diversity and community structure) identified for the fauna from the total core depth (0–20 cm) were similar to those obtained considering only the results for the top layer (ANOVA, PERMANOVA and MDS). These results support the importance of the top layer for estimating the taxa composition and abundance structure of the benthic community; however, for studies based on biomass, the inclusion of the bottom layer seems to be essential (Rodrigues et al., Reference Rodrigues, Meireles, Pereira and Quintino2007).
This study of the soft-bottom tropical macrobenthic communities showed that even if sampling with a 1.0 mm mesh appears to be adequate (based on cost–benefit calculations) to describe community structure, in these estuaries, where the macrofauna is mostly composed of small specimens, the use of the 0.5 mm sieve will provide a more accurate estimate. In addition, for taxa composition and abundance, the top layer is clearly the most important; whereas for biomass and pollution-impact studies, the bottom layer should also be considered.
CONCLUSION
The investigator must decide what and how many response measurements should be taken in order to achieve a particular objective. No single protocol will perform optimally for all geographical areas, habitat types and communities, and therefore considerable attention should be devoted to methodological planning, including the criteria for choosing a particular mesh size or sampling depth. Although the present study was based on a single sampling period and was spatially limited, the results showed the influence of both mesh size and sampling depth on characterizing the tropical estuarine macrofauna—the data gathered in this study suggest that it is desirable to use finer sieves (<0.5 mm); and depending on the type of information needed (mainly biomass or studies focusing pollution), the entire 20 cm sediment depth should be sampled.
ACKNOWLEDGEMENTS
The authors gratefully acknowledge the LABDIN (Laboratório de Dinâmica de Populações) team, for helping in different stages of this work. Special thanks go to Priscila Murolo and Danielle Menor, who could not resist getting muddy and participated in most of the field trips. We thank Dr Manuel de Jesus Flores Montes for analysing ammonia-N water samples, Drs Mônica Lúcia Botter-Carvalho and Mônica Ferreira Costa for their valuable comments on the manuscript and Janet W. Reid for English language revision. The authors acknowledge the contributions and helpful suggestions from the anonymous referees. The Conselho Nacional de Desenvolvimento Científico e Tecnológico (CNPq) of the Brazilian Government is acknowledged for a MSc scholarship to A.P.M.C. Valença and a research fellowship to P.J.P. Santos (305609/2004-1).


