


1. Introduction
Global warming has become one of the most urgent environmental problems of our time. It is widely acknowledged that anthropogenic emissions of greenhouse gases (GHGs), in particular CO2, are the cause of a rising GHG concentration in the atmosphere leading to a changed climate on Earth. As regards global CO2 emissions, empirical research shows that up to 90 per cent of CO2 emissions comes from fossil energy related activities (production and use of fossil energy for electricity, for example). Input-output tables clearly demonstrate that the production and use of fossil energy is highly correlated with CO2 emissions (see Mittnik et al., Reference Mittnik, Kato, Samaan, Semmler, Semmler and Bernard2013).
In recent economic research on policies against global warming, a large number of studies are concerned with mitigation policies, such as cap & trade and carbon tax, to combat global warming.Footnote 1 Yet, another type of study elaborates on new technologies as a solution to global warming. In a number of recent research papersFootnote 2 the effort focuses on the transition from fossil energy to renewable energy to reduce CO2 emissions. The use of fossil energy in a market economy creates significant externalities and contributes to CO2 emissions. Green energy that has no such externalities is seen as backstop technology, the implementation of which can significantly contribute to the reduction of the causes of global warming. Hence, substituting polluting fossil energy by non-polluting energy could be of great help in alleviating the problem of global warming.
Major substitutes for fossil energy are renewable energy sources such as solar, wind, water, geothermal and biomass energy or atomic energy. However, the Fukushima catastrophe in Japan has illustrated that the use of atomic energy may be associated with extremely high risks. Therefore, developing a more extensive renewable energy sector that substantially reduces CO2 emissions seems to be the more promising route to reducing global warming and its negative effect on the welfare of individuals in the long-run. Moreover, renewable energy yields more energy independence and one can move away not only from hazardous nuclear power, but also from the limited non-renewable fossil energy, such as coal and crude oil, the prices of which appear to be rising in the long run (see Greiner et al., Reference Greiner, Semmler and Mette2012b). Thus, the major issue is the question of how such a transition will work for a social optimum solution and whether a laissez-faire economy can have sufficient incentives to bring about this transition to renewable energy sources. Another issue in this context is whether the non-renewable energy, with the externality of CO2 emissions, will be depleted completely or left partly unexploited and to what extent less CO2 emissions will occur through a transition to renewable energy.
Concerning the appropriateness of renewable energy, Jacobson and Delucchi (Reference Jacobson and Delucchi2011a; Reference Jacobson and Delucchi2011b) extensively discuss that source of energy in two contributions. They highlight the energy system characteristics of renewable energy sources, current and future energy demand and the availability of resources as well as area and material requirements. In addition, they address the variability, the economics and policy of renewable energy. They estimate that a renewable energy infrastructure would considerably reduce world power demand while only modestly requiring more of the world's land. As a result, they suggest producing all new energy with renewables by 2030 and replacing the pre-existing energy by 2050. Barriers to that are primarily of a social and political nature but not technological or economic, since the energy cost in a world with renewable energy should be similar to that of today.
In the theoretical economics literature, one can also find contributions that study the use of different sources of energy to produce the final output. For example, Hoel and Kverndokk (Reference Hoel and Kverndokk1996) present a resource model where the use of the resource generates negative externalities. There exists a non-polluting perfect substitute for the polluting resource, with the non-polluting backstop being available at a constant unit cost. Hoel and Kverndokk show, among other things, that it is optimal to extract the polluting resource even when its price is equal to the price of the non-polluting resource. In a more recent contribution, van der Ploeg and Withagen (Reference van der Ploeg and Withagen2011) adopt the model by Hoel and Kverndokk and change two assumptions: they do not allow for a decay of GHGs and they assume that capital must be built up to produce the final output. However, capital is not a perfect substitute for the energy input but, rather, there is a backstop that can perfectly substitute for the non-renewable energy source. Energy is produced using a polluting non-renewable resource and a non-polluting renewable energy source that is available at a constant unit cost, as in Hoel and Kverndokk. They show that it is optimal to use only the polluting resource initially and, later on, only renewables, when the initial stock of the polluting resource is small. The lower the cost of the renewable, the more of the polluting energy source is left in situ and the sooner the renewable only phase starts. When the initial stock of the polluting resource is large, it is optimal to first use the polluting resource, then the non-polluting and, finally, the polluting one again. In a different approach, van der Ploeg and Withagen (Reference van der Ploeg and Withagen2012) analyze the optimal use of two non-renewable resources with one implying emissions of a great many GHGs (coal) and one source going along with relatively little (oil). It is demonstrated that the sup-optimal market solution uses too much of the more polluting energy source unless the government corrects this market failure.
The models by Hoel and Kverndokk (Reference Hoel and Kverndokk1996) and by van der Ploeg and Withagen (Reference van der Ploeg and Withagen2011; Reference van der Ploeg and Withagen2012) have the same structure: there is a polluting resource that can be perfectly substituted by a non-polluting one at a given cost, with both variables being control variables. Thus, their models belong to the general class of models analyzed by Krautkraemer (Reference Krautkraemer1998).
In a different class of models, there is a man-made capital stock that can serve as a perfect substitute for the non-renewable resource, as first presented in the model by Krautkraemer (Reference Krautkraemer1985). Krautkraemer analyzes a growth model where a polluting resource is used to produce output that can be either consumed or invested. The capital stock can be either an imperfect or a perfect substitute for the polluting resource, the stock of which has an amenity value. Given these assumptions, Krautkraemer demonstrates that the resource will not necessarily be completely exhausted if the initial stock of the man-made capital and the elasticity of substitution between the resource and capital are sufficiently large.
In this contribution, we present a model that combines the two previous approaches. Thus, we assume that energy can be produced either from a non-renewable energy source, such as fossil fuels, or from a renewable source that requires investment in a capital stock, as in Krautkraemer (Reference Krautkraemer1985). While the renewable energy does not emit GHGs and, thus, does not contribute to global warming, burning fossil fuels to generate energy raises the GHG concentration on Earth, thus generating damages to welfare, as in the contributions by Hoel and Kverndokk (Reference Hoel and Kverndokk1996) and by van der Ploeg and Withagen (Reference van der Ploeg and Withagen2011, Reference van der Ploeg and Withagen2012).
Similarly to Greiner et al. (Reference Greiner, Gruene, Semmler, Crespo Cuaresma, Palokangas and Tarasyev2010), we discuss two versions of the model, one representing the laissez-faire market solution where the external effect of burning fossil fuels is not taken into account by agents, and the other version representing the social planner's solution that allows us to choose an optimal allocation of capital to renewable energy so as to counteract the damages created by the high CO2-emitting fossil energy sector. We are doing this in a model with preferences, since the long-horizon welfare effects both from reducing the damages from CO2 emissions as well as from technological improvements in energy production can be suitably modeled from this perspective. We also evaluate the effects resulting from differences in private and social rates of time preference as originally assumed in Arrow and Kurz (Reference Arrow and Kurz1970) and analyzed by Heinzel and Winkler (Reference Heinzel and Winkler2011) in the context of an environmental model.
As undertaken in Heinzel and Winkler (Reference Heinzel and Winkler2011), and van der Ploeg and Withagen (Reference van der Ploeg and Withagen2011; Reference van der Ploeg and Withagen2012), in our paper here, in contrast to the paper by Greiner et al. (Reference Greiner, Gruene, Semmler, Crespo Cuaresma, Palokangas and Tarasyev2010), we also let damages, arising from cumulative CO2 emission, affect households’ welfare. We present a model version where consumption multiplicatively interacts with damages in the household's welfare function, but also a model variant with additive arguments in the welfare function. We will use nonlinear model predictive control (NMPC) to solve the model numerically.Footnote 3 It lets us explore if and when it is optimal to phase in a renewable energy source and when it is optimal to phase out the non-renewable resource. We can also explore to what extent it will be optimal to leave a fraction of the non-renewable resource unexploited and how initial values of the non-renewable resource and of the capital stock to produce renewable energy affect the dynamics.
We intend to address the following research questions. First, we want to characterize the optimal fiscal policy, in particular the optimal rate of subsidy for investment in renewable energy. We are also interested in the question of whether differences in the rates of time preference of the social planner and of the representative agent in the laissez-faire economy change the outcome, or not. Second, we intend to characterize the time paths of the non-renewable resource and of the renewable resource and how those affect cumulative CO2 emissions. Third, we are interested in whether the non-renewable resource is completely used up or whether it is feasible to have something left in situ.
We can show that the inital stock of the non-renewable resource plays an important role as concerns the time path of both the non-renewable and of the renewable energy source, in accordance with results of earlier studies. A new result we can derive is that the productivity of the capital stock in the production process for the renewable energy is of fundamental importance as regards the evolution of the different types of energy, as well as with respect to the question as to whether some of the non-renewable resource is left in situ or whether it is completely used up. Another new result is that the answer to the question of whether subsidies should be paid to replicate the social optimum, or whether the optimal subsidies are zero, crucially depends on whether the social planner has the same time preference as the representative agent or whether time preferences differ.
The remainder of the paper is organized as follows. Section 2 presents the structure of our model. Section 3 explores the properties of the socially optimal solutions and section 4 explores the laissez-faire economy and how the socially optimal solution can be reached through appropriate fiscal policies. The numerical results of our study, using NMPC, are summarized in section 5. Section 6, finally, concludes the paper. In the Appendix we give some proofs of the propositions and present the numerical procedures.
2. The economic model
The total flow of energy output E arises as the sum of energy produced from a non-polluting energy sector, creating E n , and from a polluting energy sector, producing the flow of energy, E p . The underlying production functions for the production of the two types of energy are:
 $$E_{p}(t) = A_{p}\, u(t) \eqno \lpar 1\rpar$$
 $$E_{n}(t) = A_{n}\, K(t) \eqno \lpar 2\rpar$$
with u(t) the amount of fossil fuels used at tine t to generate energy and K a stock of capital that produces energy using renewable sources of energy such as wind or solar energy and A i , i=p, n, denote efficiency indices. Total energy E consists of the sum of these two types of energy. Note that production of the final good Y(t) uses energy and is a concave function of energy input,Footnote 4
 $$Y = A\, E^{\alpha} = A\,(A_{n}K + A_{p}u)^{\alpha} \eqno \lpar 3\rpar$$
with 0<α≤1, A>0. Note that energy is a homogeneous good so that modeling the two types as perfect substitutes can be justified.
The stock of non-renewable energy source evolves over time according to the following law of motion:
 $$\dot{R} = -u,R(0) = R_{0}. \eqno \lpar 4\rpar$$
As far as the accumulation of total capital is concerned, with a constant decay rate of δ, we have the following:
 $$\dot{K} + \delta K = Y - C - a \cdot u,\quad K(0) = K_0 \eqno \lpar 5\rpar$$
with C being consumption and a>0 gives cost of extracting one unit of the non-renewable resource.
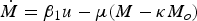
The use of the non-renewable resource leads to an increase of GHGs, M, above its pre-industrial level M o . The GHG concentration evolves according to
 $$\dot{M} = \beta_{1}u - \mu(M - \kappa M_o), \quad M(0) = M_0 \geq M_o \eqno \lpar 6\rpar$$
where μ∈(0, 1) is the inverse of the atmospheric lifetime of GHGs and β1∈(0,1) gives that part of GHGs that is not taken up by oceans. The parameter κ>1 captures the fact that GHG stabilization is possible only at values exceeding the pre-industrial level. The goal is to achieve stabilization at a doubling of GHGs which would imply κ=2 in our setting.
We should like to point out that u gives that part of emissions that can be controlled by the planner. Consequently, even for u=0 the GHG concentration can rise on the transition path, i.e., for M<κ M o , since other sources emit CO2 that are beyond the influence of the planner. Concretely, one may think of u as emissions generated by fossil power plants to generate electrical power whereas emissions caused by traffic also contribute to global warming.
Our economy is populated by a continuum of homogeneous agents of measure one with each single agent having measure zero so that we can analyze a representative individual. As to the utility function U we use a generalization of that presented in Byrne (Reference Byrne1997) and adopt the following function that is also resorted to in Smulders and Gradus (Reference Smulders and Gradus1996) and in Greiner (Reference Greiner2011), for example:
 $$U = {C^{1 - \sigma} (M - M_o)^{ -\xi (1 - \sigma)} - 1 \over 1 - \sigma}. \eqno \lpar 7\rpar$$
The parameter 1/σ>0 denotes the intertemporal elasticity of substitution of consumption between two points in time and ξ>0 gives the (dis)utility of the GHG concentration exceeding the pre-industrial level. For σ=1 the utility function is logarithmic in consumption and pollution. Later, in section 6.2, we will use simplified preferences which are related to σ=1 in preferences (7).
In order to see the effect of GHGs on the marginal utility of consumption we compute the cross-derivative of the utility function which is given by,
 $${\partial^2 U \over \partial C\partial M} = - \xi(1 - \sigma)C^{- \sigma}(M - M_o)^{-\xi(1 - \sigma) - 1}\gt (\lt) 0 \leftrightarrow 1/\sigma \lt(\gt) 1. \eqno \lpar 8\rpar$$
Equation (7) shows that the marginal utility of consumption declines when GHGs rise if the intertemporal elasticity of substitution is larger than one. If the intertemporal elasticity of substitution is smaller than one, the negative effect of an additional unit of GHGs is smaller than the higher consumption. The latter means that a rise in consumption reduces the negative effect of pollution at the margin.
Equation (8) suggests that consumption and a clean environment are complementary for 1/σ>1 because, in this case, marginal utility of consumption rises with a decline in the level of GHGs. This means that the marginal utility of consumption is higher, the cleaner the environment is. For 1/σ<1, consumption and GHGs can be considered as substitutes because the marginal (dis)utility of additional pollution declines with a rising level of consumption.
In the next section we first derive the solution of the social planner's problem.
3. The socially optimal solution
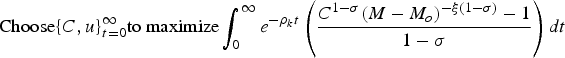
We can look for the solution of the allocation problem faced by a benevolent social planner taking into consideration the accumulation of GHGs, equation (6). Thus, we have for the planning version the following optimization problem:
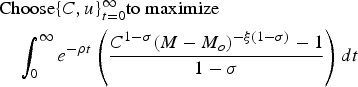 $$\eqalign{&\hbox{Choose}\{ C,u\}_{t = 0}^{\infty} \hbox{to maximize}\cr &\quad \int_{0}^{\infty }e^{-\rho t} \left({C^{1 - \sigma} (M - M_o)^{-\xi (1-\sigma )} - 1 \over 1 - \sigma} \right) dt}$$
 $$\dot{K} = Y - C - \delta K - a\cdot u \eqno \lpar 9\rpar$$
 $$\dot{R} = - u \eqno \lpar 10\rpar$$
 $$\dot{M} = \beta_1 u - \mu (M - \kappa M_o) \eqno \lpar 11\rpar$$
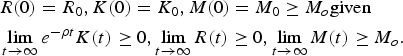 $$\eqalign{&R(0) = R_{0},K(0) = K_{0},M(0) = M_{0}\geq M_{o} \hbox{given}\cr &\lim_{t\rightarrow \infty }e^{-\rho t} K(t)\geq 0,\lim_{t\rightarrow \infty} R(t)\geq 0,\lim_{t\rightarrow \infty }M(t)\geq M_o.}$$
3.1. Optimality conditions
To find the optimal solution we set up the current-value Hamiltonian function that is written as
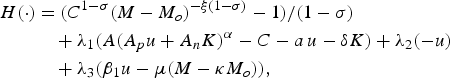 $$\eqalign{H(\cdot) &=(C^{1 - \sigma }(M - M_{o})^{-\xi (1 - \sigma)} - 1)/(1 - \sigma) \cr &\quad + \lambda_1 (A(A_{p}u + A_{n}K)^{\alpha }-C-a\,u-\delta K) +\lambda _{2}(-u) \cr &\quad + \lambda _{3}(\beta _{1}u-\mu (M-\kappa M_{o})),} \eqno \lpar 12\rpar$$
with λ i , i=1, 2, 3, the shadow prices of capital, fossil energy and GHG concentration, respectively. Necessary optimality conditions are:
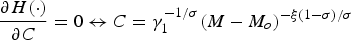
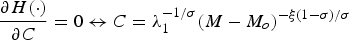 $${\partial H(\cdot ) \over \partial C} = 0 \leftrightarrow C = \lambda_{1}^{-1/\sigma }(M - M_{o})^{-\xi (1 - \sigma )/\sigma} \eqno \lpar 13\rpar$$
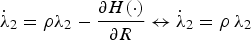
 $${\partial H(\cdot) \over \partial u} = 0 \leftrightarrow u = \left({\lambda _{1} \over \lambda_{2} - \lambda_{3} \beta_{1} + a \lambda _{1}} \right)^{1/(1-\alpha )} (A_{p}^{\alpha}A\alpha)^{1/(1 - \alpha )} - {A_{n}K \over A_{p}} \eqno \lpar 14\rpar$$
 $$\dot{\lambda}_{1} = \rho \lambda _{1} - {\partial H(\cdot ) \over \partial K} \leftrightarrow \dot{\lambda}_{1} = (\rho +\delta )\lambda_{1} -\lambda_{1}\alpha AA_{n}(A_{n}K + A_{p}u)^{\alpha -1} \eqno \lpar 15\rpar$$
 $$\dot{\lambda}_{2} = \rho \lambda_{2} - {\partial H(\cdot) \over \partial R} \leftrightarrow \dot{\lambda}_{2} = \rho \,\lambda_{2} \eqno \lpar 16\rpar$$
 $$\dot{\lambda}_{3}=\rho \lambda _{3} - {\partial H(\cdot) \over \partial M} \leftrightarrow \dot{\lambda}_{3} = (\rho + \mu )\lambda_{3} + \xi (M - M_{o})^{-\xi (1 - \sigma ) - 1} C^{1-\sigma }. \eqno \lpar 17\rpar$$
Equation (16) shows that the shadow price of the non-renewable energy source exponentially changes at the rate ρ, i.e., λ2(t)=λ2(0)·e ρ t , giving the Hotelling rule. The shadow price of capital, λ1, is positive while that of GHGs, λ3, is negative since GHGs above the pre-industrial level, to which we limit our considerations, lead to welfare losses.
The extraction rate u will be positive only if the marginal product of u in energy production exceeds its costs, which consist of the unit extraction cost, a, plus its price relative to the shadow price of capital, (λ2−λ3β1)/λ1. It should be noted that the price of the resource consists of the shadow price of the resource, λ2, plus the effective price of GHGs, −λ3β1, where effective means that the shadow price of GHGs must be multiplied by β1, since only 0<β1<1 of GHG emissions enter the atmosphere while the rest is absorbed by oceans.
It must also be pointed out that the marginal product of u, of the non-renewable resource used for producing energy, is bounded from above. The marginal product of u is given by ∂Y/∂ u=AαA
p
(A
n
K)α−1<∞, for u=0 and K>0. That demonstrates that a high capital stock to produce renewable energy, K, and a low value of A
p
, reflecting the efficiency of the non-renewable in energy production, tends to reduce the extraction rate. In the extreme case of A
p
=0, the marginal product of u vanishes and there are only costs left resulting from the use of the non-renewable resource. Thus, for a sufficiently low value of A
p
the resource will not be extracted and the representative agent will only use renewable energy. In that case, the shadow price of the resource will be negative. That holds because the steady-state shadow priceFootnote
5
is
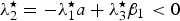 $\lambda_{2}^{\star} = - \lambda_{1}^{\star}a + \lambda_{3}^{\star}\beta_{1}\lt 0$
, for A
p
=0, and because of equation (16).
$\lambda_{2}^{\star} = - \lambda_{1}^{\star}a + \lambda_{3}^{\star}\beta_{1}\lt 0$
, for A
p
=0, and because of equation (16).
On the other hand, if the cost of investment in the renewable energy capital stock is large there may be a time period when investment equals zero and only the polluting resource is used to generate energy. This will occur when the cost of resource extraction is low relative to investment in renewable energy which can be the case for small extraction costs and for small marginal damages of GHGs while productivity of the non-polluting energy capital is low.
From equation (13) the growth rate of consumption can be derived as,
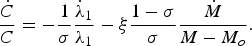 $${\dot{C} \over C} = - {1 \over \sigma} {\dot{\lambda}_1 \over \lambda_1} - \xi {1 -\sigma \over \sigma} {\dot{M} \over M - M_o}. \eqno \lpar 18\rpar$$
That equation demonstrates that on the transition path the growth rate of consumption is higher if consumption and damages from global warming are substitutes compared to the case when consumption and damages are complements, for a given growth rate of the shadow price of capital. This holds because the planner will put a higher weight on raising consumption when GHGs increase since the negative impact of a higher GHG concentration on welfare can be alleviated by higher consumption. If consumption and damages from global warming are complementary the reverse holds. Then, the marginal increase in welfare due to higher consumption is the higher the lower the GHG concentration and the planner will put less weight on raising consumption in such a world.
It should also be pointed out that the current-value Hamiltonian is strictly concave in its control variables but not necessarily in the control and state variables jointly and the maximized Hamiltonian is also not necessarily concave in the state variables. Therefore, the necessary conditions are not sufficient for a maximum and they only describe a candidate for the optimum.
3.2 The steady state
To get insight into the long-run behavior of our model we study its asymptotic behavior where the time derivatives of economic variables equal zero. From equation (4) we know that
 $u^{\star} = 0$
must hold in the long run because the resource is finite. A zero long run extraction rate implies that GHGs are obtained as
$u^{\star} = 0$
must hold in the long run because the resource is finite. A zero long run extraction rate implies that GHGs are obtained as
 $M^{\star}=\kappa M_{o}$
. From
$M^{\star}=\kappa M_{o}$
. From
 $\dot{C}=0$
we obtain
$\dot{C}=0$
we obtain
 $$K^{\star} = (A/(\rho + \delta))^{1/(1 - \alpha)} \alpha^{1/(1-\alpha)}A_{n}^{\alpha/(1-\alpha)}$$
where we used
 $u^{\star} = 0$
. Finally, setting
$u^{\star} = 0$
. Finally, setting
 $\dot{K}=0$
leads to
$\dot{K}=0$
leads to
 $$C^{\star} = (\rho + \delta(1 - \alpha))A_{n}^{\alpha/(1 - \alpha)}(A/(\rho + \delta))^{1/(1 - \alpha)}\alpha^{\alpha/(1-\alpha)}.$$
The steady-state shadow prices are obtained as follows. Setting
 $\dot{\lambda}_{3} = 0$
and using
$\dot{\lambda}_{3} = 0$
and using
 $M^{\star} = \kappa M_{o}$
gives for the shadow price of GHGs
$M^{\star} = \kappa M_{o}$
gives for the shadow price of GHGs
 $\lambda_{3}^{\star} = (-\xi)(C^{\star})^{1 - \sigma}(M_{o}(\kappa - 1))^{-\xi(1 - \sigma) - 1}/(\rho + \mu)$
and from equation (13) we obtain for the shadow price of capital
$\lambda_{3}^{\star} = (-\xi)(C^{\star})^{1 - \sigma}(M_{o}(\kappa - 1))^{-\xi(1 - \sigma) - 1}/(\rho + \mu)$
and from equation (13) we obtain for the shadow price of capital
 $\lambda_{1}^{\star}=(C^{\star})^{-\sigma}(M_{o}(\kappa-1))^{-\xi(1-\sigma)}$
. The steady-state shadow price of the non-renewable resource is obtained as
$\lambda_{1}^{\star}=(C^{\star})^{-\sigma}(M_{o}(\kappa-1))^{-\xi(1-\sigma)}$
. The steady-state shadow price of the non-renewable resource is obtained as
 $\lambda_{2}^{\star}=\lambda_{1}^{\star}(A\alpha A_{p}(A_{n}K^{\star})^{\alpha-1}-a)+\lambda_{3}^{\star}\beta_{1}$
from
$\lambda_{2}^{\star}=\lambda_{1}^{\star}(A\alpha A_{p}(A_{n}K^{\star})^{\alpha-1}-a)+\lambda_{3}^{\star}\beta_{1}$
from
 $u^{\star} = 0$
.
$u^{\star} = 0$
.
The shadow price of GHGs is negative for κ>1, which implies that the steady-state GHG concentration exceeds the pre-industrial level to which we will confine our analysis since this is the more relevant case. In that case the shadow price of the capital stock used to produce non-polluting renewable energy is positive at the steady state. Finally, the steady-state shadow price of the exhaustible resource,
 $\lambda_{2}^{\star}$
, is positive if the marginal product of the resource at the steady state exceeds unit extraction costs, a, plus the effective shadow price of GHGs relative to the shadow price of capital,
$\lambda_{2}^{\star}$
, is positive if the marginal product of the resource at the steady state exceeds unit extraction costs, a, plus the effective shadow price of GHGs relative to the shadow price of capital,
 $-\lambda_{3}^{\star}\beta_{1}/\lambda_{1}$
. However, the steady-state shadow price of the non-renewable resource may also become negative if the marginal product of the non-renewable energy is small relative to the marginal product of the renewable energy.
$-\lambda_{3}^{\star}\beta_{1}/\lambda_{1}$
. However, the steady-state shadow price of the non-renewable resource may also become negative if the marginal product of the non-renewable energy is small relative to the marginal product of the renewable energy.
4. The laissez-faire solution and optimal fiscal policy
Above we have studied the optimization problem that chooses consumption and the optimal rate of extraction for the non-renewable resource, considering damages resulting from turning this resource into energy that increases the GHG concentration. In the laissez-faire economy the agent will not internalize the carbon damage inflicted on the environment, since this is an externality, unless the government sets correct incentives to do so.
4.1 Laissez-faire solution
Therefore, finding a decentralized allocation path in our economy amounts to solving the following problem:
 $$\hbox{Choose} \{C,u\} _{t = 0}^{\infty} \hbox{to maximize} \int_{0}^{\infty }e^{-\rho_{k}t} \left({C^{1-\sigma }(M-M_{o})^{-\xi (1-\sigma )}-1 \over 1 - \sigma} \right) dt$$
 $$\dot{K} = Y - C - \delta K - au - \tau u - \Gamma +\theta \dot{K} \eqno \lpar 19\rpar$$
 $$\dot{R} = -u \eqno \lpar 20\rpar$$
 $$\eqalign{&K(0)=K_0, M(0)=M_0\, \hbox{given} \cr & \lim_{t \to \infty} e^{-\rho kt} K(t)\ge 0, \lim_{t \to \infty} M(t)\ge M_0.}$$
Before we analyze the outcome of the market solution, we want to note some differences to the optimization problem of the social planner. First, the rate of time preference of the agent in the laissez-faire economy, denoted by ρ
k
, need not coincide with that of the social planner. Second, we assume that a government levies a tax τ>0 per unit of extraction of the resource as well as a lump-sum tax Γ that may be positive or negative, the latter implying that the government pays transfers to the household. In addition, the government may subsidize investment in capital to foster the formation of renewable energy production by paying θ∈(0, 1) units of output per gross investment
 $\dot{K}$
.
$\dot{K}$
.
Again, we form the current-value Hamiltonian which now is
 $$\eqalign{H(\cdot ) &=({C^{1-\sigma }(M-M_{o})^{-\xi (1-\sigma )}-1})/({1-\sigma })\cr &\quad + \gamma _{1}(A(A_{p}u+A_{n}K)^{\alpha }-C-(a+\tau )u-\delta K-\Gamma)/(1-\theta )+\gamma _{2}(-u),} \eqno \lpar 21\rpar$$
with γ i , i=1, 2, the shadow prices of capital and of the exhaustible resource, respectively. Necessary optimality conditions are given by the following equations:
 $${\partial H(\cdot ) \over \partial C} = 0 \leftrightarrow C = \gamma_{1}^{-1/\sigma}(M - M_{o})^{-\xi (1 - \sigma )/\sigma} \eqno \lpar 22\rpar$$
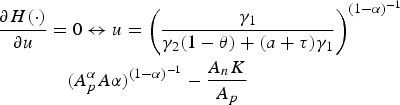 $$\eqalign{{\partial H(\cdot ) \over \partial u} &= 0 \leftrightarrow u = \left({\gamma_1 \over \gamma_2 (1 - \theta) + (a + \tau) \gamma_1} \right) ^{(1 - \alpha )^{ - 1}} \cr &\quad (A_{p}^{\alpha} A \alpha)^{(1 - \alpha )^{-1}}-{A_n K \over A_p}} \eqno \lpar 23\rpar$$
 $$\dot{\gamma}_{1} = \rho _{k}\gamma _{1} - {\partial H(\cdot ) \over \partial K} \leftrightarrow \dot{\gamma}_{1} = (\rho _{k} + \delta )\gamma _{1} -\gamma_{1}\alpha AA_{n}(A_{n}K+A_{p}u)^{\alpha -1}/(1-\theta )\eqno \lpar 24\rpar$$
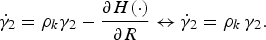 $$\dot{\gamma}_{2} = \rho _{k}\gamma _{2} - {\partial H(\cdot ) \over \partial R} \leftrightarrow \dot{\gamma}_{2} = \rho_{k}\,\gamma_{2}. \eqno \lpar 25\rpar$$
Since the evolution of GHGs is taken as given, the necessary conditions are also sufficient for an optimum in the market economy if the transversality condition
 $\lim_{t\rightarrow \infty }e^{-\rho _{k}t}(K(t)+M(t))=0$
is fulfilled.
$\lim_{t\rightarrow \infty }e^{-\rho _{k}t}(K(t)+M(t))=0$
is fulfilled.
In the long run, the social optimum and the market economy do not differ if the rates of time preference of the social planner and of the agent in the market economy are the same, which is formally stated in proposition 1.
Proposition 1.
For identical rates of time preference, the steady state of the social optimum coincides with that of the market economy without government intervention. If the time preference in the social optimum exceeds that of the market economy, capital, output and consumption in the social optimum are higher than in the market economy. [end(prop)]
Proof: See Appendix.
Proposition 1 makes clear that in the long run both versions of the model yield the same outcome, unless the rates of time preference differ. It is true that the representative agent in the market economy only takes into account the private costs of the resource extraction and neglects the social costs resulting from the emission of GHGs since his influence is negligible. However, since he knows that the resource is finite he invests in the renewable energy capital stock. Further, since resource extraction equals zero in the long run the difference between the social optimum and the market economy vanishes, provided the rate of time preference in the market economy is the same as in the social optimum. If the rate of time preference in the social optimum is smaller than in the competitive market economy it will yield higher steady-state capital and, thus, output as well as higher consumption and, therefore, also higher welfare.
But it is obvious that the competitive market economy and the social optimum do not coincide along the transition path unless the government corrects market failures. For example, comparing (14) with (23) suggests that the extraction of the polluting resource is expected to be higher in the laissez-faire economy without government intervention than in the social optimum solution. That holds because in the social optimum the price of emitting GHGs, given by −λ3β1, is taken into account which is not the case in the market economy. In the latter, the cost of emitting GHGs is neglected because this is an externality that is not considered by the households, unless the government intervenes and levies a tax on the use of non-renewable energy that generates the GHG emissions. In the next subsection we study how the fiscal parameters must be set such that the market economy will replicate the social optimum solution.
4.2. Optimal fiscal policy
To derive optimal tax rates and the optimal investment subsidy we will first assume that the rate of time preference of the social planner coincides with that of the representative agent in the market economy. Proposition 2 demonstrates how fiscal policy parameters must be set in this case.
Proposition 2.
Assume that ρ=ρ k holds. Then, the market economy replicates the social optimum if and only if θ=θ o , τ=τ o and Γ=Γ o holds, with
 $$\theta^{o} = 0, \tau^{o} = -\lambda_3 \beta_1 /\lambda_1, \Gamma^{o} = \lambda_3 \beta_1 u/\lambda_1 {\rm for}\,{\rm all} t \in[0,\infty)$$
Proof: See Appendix.
This proposition shows that the optimal subsidy for investment in non-renewable energy equals zero. The reason is that the marginal product of capital to produce non-polluting energy is the same in both versions of the model so that the shadow price of capital in the social optimum follows the same path as in the market economy, provided the evolution of capital and extraction of the non-renewable resource are the same. The latter is achieved by a tax on unit extraction u where the optimal tax equals the effective price of GHGs, −λ3β1, divided by the shadow price of capital, λ1.Footnote 6 This shows that in the case where resource extraction is taxed an additional subsidy for renewable energy would lead to over-investment in the renewable energy capital stock such that the stock of capital would grow too fast compared to the social optimum. Finally, lump-sum taxes Γ are negative, implying that the tax revenue from taxing resource extraction must be redistributed in a lump-sum way to the private sector. This guarantees that the evolution of the capital stock in both versions is identical and also assures that the budget of the government is balanced.
It should also be noted that the optimal tax rate is independent of the shadow price of the resource. It only depends on the effective shadow price of GHG concentration and on the shadow price of the non-polluting energy source, i.e., on the shadow price of the capital stock. The higher the marginal damage of an additional unit of GHGs in the atmosphere and the lower the shadow price of the non-polluting energy technology, the higher the optimal tax rate on the extraction of the polluting resource will be.
If the rate of time preference of the social planner exceeds that of agents in the market economy, the optimal fiscal parameters take different values. Proposition 3 gives the result for this case.
Proposition 3.
Assume that Δρ:=ρ k −ρ>0 holds. Then, the market economy replicates the social optimum if and only if θ=θ o , τ=τ o and Γ=Γ o holds, with
 $$\matrix{\theta^{o} = {\Delta \rho \over \Delta \rho + Y_K},\quad \tau^{o} = \left({\lambda_{2} \over \lambda_1} \right) \left({\Delta\rho \over \Delta \rho + Y_K} \right) - {\lambda_3 \beta_1 \over \lambda_1},\cr \Gamma^{o} = \theta^{o}\dot{K}-\tau^{o}u\,{\rm for}\,{\rm all} t\in[0,\infty),}$$
where Y K =∂Y/∂K.
Proof: See Appendix.
Proposition 3 demonstrates that a subsidy for renewable energy is necessary to replicate the social optimum if the time preference of the social planner is larger than that of the agents in the market economy. This holds because even if the evolution of capital and the extraction rate were the same, the shadow prices in the two versions would be different due to the difference in the rate of time preference. Hence, the subsidy is to compensate for the difference in the rates of time preference where the optimal subsidy is given by the difference in the time preference divided by the marginal product of capital plus that difference. Then, the shadow price of capital in the market economy evolves at the same pace as in the social optimum if the extraction rate and the stock of capital are also the same in the two versions.
To equate extraction rates one can again use the optimality condition for that variable in the two versions of the model and set the tax rate on extraction such that equality of u is obtained. This is achieved when the tax rate equals the investment subsidy multiplied by the shadow price of the resource in the social optimum, θ
o
λ2, plus the effective price of GHGs, −λ3β1, divided by the shadow price of capital, λ1. The lump-sum payment now is a lump-sum tax and is obtained by equating the evolution of capital in the two versions of the model. Doing so shows that the tax revenue consisting of the lump-sum tax, Γ, plus the revenue from taxing resource extraction, τ u, just equals the subsidies,
 $\theta\dot{K}$
, which gives the budget constraint of the government.
$\theta\dot{K}$
, which gives the budget constraint of the government.
In case the rates of time preference differ, the optimal tax rate also depends on the shadow price of the resource in the social optimum, besides the shadow price of GHGs and the shadow price of capital. In general, the optimal tax rate on extraction will be the higher, the higher the shadow price of the resource, the lower the marginal product of the renewable energy technology and the higher the difference in the rate of time preference of the social planner and of the agents in the market economy.
5. Numerical analysis
For the numerical solution of the optimal control problem we employ NMPC,Footnote 7 where we assume a simplified welfare function of equation (7) presented in section 2. We use:
 $$U = \ln (C) - \gamma (M - M_o)^2 \eqno \lpar 26\rpar$$
instead of (7). Setting σ=1 in (7) gives U=ln (C)−ξln (M−M o ) which would imply that damages are a convex function of GHGs exceeding the pre-industrial level M o . However, since a concave shape is more realistic we replace the damages −ξln (M−M o ) by γ (M−M o )2. Another reason for the use of a more simplified welfare function in the NMPC procedure is that in NMPC a high dimensional differential equation system has to be solved which is quite time consuming with the MATLAB optimization solver. The NMPC works much faster for additively separable preferences (26) than for the multiplicative form of equation (7). The qualitative results are expected to be similar.
In the numerical analysis below we set μ=0.1 and β1=0.5 as plausible values and κ=2, M(0)=M o with M o =1. Other reasonable parameters are: ρ=0.03 and δ=0.05, α=0.5, A=1, A n =1, a=0.1, ξ=0.5. We take a rather large A p , namely A p =1, 000, which gives rise to reasonable steady-state results. From an economic point of view this makes sense since A n is the parameter for a stock and A p a parameter for a flow. Also, as the computations of the steady-state values have shown, only a very large A p allows for a steady state where the shadow price of the non-renewable energy source is non-negative.
In figure 1, the upper U-shaped graph, first quickly rising but then going to zero, and eventually rising to a higher level, is the capital stock, used for the production of renewable energy. Since there is sufficient non-renewable energy in deposits, it is optimal to let the capital stock go to zero and then, when the non-renewable energy tends to be exhausted, it is optimal to build up the capital stock to a high level. A high capital stock to produce renewable energy is required, because apparently the created externalities through the use of non-renewable energy sources have become too high and too costly.

Figure 1. NMPC results with R(0)=1, K(0)=1, M(0)=1, N=8
The negative externalities and damaging effects are indicated in figure 1 through the middle graph, representing M(t), the cumulative CO2 emission which of course converges to 2, its steady-state value. The lower graph, which is monotonically decreasing, represents the fate of the non-renewable resource R t .
The next example is for a different initial condition for R. We take R(0)=0.5, but we keep the same parameters as before. In figure 2, the capital stock first also declines but then rises to a high level, once non-renewable energy is exhausted and the cumulative externalities have been piled up. However, since initial non-renewable resources are low, it is not optimal to reduce capital to zero for some time and rely on non-renewable energy production alone. The results also show that with a low initial non-renewable resource the resource is depleted. In both cases, for R(0)=1 and R(0)=0.5, figures 1 and 2, the cumulative emission is slowly built up.

Figure 2. NMPC results for R(0)=0.5, K(0)=1, M(0)=1, N=8
This, however, is different for a larger amount of initially available non-renewable energy. This case is demonstrated in figure 3 which shows the solution paths for the initial condition R(0)=5. In the case of figure 3, if there is an initially large deposit of non-renewable energy – R(0)=5 – but the initial capital stock to produce renewable energy is relatively low, the high deposits of fossil energy will be quickly extracted,Footnote 8 but the resource will not be depleted for a long time period. Here non-renewable energy, emitting CO2, will increase the totally emitted CO2 faster and the non-renewable energy will be extracted for a prolonged time period. As can be observed – compare figures 2 and 3 – at time period 25, the cumulative emission of CO2 is higher in figure 3 now with a larger initial deposit of the fossil resource, R(0)=5.

Figure 3. NMPC results for R(0)=5, K(0)=1, M(0)=1, N=8
In figure 3 the cumulative emission of CO2 goes up to roughly 2.6, stays there for a long time period and then slowly decreases toward its steady-state value of 2. Thus, there will be a greater concentration of CO2 piled up which also rises faster and stays higher for a larger R(0); see the middle graph of figure 3, as compared to figures 1 and 2. One can observe, if fossil energy is relatively abundant as compared to capital stock producing renewable energy, it is apparently optimal to delay the build-up of capital for a long time period. Note that the capital stock starts building up only after period 40.Footnote 9
The next example is for different initial conditions, R(0)=0.5, R(0)=2.5, but in both cases we assume a high initial capital stock K(0)=3. Yet, in both cases we also assume M(0)=1.
In figure 4, for the cases of a low R(0)=0.5 and high R(0)=2.5, we assume the same initial capital stock K(0)=3, and the same M(0)=1. As we can observe, the different initial conditions for R, the non-renewable energy source, give different results over time. First, the high R(0)=2.5 significantly delays the optimal building up of the capital stock – it starts being built up in period 15 instead of 5, as for the low initial R. So it is for a prolonged period optimal to have a very low capital stock, and thus little renewable energy built up. Second, however, the cumulative CO2 emission that goes with it, is significantly higher on the transition path, and welfare presumable significantly lower, as compared to the case of a high capital stock and a low initial non-renewable energy source R.Footnote 10

Figure 4. NMPC results for R(0)=0.5, and R(0)=2.5, and in both cases K(0)=3, M(0)=1, N=8
Next, we will use a larger deposit of the non-renewable resource, R(0)=5, but also a greater time horizon in our numerical procedure by employing N=20. As numerical studies with the NMPC method have shown, with a larger N this might move the solution path closer to the steady-state value of the model.Footnote 11
As can be observed from the solution paths R(0)=5, K(0)=8, M(0)=1, N=20, not only the non-renewable energy resource and the cumulative CO2 emission go toward their steady state but also the capital stock (figure 5). Note also that the cumulative CO2 emission rises first above 2, its steady-state value, but then declines. The rise above its steady state comes from the fact that the initial non-renewable energy resource is large and extracted slowly. The capital stock is declining first, and then later rising, as in figures 3 and 4. Thus, it is optimal to use a low capital stock for a prolonged period of time but much non-renewable energy, before renewable energy is phased in.

Figure 5. NMPC results for R(0)=5, K(0)=8, M(0)=1, N=20
For a final exercise we use a very small efficiency parameter for the renewable energy. We now take A p =1. In the case of figure 6, with R(0)=2.5 and R(0)=0.5, and in both cases K(0)=3, M(0)=1, but A p =1, we can observe that the non-renewable energy use steadily declines but for both initial conditions for R non-renewable energy is left unextracted (see the trajectories going below 0.5 but above 0). Here, the cumulative CO2 emission is lower than in the cases of figures 1–3, where all non-renewable resource is completely depleted. Thus, if there is a high capital stock to accelerate the use of renewable energy or a low stock of deposits of non-renewables, the more non-renewables are left unextracted and the cumulative CO2 emission is lower the lower the initial R(0) is. But it must also be pointed out that the resource declines faster because its shadow price is negative and, thus, lower than in the simulations underlying figures 1–3.

Figure 6. NMPC results for R(0)=2.5, and R(0)=0.5, and in both cases K(0)=3, M(0)=1, A p =1, N=8
This suggests that one might want to constrain oneself to the lower initial R(0)=0.5 which generates less cumulative externalities.Footnote 12 Hence, if we have less initial deposits in non-renewable energy (R(0)=0.5 as compared to R(0)=2.5 in figure 6), the existence of a higher capital stock, and thus the production of renewable energy, will phase in renewable energy faster and this could reduce the use of non-renewable energy.
6. Conclusions
In this paper we have studied the issue of global warming and the transition from non-renewable to renewable energy in a canonical growth model with negative externalities that affect household’ s preferences. We have two decision variables, consumption and extraction rate of the non-renewable resource, and three state variables – capital stock, non-renewable resource and cumulative CO2 emission, the latter affecting the welfare of households.
We have analyzed how renewable energy sources can be phased in, in a model for a socially optimal solution and in a laissez-faire economy. In the long run the two versions are equivalent, unless the rates of time preference differ, but transitional dynamics are not identical. We derived the optimal tax rate (and lump-sum subsidy) for the case of a laissez-faire economy such that the laissez-faire economy coincides with the social optimum. We have also seen that optimal subsidies are zero if the social discount rate coincides with that of agents in the laissez-faire economy. Only if the discount rate of the social planner's problem exceeds that of agents in the laissez-faire economy, should a subsidy for renewable energy be paid besides levying a tax on non-renewables.
In the numerical part of the paper, we have studied the dynamics of the phasing out of the fossil energy source and the phasing in of renewable energy, both depending on the initial level of R(0) and K(0). We have explored how the extraction rates u and the capital stock to produce renewable energy K evolve over time, and whether the initial levels and paths of the non-renewable energy and the capital stock are relevant for the level of the cumulative CO2 emission, and thus global warming.
If the available non-renewable energy resource is initially high, the extraction rate of the non-renewable resource is first high and then continuously declining, and it appears to be optimal to have for a long time period a low or even zero capital stock to produce the renewable energy. Yet this keeps the CO2 emission high, ending up with a high level of CO2 concentration sooner. With a high initial non-renewable resource stock we could even observe an overshooting of cumulated CO2 emission over its long-run steady-state value. In this case, extraction is so large that it transitorily exceeds its long-run value before it begins to decline and converge to its steady-state.
Further, for low efficiency in non-renewable energy production we have seen that it can be optimal to leave some of the non-renewable energy resource unextracted. In this case it is optimal to switch completely to renewable energy production before the resource is used up. We also saw that the resource left in situ is the larger the higher is the initial value of the stock of the non-renewable resource.
In future research our model could be extended in several directions. For example, it seems reasonable to allow for the increasing costs involved in discovering new deposits that increase the known deposits, as studied in Greiner et al. (Reference Greiner, Semmler and Mette2012b). In our cases studied here the extraction cost is linear and we have not introduced nonlinear discovery cost. Further research along those lines as well as on the difference between the social and private rate of discounting is needed.
Appendix
Proof of proposition 1
Setting ρ
k
=ρ and θ=τ=Γ=0 immediately shows that for u=0 the steady-state values of the social optimum and of the competitive market economy are the same. Further, it is easily seen that
 $K^{\star}$
as well as
$K^{\star}$
as well as
 $C^{\star}$
negatively depend on ρ. □
$C^{\star}$
negatively depend on ρ. □
Proof of proposition 2
To prove proposition 2 we first set ρ
k
=ρ and note that
 $\dot{\lambda}_{1} = \dot{\gamma}_1$
immediately shows that θ=0 must hold. Further, we know that the optimal extraction rate in the social optimum must be equal to that in the competitive market economy. Setting (14)=(23) and using θ=0 gives τ=−λ3 β1/λ1. These two conditions guarantee that the extraction of the non-renewable resource, consumption and the GHG concentration in the social optimum and in the competitive market economy coincide. Finally, Γ has to be set such that the evolution of the capital stock in the two versions is the same. Setting A(A
p
u+A
n
K)α−C−au−δ K=A(A
p
u+A
n
K)α−C−(a−λ3β1/λ1)u−δ K−Γ and solving with respect to Γ gives the result in the proposition. □
$\dot{\lambda}_{1} = \dot{\gamma}_1$
immediately shows that θ=0 must hold. Further, we know that the optimal extraction rate in the social optimum must be equal to that in the competitive market economy. Setting (14)=(23) and using θ=0 gives τ=−λ3 β1/λ1. These two conditions guarantee that the extraction of the non-renewable resource, consumption and the GHG concentration in the social optimum and in the competitive market economy coincide. Finally, Γ has to be set such that the evolution of the capital stock in the two versions is the same. Setting A(A
p
u+A
n
K)α−C−au−δ K=A(A
p
u+A
n
K)α−C−(a−λ3β1/λ1)u−δ K−Γ and solving with respect to Γ gives the result in the proposition. □
Proof of proposition 3
Now, we have ρ
k
>ρ. Again, we know that
 $\dot{\lambda}_1 = \dot{\gamma}_1$
must hold. Setting (15)=(24) and solving the resulting equation with respect to θ yields θ=Δρ/(Δρ+Y
K
). Next, equating optimal extraction rates and solving for τ leads to τ=θ(λ2/λ1)−λ3β1/λ1, with θ=Δρ/(Δρ+Y
K
). Finally, Γ is found by setting equal investment in the social optimum to investment in the competitive market economy: A(A
p
u+A
n
K)α−C−auδ K=A(A
p
u+A
n
K)α−C−(a+τ)u−δ K−Γ)/(1−θ). Solving for Γ gives the result. □
$\dot{\lambda}_1 = \dot{\gamma}_1$
must hold. Setting (15)=(24) and solving the resulting equation with respect to θ yields θ=Δρ/(Δρ+Y
K
). Next, equating optimal extraction rates and solving for τ leads to τ=θ(λ2/λ1)−λ3β1/λ1, with θ=Δρ/(Δρ+Y
K
). Finally, Γ is found by setting equal investment in the social optimum to investment in the competitive market economy: A(A
p
u+A
n
K)α−C−auδ K=A(A
p
u+A
n
K)α−C−(a+τ)u−δ K−Γ)/(1−θ). Solving for Γ gives the result. □
The NMPC algorithm
In order to describe the method, let us abstractly write the optimal control problem as
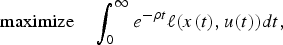 $${\rm maximize}\quad\int_{0}^{\infty}e^{-\rho t}\ell(x(t),u(t))dt,$$
where x(t) satisfies
 $\dot{x}(t)=f(x(t),u(t))$
, x(0)=x
0 and the maximization takes place over a set of admissible control functions. By discretizing this problem in time, we obtain an approximate discrete time problem of the form
$\dot{x}(t)=f(x(t),u(t))$
, x(0)=x
0 and the maximization takes place over a set of admissible control functions. By discretizing this problem in time, we obtain an approximate discrete time problem of the form
 $${\rm maximize}\quad\sum_{i=0}^{\infty}\beta^{i}\ell(x_{i},u_{i}),\eqno \lpar 27\rpar$$
where the maximization is now performed over a sequence u
i
of control values and the sequence x
i
satisfies
 $x_{i+1}=\Phi(h,x_{i},u_{i})$
. Here h>0 is the discretization time step,
$x_{i+1}=\Phi(h,x_{i},u_{i})$
. Here h>0 is the discretization time step,
 $\beta=e^{-\rho h}$
and Φ is a numerical scheme approximating the solution of
$\beta=e^{-\rho h}$
and Φ is a numerical scheme approximating the solution of
 $\dot{x}(t)=f(x(t),u(t))$
on the time interval [ih, (i+1)h]. For details and references in which the error of this discretization is analyzed we refer to section 2.2 of Gruene and Semmler (Reference Heinzel and Winkler2004).
$\dot{x}(t)=f(x(t),u(t))$
on the time interval [ih, (i+1)h]. For details and references in which the error of this discretization is analyzed we refer to section 2.2 of Gruene and Semmler (Reference Heinzel and Winkler2004).
The idea of NMPC now lies in replacing the maximization of the infinite horizon functional (27) by the iterative maximization of finite horizon functionals
 $$\hbox{maximize}\quad\sum_{k=0}^{N}\beta^{i}\ell(x_{k,i},u_{k,i}),\eqno \lpar 28\rpar$$
for a truncated finite horizon
 $N\in{\open N}$
with
$N\in{\open N}$
with
 $x_{k+1,i}=\Phi(h,x_{k,i},u_{k,i})$
and the index i indicates the number of the iteration, cf. the algorithm below. Note that neither β nor ℓ nor Φ changes when passing from (27) to (28) only the optimization horizon is truncated.
$x_{k+1,i}=\Phi(h,x_{k,i},u_{k,i})$
and the index i indicates the number of the iteration, cf. the algorithm below. Note that neither β nor ℓ nor Φ changes when passing from (27) to (28) only the optimization horizon is truncated.
Problems of type (28) can be efficiently solved numerically by converting them into a static nonlinear program and solving them by efficient NLP solvers (see Gruene and Pannek, Reference Gruene and Semmler2012). In our simulations, we have used a discounted variant of the MATLAB routine nmpc.m available from http://www.nmpc-book.com, which uses MATLAB's fmincon NLP solver in order to solve the resulting static optimization problem.
Given an initial value x 0, an approximate solution of (27) can now be obtained by iteratively solving (28) as follows:
-
(1) for i=1, 2, 3, …
-
(2) solve (28) with initial value x 0, i :=x i and denote the resulting optimal control sequence by
 $u_{k,i}^{*}$
-
(3) set
$u_{i}:=u_{0,i}^{*}$
and
$x_{i+1}:=\Phi(h,x_{i},u_{i})$
-
(4) end of for-loop


This algorithm yields an infinite trajectory x
i
, i=1, 2, 3, … whose control sequence u
i
consists of all the first elements
 $u_{0,i}^{*}$
of the optimal control sequences for the finite horizon subproblems (28).
$u_{0,i}^{*}$
of the optimal control sequences for the finite horizon subproblems (28).
Under appropriate assumptions on the problem, it can be shown that the solution (x
i
, u
i
) (which depends on the choice of N in (28)) converges to the optimal solution of (27) as
 $N\rightarrow \infty $
. The main requirement in these assumptions is the existence of an optimal equilibrium for the infinite horizon problem (27). If this equilibrium is known it can be used as an additional constraint in (28) in order to improve the convergence properties see Angeli et al. (Reference Angeli, Amrit and Rawlings2012). However, recent results have shown that without a priori knowledge of this equilibrium this convergence can also be ensured (see Gruene, Reference Gruene2013), and this is the approach we use in the computations in this paper.
$N\rightarrow \infty $
. The main requirement in these assumptions is the existence of an optimal equilibrium for the infinite horizon problem (27). If this equilibrium is known it can be used as an additional constraint in (28) in order to improve the convergence properties see Angeli et al. (Reference Angeli, Amrit and Rawlings2012). However, recent results have shown that without a priori knowledge of this equilibrium this convergence can also be ensured (see Gruene, Reference Gruene2013), and this is the approach we use in the computations in this paper.


