


Introduction
The idea that the evolution of life is punctuated by major extinction events with intervals of many millions of years is well established (Raup & Sepkoski Reference Raup and Sepkoski1982, Reference Raup and Sepkoski1984; Bambach Reference Bambach2006). Familiar episodes include the Cretaceous–Paleogene transition (65.5 mya), which saw the final demise of the non-avian dinosaurs and many shallow sea life-forms, and the end-Permian (251 mya) when an estimated 56% of marine genera became extinct (Bambach Reference Bambach2006). Determination of the mass extinction signal is part of a wider search for periodicity in causal processes and correlated geological events (Rampino & Stothers Reference Rampino and Stothers1984a, Reference Rampino and Stothersb; Raup & Sepkoski Reference Raup and Sepkoski1984; Haq et al. Reference Haq, Hardenbol and Vail1987; Rampino & Stothers Reference Rampino and Stothers1988; Veizer et al. Reference Veizer, Goddaris and Francois2000; Isley & Abbott Reference Isley and Abbott2002; Shaviv Reference Shaviv2003; Prokoph et al. Reference Prokoph, Ernst and Buchan2004; Rohde & Muller Reference Rohde and Muller2005). These previous studies have identified a variety of periods including 26–35 Myr (mantle plumes/flood basalt events/large igneous provinces (LIPs) and marine genera), 60–62 Myr (marine genera, sea level and LIPs), 135–145 Myr (marine genera, oxygen isotope record as indicator of palaeoclimate, ice age epochs) and even longer periods in different studies of LIPs and mantle plumes (160–170 Myr, 330 Myr, 550–730 Myr and 820 Myr). The drivers of these signals are widely debated and include processes intrinsic to Earth and the Solar System (Kemp et al. Reference Kemp, Coe, Cohen and Schwark2005), perturbations of the Oort cloud due to oscillations of the Solar System around its galactic plane (Napier Reference Napier2006; Stothers Reference Stothers2006; Nurmi et al. Reference Nurmi, Valtonen and Zheng2001) and interactions with spiral arms and other areas of enhanced star formation during the Sun's galactic orbit (Leitch & Vasisht Reference Leitch and Vasisht1998; Isley & Abbott Reference Isley and Abbott2002; Shaviv Reference Shaviv2003; Marcos & Marcos Reference Marcos de la Fuente and Marcos de la Fuente2004; Gies & Helsel Reference Gies and Helsel2005; Thomas et al. Reference Thomas2005; Svensmark Reference Svensmark2006).
Candidate events on Earth that have responded to galactic periodicity are expected to be global, or at least globally spatially replicated, and of large magnitude. In the light of this, we consider the timings of the largest impacts, carbon isotope excursions (CIE) and production of LIPs, and relate these to the timings of largest extinctions and geological period transitions. These data sets are interpreted in terms of the passing of the Solar System through the spiral arms of the galaxy. There is an implicit causality underpinning the analysis (galactic phenomena→LIPs/CIE/impacts→extinction) but we seek here to establish the temporal pattern rather than describe the mechanisms of change, which have been considered elsewhere (Thomas et al. Reference Thomas2005; Bambach Reference Bambach2006; Medvedev & Melott Reference Medvedev and Melott2007). We show how the periodicities of approximately 26–35, 60, 140, 180 and 550–730 Myr may be reconciled in a single model that reveals recurring periods of especially high extinctions and geological activity.
Methods
An important first step in the method was the assumption of the three superchrons of the Phanerozoic as periods of inter-arm stability (Wendler Reference Wendler2004). These occur at 120–84 mya (Cretaceous long normal), 312–264 mya (Kiaman reversed superchron) and the newly determined Ordovician Moyero superchron from about 485 to 463 mya (Pavlov & Gallet Reference Pavlov and Gallet2005). If geological, biological and climate events on Earth are affected by the passage of the Solar System through the arms, and the arms have a fixed symmetrical structure (Vallée Reference Vallée2005; Naoz & Shaviv Reference Naoz and Shaviv2007), then we may expect events to be organized in arithmetic sequences with differences of approximately 180 Myr (the difference between the end points of the last two superchrons). We searched for arithmetic sequences in the CIE/impact/LIP data with a 180 Myr difference or similar (events averaged within time windows of 5 Myr or less, Table 1). An observed fit of approximately 176 Myr was refined by assigning event ages to different time points in 11 different sequences and using event age as the dependent variable with the time points and sequences as continuous and categorical predictors, respectively, in a general linear model. Therefore, we assumed that there was one difference value across all sequences, but that the relative timings (and any pattern therein) of different sequences were unknown (full details of statistical results including predicted ‘missing’ events are given in the appendices; the high significance is not emphasized as the dependent values were selected as those with an approximately 176 Myr difference).
Results and discussion
The mean difference between successive values in the sequences was 175.96 Myr (standard error 0.428), which is interpreted as the time to move from a point in one arm to the same point in the next arm. With a total time of 703.8 Myr to pass through the four arms and inter-arm gaps, we can map major events to the position of the arms (Figure 1). Three high extinction events and associated geological periods (end-Ordovician 444 mya, end-Permian 251 mya and end-Cretaceous 65.5 mya) follow within 19–13 Myr after the end of the superchrons and are placed approximately at the midpoints of the last three arms (Carina-Sagittarius, Crux-Scutum and Cygnus-Norma) crossed by the Solar System. These three extinction events are highlighted by Bambach (Reference Bambach2006) as being ‘unambiguously separable’ from background extinction. The remaining two of the five mass extinction events originally identified by Raup & Sepkoski (Reference Raup and Sepkoski1982) occur at later positions after passing through the Cygnus-Norma and Crux-Scutum arms (Late Devonian and Late Triassic, respectively). The start of the Cambrian occurs at a similar position following the Perseus arm. The positions of these six extinction events with respect to arm crossings are detailed in Figure 2.
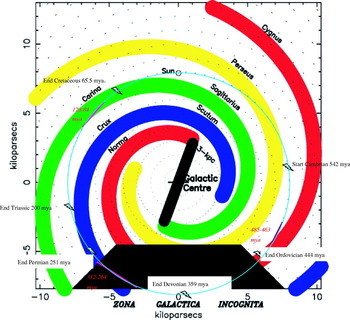
Fig. 1. Cycle of high extinction events and superchrons in a four spiral arm model of the Milky Way Galaxy. The current position of the Sun is indicated with an approximately circular orbit shown by the light blue circle (7.9 kpc radius). The positions of the six extinctions (jagged symbol) and three superchrons (purple lines) are determined from 703.8 Myr (175.96×4) as the time to pass through all four arms. Original figure of spiral arms from Vallée (Reference Vallée2005).

Fig. 2. Signature of events through the arms. Zones of high extinction activity are detailed in Table 2. The positions of the sequences A–L are indicated on the right-hand side. Symbols: ⋄, impacts with craters ⩾40 km diameter; □, geological period/high extinction midpoint; △, yellow, start of superchron and clear, end of superchron; and ×, large early impacts. The blue line in Zone 1 indicates the position of the spiral arm midpoints (Figure 1). Values for extinction/geological period points are absolute ages in contrast to the vertical axis, which shows time through the arm from sequence A. The two large early impacts occurred at 1850 and 2023 mya (equivalent to arms 11 and 12, i.e. Cygnus and Perseus), placing them between sequences A and B.
Three zones of high extinction activity are observed, agreeing within a few million years with the time periods between sequences A–D, E–H and J–L derived from the CIEs, LIPs and impacts (Figure 2, Tables 1 and 2). The three zones and intervening gaps are assumed to be of equal duration (175.96/6=29.3), starting from −2 Myr with sequence A as time zero. Zone 1 contains the midpoints of the arm positions (Figure 1) and follows or includes the end of a superchron, Zone 2 is the midpoint of the arm passage and Zone 3 the end of the arm passage and start of a new superchron. Zone 1 contains the three mass extinctions highlighted above. The largest extinction event of the Phanerozoic, the end-Permian, is aligned in sequence C with a major comet bombardment and LIP group at approximately 74 mya (Table 1) in the Carina-Sagittarius arm and the predicted average midpoints of the arms. There is also evidence of much earlier events in Zone 1; the largest recorded impacts of Sudbury and Vredefort of 1850 and 2023 mya fall within Zone 1 between sequences A and B (in the equivalent to Cygnus-Norma and Perseus arms, respectively). This would place the Sudbury impact within 1.5 Myr of the timing of the end-Ordovician (443.7 mya, Figure 2). Furthermore, Zone 1 of the predicted last crossing of the Perseus arm (622–593 mya) may overlap with the age of one of the largest recorded negative carbon isotope excursions (Kaufman et al. Reference Kaufman, Corsetti and Varni2007), close to the ages of the sequences containing the end-Permian (C) and the end-Cretaceous (D), namely 602.5 and 595.6 mya, respectively. The latter age is also consistent with the Acraman impact (circa 590 mya) with a crater diameter of 90 km.
Table 1. Geological and biological events used in analysis and predicted timings (mya) from the analysis. Values with difference of 5 Myr or less are shown in the same row and contribute to the average value in column 6 (the exception is 85.1 mya as flanked by two LIP ages of only 3 and 3.3 Myr difference). Only values in the average LIP, CIE and impact column were used in the general linear model. There is no sequence I. As the start point of the Quaternary geological period is debated, the midpoint of 2.588 and 1.806 is given (2.2). High extinction midpoints are the 18 high extinction periods in Bambach's (Reference Bambach2006) review and 542 mya (extinction of the Ediacaran fauna). Italicized carbon isotope excursion values indicate that they may not be global events. Impact ages are those with error <10 Myr. Sources for impacts, geological period ages, LIPs (absolute ages of LIPs within 3 Myr are averaged) and for carbon isotope excursions are in the appendices

Zone 2 is in the area following the arm passage in Figure 1 and includes the end-Triassic (Crux-Scutum arm), the end-Devonian (Cygnus-Norma arm) and the start of the Cambrian (Perseus arm). Other prominent extinction events include the Famennian-Frasnian (midpoint 376.3 mya). This zone has major CIE and impact events at its start and end, e.g., the large impacts of Popigai and Chesapeake Bay at 35.5 and 35.7 mya and the Manicouagan impact at 214 mya at the start of the Carina-Sagittarius and Crux-Scutum zones, respectively (Table 2 gives impact crater diameters), and the Toarcian CIE event 183 mya at the end of the Crux-Scutum zone. The early and middle Miocene (23–11 mya) in the Carina-Sagittarius Zone 2 includes extinction events amongst groups outside the marine set in Table 1, for example mammals at 17.5 mya and 12–10 mya (Jaeger & Hartenberger Reference Jaeger and Hartenberger1989). Although the Vallesian extinction event (11–10 mya) is only considered a European-wide event, other events within a few million years suggest that global climate change was occurring in the Middle Miocene; for example, there were large and sudden changes in climate in Antarctica with an estimated drop in mean annual temperature of 20–30°C between 14.11 and 13.85 mya and associated extinction of tundra species (Lewis et al. Reference Lewis, Marchant, Ashworth, Hemming and Machlus2007). This latter timing is tightly aligned with the start of the Cambrian at 542 mya in sequence G (predicted times of 541.96, 366.00, 190.05 and 14.09, Table 1). Zone 3 encompasses high extinction periods during the exit from each of the three arms, including the set of high extinction events in the late Cambrian (500–489 mya). The start of the superchrons occurs during or at the end of Zone 3, and follows all the high extinction events (a period of 19.5 Myr after the start of Zone 3 and approximately 134 Myr after the start of Zone 1). Only the end-Carboniferous (not identified as a high extinction) falls later, at the end of Zone 3.
Table 2. Timing of high activity zones and incidence of extinctions, geological periods and impacts within zones. Zone and gap durations are assumed to be equal. Values in parentheses in column 1 are timings (in Myr) with respect to sequence A as zero (see Table 1 and the appendices for a list of predicted ages in sequences). Values in columns 2 and 3 are absolute ages (mya). Geological period transition times are prioritized over high extinction midpoints where the two co-occur in the same 5 Myr or less window (Table 1)

Collectively 20 out of 22 of the high extinctions and/or geological periods and 19 out of the 25 impacts fall inside or within 3 Myr of the three zones (Table 2, excluding the two largest and much earlier impacts in Zone 1). The incidence of high extinction is significantly higher in the zones and their margins whilst impacts are close to significance (the fraction of time in the zones and 3 Myr margins is 105.9/176=0.6; G=10.69, P=0.0011, 1 d.f. for extinctions/geological periods and G=2.85, P=0.091 for impacts). If the zone boundaries equate to galactic plane crossings then the zones are consistent with one side of the galactic plane experiencing higher levels of extinction (Figure 3; Medvedev & Melott (Reference Medvedev and Melott2007) ).
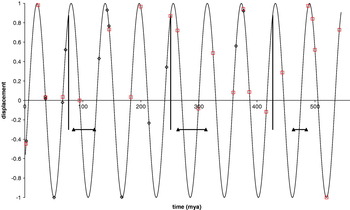
Fig. 3. Oscillation of the Solar System around the galactic plane assuming that the start and end of the zones are galactic plane crossings. Vertical black bars indicate the positions of spiral arm midpoints, horizontal bars indicate the duration of superchrons. Impacts and geological period/high extinction midpoint markers as in Figure 2. Zones 1–3 are those with positive displacements, Zone 1 contains the spiral arm midpoints.
The average difference of 175.96 Myr and three equally spaced zones of high activity of 29.3 Myr generate a set of possible solutions for geological and biological event periodicity. First, the time between corresponding positions in high activity zones is 2×29.3=58.6 Myr (i.e. 176/3), which is close to the 62±3 Myr predicted period from the marine fossil record (Rohde & Muller Reference Rohde and Muller2005). Second, the time of passage through the arms is predicted to be from the start of Zone 1 to the end of Zone 3, which is 5/6×175.96=146.6 Myr. Although this agrees with the periodicity of Fe–Ni meteorite exposure ages (143±10, Shaviv (Reference Shaviv2003) ) and the 140 Myr signal from the fossil record (Rohde & Muller Reference Rohde and Muller2005), it is not clear how the 140 Myr signal would emerge from the arm model presented here. Third, the galactic plane oscillation may be related to the timing through the arms, with an oscillation generated between equal density points in the arms. Whilst Figure 3 uses the zone boundaries as galactic plane crossings (and therefore supports the model of Medvedev and Melott (Reference Medvedev and Melott2007) ), setting the half-period of galactic plane oscillation as one-quarter of 175.96 (43.99 Myr) puts it within the tight error limits of other estimates (42±2 Myr, Bienayme et al. (Reference Bienayme, Soubiran, Mishenina, Kovtyukh and Siebert2006) ). Studies of impact crater periodicity produce results of 24, 29, 35 and 42–43 Myr (Napier Reference Napier2006; Stothers Reference Stothers2006). These are consistent with a function of the 176 Myr arm passing period (1/7, 1/6, 1/5 and 1/4; of 176 are 25.1, 29.3, 35.2 and 44 Myr, respectively). A similar result to the present 176 Myr periodicity was also reached in a study of high extinction events (Goncharov & Orlov Reference Goncharov and Orlov2003) that identified a signal of 183±3 Myr and explained it with a model of galactic plane oscillation.
If the time to move through all arms is 703.8 Myr and a galactic year is 226–240 Myr then the spiral arm pattern speed (Ωp) is predicted to be 0.679–0.659 times the speed of the Solar System (Ω⊙). Observed ratios of spiral arm speed (part of a fixed four arm set) to Solar System speed are 16.5/27.2=0.607 and 20/27.2=0.735 (Naoz & Shaviv Reference Naoz and Shaviv2007). Therefore, the ratio predicted from 703.8 Myr falls in the centre of the two values (the predicted Ωp from 703.8 Myr and a galactic year of 233 Myr is 18.2 km s−1 kpc−1).
In conclusion, a coherent pattern of mass extinction emerges with galactic forcing as the ultimate causal mechanism. It accounts not only for past events but may act as a predictor of future extinctions.
Acknowledgements
Our thanks to Jacques Vallée for kind permission to use his figure, and Jacques Vallée, Vince Gauci, Simon Kelley and Andrew Norton for comments on the manuscript.
Appendix A
Table A.1. Assigning of observed event values to arithmetic sequences and time position in sequences (sequence term)

Table A.2. General linear model results

Table A.3. Predicted values and residuals

Table A.4. Predicted values for all sequences and time points up to 620 mya

Appendix B
B.1. Carbon isotope excursions and references
In addition to reviews (e.g. Bambach Reference Bambach2006) and other literature in the main article the following were consulted to check timings, magnitude and spatial distribution of CIEs. The references are organized according to the associated event ages (rounded to the nearest million years):
542 mya
Schroder, S. & Grotzinger, J.P. (2007). Evidence for anoxia at the Ediacaran–Cambrian boundary: the record of redox-sensitive trace elements and rare earth elements in Oman. J. Geol. Soc. 164, 175–187.
Amthor, J.E. et al. (2003). Extinction of Cloudina and Namacalathus at the Precambrian-Cambrian boundary in Oman. Geology 31, 431–434.
509–506, 506–502 and 498–495 mya
Lindsay, J.F., Kruse, P.D., Green, O.R., Hawkins, E., Brasier, M.D., Cartlidge, J. & Corfield, R.M. (2005). The Neoproterozoic-Cambrian record in Australia: a stable isotope study. Precambr. Res. 143, 113–133.
444 mya
Bergtrom, S.M., Saltzman, M.M. & Schmitz, B. (2006). First record of the Hirnantian (Upper Ordovician) delta C-13 excursion in the North American Midcontinent and its regional implications. Geol. Mag. 143, 657–678.
438, 427 and 420 mya
Series of events c 438, 434, 427, 424 and 420 mya. 420 most prominent (middle Ludfordian). 427 (early Sheinwoodian) and 424 (middle to late Homerian) second largest. 438, 427 and 420 used as observed values in general linear model.
Brand, U., Azmy, K. & Veizer, J. (2006). Evaluation of the Salinic I tectonic, Cancaniri glacial and Ireviken biotic events: biochemostratigraphy of the Lower Silurian succession in the Niagara Gorge area, Canada and U.S.A. Palaeogeog., Palaeoclim. Palaeoecol. 241, 192–213.
Calner, M., Kozlowska, A., Masiak, M. & Schmitz, B. (2006) Shoreline to deep basin correlation chart for the middle Silurian coupled extinction-stable isotopic event. GFF 128, 79–84.
Cramer, B.D., Kleffner, M.A. & Saltzman, M.R. (2006). The Late Wenlock Mulde positive carbon isotope (delta C-13(carb)) excursion in North America. GFF 128, 85–90.
Kaljo, D. and Martma, T. (2006). Application of carbon isotope stratigraphy to dating the Baltic Silurian rocks. GFF 128, 123–129.
Lehnert, O., Fryda, J., Buggisch, W., Munnecke, A., Nutzel, A., Kriz, J. and Manda, S. (2007). Delta C-13 records across the late Silurian Lau event: new data from middle palaeo-latitudes of northern peri-Gondwana (Prague Basin, Czech Republic). Paleogeog., Palaeoclim. Palaeoecol. 245, 227–244.
Martma, T., Brazauskas, A., Kaljo, D., Kaminskas, D. & Musteikis, P. (2005). The Wenlock-Ludlow carbon isotope trend in the Vidukle core, Lithuania, and its relations with oceanic events. Geol. Quart. 49, 223–234.
382 mya
Yans, J., Corfield, R.M., Racki, G. & Preat, A. (2007). Evidence for perturbation of the carbon cycle in the Middle Frasnian punctata Zone (Late Devonian). Geol. Mag. 144, 263–270.
359 mya
Kaiser, S.I., Steuber, T., Becker, R.T. & Joachimski, M.M. (2006). Geochemical evidence for major environmental change at the Devonian–Carboniferous boundary in the Carnic Alps and the Rhenish Massif. Paleogeog., Palaeoclim. Palaeoecol 240, 146–160.
260, 252 and 247 mya
Isozaki, Y. Kawahata, H. & Ota, A. (2007). A unique carbon isotope record across the Guadalupian–Lopingian (Middle–Upper Permian) boundary in mid-oceanic paleo-atoll carbonates: The high-productivity “Kamura event” and its collapse in Panthalassa. Global Planetary Change 55, 21–38.
Payne, J.L. & Kump, L.R. (2007). Evidence for recurrent Early Triassic massive volcanism from quantitative interpretation of carbon isotope fluctuations. Earth Planet. Sci. Lett. 256, 264–277.
200 mya
Galli, M.T., Jadoul, F., Bernasconi, S.M. & Weissert, H. (2005). Anomalies in global carbon cycling and extinction at the Triassic/Jurassic boundary: evidence from a marine C-isotope record. Paleogeog., Palaeoclim. Palaeoecol. 216, 203–214.
183 mya
Hesselbo, S.P., Jenkyns, H.C., Duarte, L.V. & Oliveira, L.C.V. (2007). Carbon-isotope record of the Early Jurassic (Toarcian) Oceanic Anoxic Event from fossil wood and marine carbonate (Lusitanian Basin, Portugal) Earth Planet. Sci. Lett. 253, 455–470.
157 mya
Louis-Schmid, B., Rais, P., Bernasconi, S.M., Pellenard, P., Collin, P.Y. & Weissert, H. (2007). Detailed record of the mid-Oxfordian (Late Jurassic) positive carbon-isotope excursion in two hemipelagic sections (France and Switzerland): A plate tectonic trigger? Paleogeog., Palaeoclim. Palaeoecol. 248, 459–472.
137 mya
McArthur, J.M., Janssen, N.M.M., Reboulet, S., Leng, M.J., Thirlwall, M.F. & van de Schootbrugge, B. (2007). Palaeotemperatures, polar ice-volume and isotope stratigraphy (Mg/Ca, δ18O, δ13C, 87 Sr/86 Sr): the Early Cretaceous (Berriasian, Valanginian, Hauterivian). Paleogeog., Palaeoclim. Palaeoecol. 248, 391–430.
Sprovieri, M., Coccioni, R., Lirer, F., Pelosi, N. & Lozar, F. (2006). Orbital tuning of a lower Cretaceous composite record (Maiolica Formation, central Italy). Paleoceanogr. 21, PA4212.
128 mya
Baudin, F.A. (2005). Late Hauterivian short-lived anoxic event in the Mediterranean Tethys: the ‘Faraoni Event’. C. R. Geoscience 337, 1532–1540.
120 mya
van Breugel, Y., Schoten, S., Tsikos, H., Erba, E., Price, G.D. & Sinninghe Damste, J.S. (2007). Synchronous negative carbon isotope shifts in marine and terrestrial biomarkers at the onset of the early Aptian oceanic anoxic event 1a: evidence for the release of 13C-depleted carbon into the atmosphere. Paleoceanogr. 22, PA1210.
99.6 mya and various late Cretaceous
Jarvis, I., Gale, A.S., Jenkyns, H.C. & Pearce, M.A. (2006). Secular variation in Late Cretaceous carbon isotopes: a new δ13C carbonate reference curve for the Cenomanian-Campanian (99.6–70.6 Ma). Geol. Mag. 143, 561–608.
94 mya
Voigt, S., Aurag, A., Leis, F. & Kaplan, U. (2007). Late Cenomanian to Middle Turonian high-resolution carbon isotope stratigraphy: new data from the Munsterland Cretaceous Basin, Germany. Earth Planet. Sci. Lett. 253, 196–210.
71 mya
Friedrich, O. & Meier, K.J.S. (2006). Suitability of stable oxygen and carbon isotopes of calcareous dinoflagellate cysts for paleoclimatic studies: evidence from the Campanian/Maastrichtian cooling phase. Paleogeog. Palaeoclim. Palaeoecol. 239, 456–469.
65.5 mya
Maruoka, T. Koeberl, C. & Bohor, B.F. (2007). Carbon isotopic compositions of organic matter across continental Cretaceous–Tertiary (K–T) boundary sections: Implications for paleoenvironment after the K–T impact event. Earth Planet. Sci. Lett. 253, 226–238.
55.5 mya
Smith, T., Rose, K.D. & Gingerich, P.D. (2006). Rapid Asia-Europe-North America geographic dispersal of earliest Eocene primate Teilhardina during the Paleocene-Eocene Thermal Maximum. Proc. Natl. Acad. Sci. U.S.A. 103, 11 223–11 227.
B.2. Large igneous province ages and references
The LIP ages with differences of less than 3 Myr were averaged. Numerical LIP references here come from Ernst, R.E. and Buchan, K.L. (eds.) (2001) Mantle Plumes: Their Identification Through Time (Geological Society of America Special Paper, vol. 352). http://www.largeigneousprovinces.org/record.html (accessed February 2007). Alphabetical references are updates from other sources, e.g. LIP of month.

B.3. Geological timescale
Values were taken from:
Gradstein, F.M. et al. (2004). A Geologic Time Scale 2004. Cambridge University Press, Cambridge. International Commission on Stratigraphy. http://www.stratigraphy.org/.
B.4. Impacts
Values were taken from:
Planetary and Space Science Centre (2007). University of New Brunswick. Earth impact database. Earth Impact database (update July 16, 2007). http://www.unb.ca/passc/ImpactDatabase/.


