


1. Introduction
The Sultanate of Oman is host to a number of discrete exposures of basement rock that preserve complex histories that include a number of magmatic, metamorphic and deformational events (Gass et al. Reference Gass, Ries, Shackleton, Smewing, Robertson, Searle and Reis1990; Mercolli et al. Reference Mercolli, Briner, Frei, Schönberg, Nägler, Kramers and Peters2006; Rantakokko et al. Reference Rantakokko, Whitehouse, Pease, Windley, Rollinson, Searle, Abbasi, Al-Lazki and Kindi2014; Whitehouse, Pease & Al Khirbash, Reference Whitehouse, Pease and Al Khirbash2016). These exposures offer an insight into the palaeogeography of the region during Neoproterozoic time, a period of severe glacial episodes and the radiation of the Ediacaran fauna (e.g. Hoffman et al. Reference Hoffman, Kaufman, Halverson and Schrag1998; Meert & Lieberman, Reference Meert and Lieberman2008; Halverson et al. Reference Halverson, Hurtgen, Porter and Collins2009). A number of authors have used geochemistry to interpret the tectonic setting of the igneous and metamorphic basement of Oman to suggest that it formed in an intra-oceanic volcanic-arc setting (Gass et al. Reference Gass, Ries, Shackleton, Smewing, Robertson, Searle and Reis1990; Mercolli et al. Reference Mercolli, Briner, Frei, Schönberg, Nägler, Kramers and Peters2006; Bowring et al. Reference Bowring, Grotzinger, Condon, Ramezani, Newall and Allen2007; Rieu et al. Reference Rieu, Allen, Cozzi, Kosler and Bussy2007; Rantakokko et al. Reference Rantakokko, Whitehouse, Pease, Windley, Rollinson, Searle, Abbasi, Al-Lazki and Kindi2014) within the Neoproterozoic Mozambique Ocean (Johnson & Woldehaimanot, Reference Johnson, Woldehaimanot, Yoshida, Windley and Dasgupta2003; Kröner & Stern, Reference Kröner, Stern, Selley, Cocks and Plimer2004; Allen, Reference Allen2007; Bowring et al. Reference Bowring, Grotzinger, Condon, Ramezani, Newall and Allen2007; Rantakokko et al. Reference Rantakokko, Whitehouse, Pease, Windley, Rollinson, Searle, Abbasi, Al-Lazki and Kindi2014). The relationship between the Omani basement and the arc terranes of the Arabian–Nubian Shield (ANS) has been addressed by several authors, but with little consensus as to whether it should be considered an eastern extension of the ANS (Johnson & Woldehaimanot, Reference Johnson, Woldehaimanot, Yoshida, Windley and Dasgupta2003; Collins & Pisarevsky, Reference Collins and Pisarevsky2005; Johnson et al. Reference Johnson, Andresen, Collins, Fowler, Fritz, Ghebreab, Kusky and Stern2011; Rantakokko et al. Reference Rantakokko, Whitehouse, Pease, Windley, Rollinson, Searle, Abbasi, Al-Lazki and Kindi2014; Whitehouse, Pease & Al Khirbash, Reference Whitehouse, Pease and Al Khirbash2016; Merdith et al. in press).
Jebel Ja'alan lies in eastern Oman (Fig. 1) and contains well-exposed metamorphic and igneous rocks that comprise a rare window into the basement of far eastern Arabia. The area is of considerable significance because, within Gondwana, eastern Arabia sits within a poorly known region that separates the well-exposed Arabian Shield from Rajasthan in NW India (Collins & Pisarevsky, Reference Collins and Pisarevsky2005). Eastern Arabia is almost entirely covered by Phanerozoic rocks, with occurrences of Neoproterozoic outcrop being small and limited in number. In this context, Jebel Ja'alan's rocks preserve evidence for the Neoproterozoic tectonic geography between Neoproterozoic India and the ANS.

Figure 1. (a) Location map of the Arabian–Nubian Shield (ANS) and Oman (adapted from Blades et al. Reference Blades, Collins, Foden, Payne, Xu, Alemu, Woldetinsae, Clark and Taylor2015; Allen, Reference Allen2007). Note the >800 km gap between the basement exposed in Oman and the nearest terranes of the ANS. (b) Location map of Jebel Ja'alan; study areas are indicated by the black dashed boxes.
In this study we present U–Pb (monazite and zircon) and 40Ar/39Ar (muscovite) geochronological data in order to constrain the timing of crystallization of igneous intrusions in the Jebel Ja'alan region, as well as the timing of metamorphism of the country rocks. Radiogenic isotopic data (Hf, Nd) from igneous bodies in Jebel Ja'alan are used to interpret the origin of the basement, whereas phase equilibria modelling in conjunction with trace-element geochemical data from igneous rocks are used to constrain the tectonic setting in which these rocks formed. The results of this study are used to argue that the basement of Jebel Ja'alan indeed formed in a juvenile volcanic-arc environment during Tonian time, but with resolvable differences to other exposures of Omani basement. These conclusions are similar to those from a recent study by Whitehouse, Pease & Al Khirbash (Reference Whitehouse, Pease and Al Khirbash2016), who investigated the same area with a more restrictive dataset. We also discuss the regional significance of these results and observations and argue that the Omani basement represents its own tectonic domain separate to the ANS and more related to NW India, Pakistan, the Seychelles and the Bemarivo Belt of north Madagascar.
2. Geological setting
2.a. Oman and the Arabian–Nubian Shield (ANS)
Numerous authors have recognized the similarities between the basement rocks of Oman and those of Yemen and the ANS. Many note the possibility that Oman represents an eastern extension of the ANS (Gass et al. Reference Gass, Ries, Shackleton, Smewing, Robertson, Searle and Reis1990; Immenhauser et al. Reference Immenhauser, Schreurs, Gnos, Oterdoom and Hartmann2000; Collins & Pisarevsky, Reference Collins and Pisarevsky2005; Worthing, Reference Worthing2005; Stern & Johnson, Reference Stern and Johnson2010; Rantakokko et al. Reference Rantakokko, Whitehouse, Pease, Windley, Rollinson, Searle, Abbasi, Al-Lazki and Kindi2014), which was described by Johnson et al. (Reference Johnson, Andresen, Collins, Fowler, Fritz, Ghebreab, Kusky and Stern2011) as a collage of Neoproterozoic juvenile arcs, younger sedimentary and volcanic basins, granitoid intrusions and enclaves of pre-Neoproterozoic crust. However, the absence of pre-Phanerozoic outcrop between Oman and the Arabian Shield of Saudi Arabia impede any direct connection between the regions (Johnson & Woldehaimanot, Reference Johnson, Woldehaimanot, Yoshida, Windley and Dasgupta2003; Collins & Pisarevsky, Reference Collins and Pisarevsky2005; Rantakokko et al. Reference Rantakokko, Whitehouse, Pease, Windley, Rollinson, Searle, Abbasi, Al-Lazki and Kindi2014). Crustal growth of the ANS is commonly interpreted to have occurred during c. 870–600 Ma (Johnson & Woldehaimanot, Reference Johnson, Woldehaimanot, Yoshida, Windley and Dasgupta2003; Meert, Reference Meert2003; Kröner & Stern, Reference Kröner, Stern, Selley, Cocks and Plimer2004; Stern & Johnson, Reference Stern and Johnson2010), with volcanic arcs formed on the juvenile crust of the Mozambique Ocean (Johnson & Woldehaimanot, Reference Johnson, Woldehaimanot, Yoshida, Windley and Dasgupta2003; Meert, Reference Meert2003; Kröner & Stern, Reference Kröner, Stern, Selley, Cocks and Plimer2004; Rantakokko et al. Reference Rantakokko, Whitehouse, Pease, Windley, Rollinson, Searle, Abbasi, Al-Lazki and Kindi2014). However, reports of Stenian (1030–1020 Ma) volcanic-arc rocks in the Sinai (Be'eri-Shlevin et al. Reference Be'eri-Shlevin, Eyal, Eyal, Whitehouse and Litvinovsky2012) hint at a pre-Neoproterozoic origin for subduction in the region that questions the long-held view of an early Tonian rift history forming the Mozambique Ocean (Stern, Reference Stern1994).
Amalgamation of these arc terranes and associated ophiolitic remnants, which form the majority of the exposed ANS, are interpreted to have occurred as early as c. 845 Ma (Robinson et al. Reference Robinson, Foden, Collins and Payne2014; Robinson, Foden & Collins, Reference Robinson, Foden and Collins2015a) via arc–arc convergence and terrane suturing (Johnson & Woldehaimanot, Reference Johnson, Woldehaimanot, Yoshida, Windley and Dasgupta2003; Robinson et al. Reference Robinson, Foden, Collins and Payne2014; Robinson, Foden & Collins, Reference Robinson, Foden and Collins2015a). Several studies note that the youngest exposed volcanic-arc magmatism and arc accretion occur in the easternmost exposed part of the ANS (Doebrich et al. Reference Doebrich, Al-Jehani, Siddiqui, Hayes, Wooden and Johnson2007; Johnson et al. Reference Johnson, Andresen, Collins, Fowler, Fritz, Ghebreab, Kusky and Stern2011; Cox et al. Reference Cox, Lewis, Collins, Halverson, Jourdan, Foden, Nettle and Kattan2012), which suggests that younger arc terranes may lie beneath the Rub Al-Khali basin where magnetic highs similar to the ANS arcs occur (Johnson & Stewart, Reference Johnson and Stewart1995). The terranes that comprise the western ANS were recently shown to have accreted to the East Saharan Craton during Cryogenian time (Westerhof et al. Reference Westerhof, Härmä, Isabirye, Katto, Koistinen, Kuosmanen, Lehto, Lehtonen, Mäkitie and Manninen2014; Blades et al. Reference Blades, Collins, Foden, Payne, Xu, Alemu, Woldetinsae, Clark and Taylor2015), but the central terranes – that may have earlier amalgamated into a discrete ANS continent – are thought to have accreted onto the East Saharan Craton during late Cryogenian–Ediacaran time (Meert, Reference Meert2003; Li et al. Reference Li, Bogdanova, Collins, Davidson, De Waele, Ernst, Fitzsimons, Fuck, Gladkochub and Jacobs2008; Johnson et al. Reference Johnson, Andresen, Collins, Fowler, Fritz, Ghebreab, Kusky and Stern2011). This suggests that arc volcanism and accretion in the ANS continued to occur long after similar processes had ceased in Oman around early Cryogenian time (Mercolli et al. Reference Mercolli, Briner, Frei, Schönberg, Nägler, Kramers and Peters2006; Rantakokko et al. Reference Rantakokko, Whitehouse, Pease, Windley, Rollinson, Searle, Abbasi, Al-Lazki and Kindi2014). During late Neoproterozoic time, volcanic-arc-related processes in Oman were superseded by deposition of the Huqf Supergroup (Leather et al. Reference Leather, Allen, Brasier and Cozzi2002; Allen, Leather & Brasier, Reference Allen, Leather and Brasier2004; Allen, Reference Allen2007; Bowring et al. Reference Bowring, Grotzinger, Condon, Ramezani, Newall and Allen2007; Rieu et al. Reference Rieu, Allen, Cozzi, Kosler and Bussy2007; Allen et al. Reference Allen, Leather, Brasier, Rieu, McCarron, le Guerroué, Etienne, Cozzi, Arnaud, Halverson and Shields2011). The strata of the Huqf Supergroup contain glacial deposits and cap-carbonates overlain by siliciclastic and carbonate shelf deposits, which are in turn overlain by evaporites, carbonates and organic-rich shales (Leather et al. Reference Leather, Allen, Brasier and Cozzi2002; Allen, Leather & Brasier, Reference Allen, Leather and Brasier2004; Allen, Reference Allen2007; Bowring et al. Reference Bowring, Grotzinger, Condon, Ramezani, Newall and Allen2007; Rieu et al. Reference Rieu, Allen, Cozzi, Kosler and Bussy2007; Allen et al. Reference Allen, Leather, Brasier, Rieu, McCarron, le Guerroué, Etienne, Cozzi, Arnaud, Halverson and Shields2011). Allen (Reference Allen2007) suggests that the sedimentary sequences seen in the Huqf Supergroup represent a rift sequence, followed by a passive margin succession. Rieu et al. (Reference Rieu, Allen, Cozzi, Kosler and Bussy2007) suggests that these correlate with similar successions exposed in the Salt Range of Pakistan and in the Bikaner–Nagaur Basin that straddles the border of India and Pakistan.
2.b. Jebel Ja'alan
Jebel Ja'alan is located in NE Oman, approximately 50 km south of the town of Sur (Fig. 1). The basement rocks exposed around the jebel have previously been dated as Neoproterozoic (Gass et al. Reference Gass, Ries, Shackleton, Smewing, Robertson, Searle and Reis1990). These basement lithologies are unconformably overlain by chert conglomerates, lithic sandstones and shales or marls of the upper Campanian – lower Maastrichtian Qahlah Formation, whereas the summit is capped by conformably overlying Maastrichtian limestones of the Simsima Formation (Filbrandt, Nolan & Ries, Reference Filbrandt, Nolan, Ries, Robertson, Searle and Reis1990). On the northern side of the inlier are metapelitic schist and orthogneiss, with rarer occurrences of variably deformed granodiorite, granite, diorite and hornblendite (Gass et al. Reference Gass, Ries, Shackleton, Smewing, Robertson, Searle and Reis1990). On the southern side of the mountain lies an extensive undeformed granite pluton that intrudes the schist and gneiss that crop out to the north. The granite pluton is cross-cut by several distinct dyke generations of varying chemistry and orientation. The granite was previously dated by Pallister et al. (Reference Pallister, Cole, Stoeser and Quick1990), who published U–Pb ages of granite intrusions in Jebel Ja'alan ranging over 830–825 Ma. Gass et al. (Reference Gass, Ries, Shackleton, Smewing, Robertson, Searle and Reis1990) published a Rb–Sr whole-rock isochron age for the Ja'alan Granite of 850±27 Ma. These authors also reported a Rb–Sr isochron age of 773±34 Ma for the orthogneiss and a K–Ar whole-rock age of 430±20 Ma for a mafic dyke, although the significance of those apparent whole-rock ages is questionable due to these rocks likely being at least partially altered. A more recent study by Whitehouse, Pease & Al Khirbash (Reference Whitehouse, Pease and Al Khirbash2016) produced SIMS U–Pb zircon crystallization ages for the Ja'alan Granite and Ja'alan Gneiss, ranging over 840–825 Ma and 900–880 Ma, respectively. These authors also obtained Nd isotopic data for these lithologies, which gave juvenile εNd(t) values ranging from +6 to +1.5. This is suggested to correspond to increased crustal contamination relative to the Mirbat region, reflecting successive outwards growth from a continental margin.
3. Methodology
Samples were collected from various lithologies found within the Jebel Ja'alan area. These were analysed for geochronology, geochemistry and thermobarometric forward modelling as detailed below. The structural context of these samples was constrained by mapping an approximate 2×3.5 km area of the region, which is fully described in the online supplementary material (available at http://journals.cambridge.org/geo). Lower-hemisphere equal-area stereographic projections were created for structural data using the Stereonet 9 program, based on algorithms described by Cardozo & Allmendinger (Reference Cardozo and Allmendinger2013) and Allmendinger, Cardozo & Fisher (Reference Allmendinger, Cardozo and Fisher2011).
3.a. Geochronology and isotope geochemistry
3.a.1. U–Pb monazite and zircon
Zircon was analysed to constrain magmatic crystallization ages whereas monazite was analysed to constrain the age of metamorphism. U–Pb age data were obtained from in situ monazite grains as well as separated zircon grains that were extracted from crushed rocks using standard magnetic and heavy liquid techniques. Zircon separates were hand-picked, mounted in epoxy resin and then polished to expose the grains. The thin-sections and grains were imaged on Phillips XL30 and XL20 scanning electron microscopes (SEM), respectively. Zircon grains were imaged using a cathodoluminescence (CL) detector to identify internal structure prior to isotopic analysis. Zircon and monazite grains were analysed via laser ablation inductively coupled plasma mass spectrometry (LA–ICP–MS), using an Agilent 7500cs and NewWave UP213 laser ablation system. Imaging of grains and measuring of U–Pb isotopes was conducted at Adelaide Microscopy, located at the University of Adelaide. Ablation of monazite and zircon was performed in a He-ablation atmosphere with a frequency of 5 Hz. A spot size of 10 μm was used for all monazite samples and 30 μm for all zircon samples. The acquisition time for all monazite samples was 80 s in total, with 30 s of background acquisition, 10 s of the laser firing with the shutter closed to ensure beam stabilization and 40 s of sample ablation. Zircon samples had an acquisition time of 60 s total, with 30 s of background acquisition followed by 30 s of sample ablation. Elemental fractionation and mass bias for monazite grain analyses were corrected using the primary standard MAdel (207Pb/206Pb = 491±2.7 Ma, 206Pb/238U = 518.37±0.99 Ma, 207Pb/235U = 513.13±0.19 Ma; Payne et al. Reference Payne, Hand, Barovich and Wade2008). Data accuracy was monitored using the monazite standard 94–222/Bruna-NW (c. 450 Ma; Payne et al. Reference Payne, Hand, Barovich and Wade2008). Throughout this study MAdel yielded weighted mean ages of 207Pb/206Pb = 492±14 Ma, 206Pb/238U = 518±5.2 Ma, 207Pb/235U = 513±4.8 Ma (n = 29, 2σ errors). The zircon standard (GJ) (206Pb/238U = 608.5±0.4 Ma; Jackson et al. Reference Jackson, Pearson, Griffin and Belousova2004) was used as the primary standard for all zircon analyses, while Plešovice (206Pb/238U = 337.13±0.37 Ma; Sláma et al. Reference Sláma, Košler, Condon, Crowley, Gerdes, Hanchar, Horstwood, Morris, Nasdala and Norberg2008) was used as a secondary standard. Throughout this study Plešovice yielded an average 206Pb/238U age of 333.8±2.1 Ma (n = 80, 2σ errors). U–Pb data were reduced using Gemoc laser ICPMS total trace-element reduction (GLITTER; Jackson et al. Reference Jackson, Pearson, Griffin and Belousova2004).
3.a.2. Lu–Hf
An ESI New Wave UP-193 nm excimer laser attached to a Thermo-Scientific Neptune Multi-Collector ICP–MS at The University of Adelaide was used to measure the concentration of Hf isotopes in zircon grains. Analytical methods follow Payne et al. (Reference Payne, Pearson, Grant and Halverson2013) and Griffin et al. (Reference Griffin, Wang, Jackson, Pearson, O'Reilly, Xu and Zhou2002). A spot size of 50 μm was used for all appropriately sized zircon grains, decreasing to 25 μm when required. Zircons were ablated in a helium atmosphere, which was mixed with argon upstream of the ablation cell, for 40–100 s with a 5 Hz repetition rate, a 4 ns pulse rate and an intensity of 10 J cm–2. Known standards were run before and between the unknown samples to verify the stability and performance of the instrument. The primary standard used was Plešovice, which yielded a mean 176Hf/177Hf ratio of 0.282470±0.000015. This compares to the published value of 0.282482±0.000013 provided by Sláma et al. (Reference Sláma, Košler, Condon, Crowley, Gerdes, Hanchar, Horstwood, Morris, Nasdala and Norberg2008). During the study Plešovice also yielded a mean 178Hf/177Hf ratio of 1.46730±0.00028, which is also in agreement with that published (1.46723±0.00002 and 1.46719±0.00010) by Sláma et al. (Reference Sláma, Košler, Condon, Crowley, Gerdes, Hanchar, Horstwood, Morris, Nasdala and Norberg2008). Reduction of zircon data was undertaken using the Hf isotope data reduction spreadsheet, HfTRAX (Payne et al. Reference Payne, Pearson, Grant and Halverson2013). Data were normalized to 179Hf/177Hf = 0.7325, using an exponential correction for mass bias. Yb and Lu isobaric interferences on 176Hf were corrected for following the methodology of Woodhead et al. (Reference Woodhead, Hergt, Shelley, Eggins and Kemp2004).
3.a.3. 40Ar/39Ar
Two samples of muscovite were used for 40Ar/39Ar dating. Grains were separated using a paper-shaking technique then hand-picked and sent to the Western Australia Argon Isotope Facility, Curtin University. Samples were loaded into wells and bracketed by small wells that included Fish Canyon sanidine (FCs) used as a neutron monitor yielding an age of 28.294±0.13 Ma (1σ) using the decay constants proposed by Renne et al. (Reference Renne, Balco, Ludwig, Mundil, Min and Renne2011). The correction factors for interfering isotopes were (39Ar/37Ar)Ca = 7.30×10⁻⁴ (±11%), (36Ar/37Ar)Ca = 2.82×10⁻⁴ (±1%) and (40Ar/39Ar)K = 6.76×10⁻⁴ (±32%). Samples were step-heated using a 110 W Spectron laser system, with a continuous Nd–YAG (IR: 1064 nm) laser. Ar isotopes were measured in static mode using a MAP 215–50 mass spectrometer, with a Balzers SEV 217 electron multiplier primarily using nine to ten cycles of peak-hopping.
3.a.4. Samarium–neodymium, rubidium–strontium isotopes
Isotopic analyses of Sm, Nd and Sr were conducted on samples of the igneous lithologies located in southern Jebel Ja'alan. Preparation and analysis of whole-rock isotopic data follow procedures implemented by Payne et al. (Reference Payne, Hand, Barovich and Wade2008) and Wade et al. (Reference Wade, Hand, Maidment, Close and Scrimgeour2008). Isotopic ratios were measured on a Finnigan MAT262 thermal ionization mass spectrometer (TIMS). The neodymium standard JDNi-1 returned a mean 143Nd/144Nd value of 0.512074±0.00001 (n = 5). The blanks show negligible Nd and Sm. When calculating εNd values an approximated age of 840 Ma was used, as this is the interpreted crystallization age (Gass et al. Reference Gass, Ries, Shackleton, Smewing, Robertson, Searle and Reis1990).
3.b. Elemental geochemistry
3.b.1. Whole-rock geochemistry
Whole-rock geochemical analysis of Al Wafi Mica Schist sample JA15-04 for phase equilibria forward modelling of two schist samples was undertaken using X-ray fluorescence (XRF) at Bureau Veritas Minerals (Western Australia). Major elements were analysed on fused beads using a lithium tetraborate flux, as described by Kil & Jung (Reference Kil and Jung2015). All other samples were geochemically analysed via XRF at a CSIRO laboratory (South Australia). Trace-element analysis was carried out using LA–ICP–MS. These analyses used fused XRF disks prepared using the methodology outlined by Kil & Jung (Reference Kil and Jung2015).
3.b.2. Mineral chemistry
Chemical compositions of silicate minerals used to constrain P–T conditions were obtained via electron probe micro-analysis (EPMA) using a CAMECA SX5 microprobe at the University of Adelaide. A beam current of 20 nA and an accelerating voltage of 15 kV were used for all point analyses.
3.b.3. Phase equilibria forward modelling
Pseudosections were calculated for Al Wafi Mica Schist samples (JA15-04 and JA15-43) using the bulk composition obtained for sample JA15-04 via XRF analysis. The bulk composition of JA15-04 is argued to be a valid proxy for JA15-43, due to their similarity in both preserved mineral assemblage and measured mineral compositions (refer to supplementary material). Pseudosections were calculated using the phase equilibrium modelling program ThermoCalc v.3.37 with the internally consistent thermodynamic dataset of Holland & Powell (Reference Holland and Powell2011), ds62. Quantitative P–T information was calculated for the geologically realistic system MnNCKFMASHTO (MnO–Na2O–CaO–K2O–FeO–MgO–Al2O3–SiO2–H2O–TiO2–Fe2O3). Activity–composition (a–X) models used are from Powell et al. (Reference Powell, White, Green, Holland and Diener2014), White et al. (Reference White, Powell, Holland, Johnson and Green2014) and White, Powell & Johnson (Reference White, Powell and Johnson2014). Numerous authors highlight the uncertainty of H2O and Fe2O3 abundances measured during routine whole-rock geochemical (XRF) analyses (Fitton & Gill, Reference Fitton and Gill1970; Korhonen, Powell & Stout, Reference Korhonen, Powell and Stout2012; Kelsey & Hand, Reference Kelsey and Hand2015; Morrissey, Hand & Kelsey, Reference Morrissey, Hand and Kelsey2015). As such, appropriate H2O and Fe2O3 (‘O’) contents for each modelled sample were evaluated via the calculation of T–M H2O and T–M O pseudosections prior to the calculation of P–T pseudosections.
4. Results
4.a. Field-based geology
4.a.1. Lithological units
In the field, ten distinct lithologies were encountered: metapelitic schist (Al Wafi Mica Schist; Roger et al. Reference Roger, Bechennec, Janjou, Le Metour, Wyns and Beurrier1991; referred to here as the Al Wafi Schist), orthogneiss (Ja'alan Gneiss; Roger et al. Reference Roger, Bechennec, Janjou, Le Metour, Wyns and Beurrier1991), titanite-biotite-sillimanite-staurolite±muscovite schist, granite (Ja'alan Granite, equivalent to the Ja'alan batholith of Roger et al. Reference Roger, Bechennec, Janjou, Le Metour, Wyns and Beurrier1991), granodiorite (Kamil Granodiorite), dolerite dykes (informally divided into the ‘Brown Dolerite’ and ‘Grey Dolerite’ based on their weathering colour), andesite dykes, hornblendite and sedimentary rocks of the Qahlah Formation. These lithologies are summarized in Table 1. Cross-cutting relationships suggest that the ‘Grey Dolerite’ is the oldest dyke generation, succeeded by the andesite then ‘Brown Dolerite’ dykes. Magma mingling textures observed between the ‘Grey Dolerite’/andesite dykes and the Ja'alan granite indicate that these dykes likely intruded prior to cooling of the granite. Photographs of the dominant lithologies and key cross-cutting relationships are presented in Figure 2. Detailed descriptions of the mapped lithologies are provided in the supplementary material.
Table 1. Summary and description of lithologies encountered in the Jebel Ja'alan study areas (bi – biotite; chl – chlorite; cpx – clinopyroxene; ep – epidote; grt – garnet; hbl – hornblende; ilm – ilmenite; kfs – K-feldspar; ms – muscovite; mt – magnetite; pl – plagioclase; py – pyrite; qtz – quartz; sil – sillimanite; st – staurolite; ttn – titanite).


Figure 2. Field photos from Jebel Ja'alan. (a) Parasitic folding of the Al Wafi Schist with minor fold limb, axial plane and hinge measurements displayed. (b) Hill displaying the cross-cutting relationships between the Ja'alan Granite, Grey Dolerite and Brown Dolerite. (c) Outcrop again displaying the cross-cutting relationships between the Ja'alan Granite, Grey Dolerite and Brown Dolerite, but also showing the cross-cutting relationship between andesite dykes and the Ja'alan Granite. (d) Ja'alan Gneiss outcrop displaying a sigma clast that is indicative of a top-to-the-NE sense of movement.
4.a.2. Rock relations and structural geology
Structural and lithological data from the north and south study areas of Jebel Ja'alan are presented in Figure 3. Al Wafi Schist and Ja'alan Gneiss dominate the region to the north of Jebel Ja'alan. The Al Wafi Schist occurs in the west of the study area and has a structural contact with the SE Ja'alan Gneiss. To the east, the Ja'alan Gneiss is thrust top-to-the-north over the Al Wafi Schist along a broadly E–W-aligned boundary, whereas the western boundary of the Ja'alan Gneiss is marked by a N–S-striking, top-to-the-east thrust of Al Wafi Schist over the Ja'alan Gneiss.

Figure 3. Structural and lithological maps of the north and south study areas. Jebel Ja'alan is located 50 km south of Sur and 15 km north of Jalan Bani Bu Ali. Grid references refer to WGS84 (Zone 40N) and UTM coordinates. (a) Northern Jebel Ja'alan study area, notably comprising Al Wafi Schist, Ja'alan Gneiss and Ja'alan Granite. The Ja'alan Gneiss can be observed to be thrust over the Al Wafi Schist along the E–W boundary between the lithologies, while the Al Wafi Schist is interpreted to be thrust over the Ja'alan Gneiss along the N–W boundary. Structural data from the northern study area are presented in accompanying stereonets: (i) plunge and plunge-direction of Al Wafi Schist aggregate mineral lineations plotted as points; (ii) dip and dip-direction of Al Wafi Schist axial planes (minor folds) plotted as great circles; (iii) dip and dip-direction of Al Wafi Schist foliations plotted as great circles (grey) and poles (black) (profile plane and pole are shown in red); (iv) dip and dip-direction of Ja'alan Gneiss foliations plotted as great circles (grey) and poles (black) (rofile plane and pole are shown in red); (v) plunge and plunge-direction of Ja'alan Gneiss aggregate mineral lineations plotted as points; and (vi) dip and dip-direction of Ja'alan Gneiss axial planes (minor folds) plotted as great circles. Foliation data from the Al Wafi Schist and Ja'alan Gneiss show opposing groups of NW- and SE-dipping foliations, but with the presence of several close-to-vertical measurements observed within the Al Wafi Schist. Calculating the pole to a profile plane of foliation measurements results in a value of 12→237 for the Al Wafi Schist, and 08→230 for the Ja'alan Gneiss. Measurements of minor fold axial planes within the Ja'alan Gneiss can be seen to be somewhat similar to the spread of foliation data. In comparison, the few measurements in the Al Wafi Schist are more suggestive of approximately N–S-trending folds. Measurements of aggregate mineral lineations in the Al Wafi Schist and Ja'alan Gneiss display a similar trend of gently inclined SSW-plunging lineations. It can be observed that the trend of these lineations are approximately 30° away from the calculated poles to profile planes of the Al Wafi Schist and Ja'alan Gneiss foliation measurements, which may reflect shearing that occurred prior to folding of these lithologies. (b) Southern Jebel Ja'alan study area. The dominant lithology in the study area is the Ja'alan Granite, which is bounded in the SE by hornblendite and by Ja'alan Gneiss in the north. A number of the Brown Dolerite dykes have been interpreted in this study area via satellite photo interpretation.
The foliation data (S1; Fig. 3a, stereonets iii and iv) indicate two phases of folding. The first phase of folding (F1) is interpreted from a series of approximately ENE-trending folds. The second phase (F2) is interpreted from a pair of approximately N–S-trending folds that overprint the earlier folds and fold the Ja'alan Gneiss over Al Wafi Schist thrust. Measurements of minor fold axial planes from the Ja'alan Gneiss (Fig. 3a, stereonets ii and vi) are broadly E–W striking and are consistent with the first phase of folding. However, N–S-striking axial planes from the Al Wafi Schist are interpreted as being related to this second phase of N–S-trending folding. Mineral aggregate lineation data (Fig. 3a, stereonets i and v) from both lithologies correlate reasonably well with the plunge and plunge direction of the fold hinges calculated from foliation measurements (12→237 for the Al Wafi Schist, 08→230 for the Ja'alan Gneiss), but can be seen to consistently trend in a more southerly direction (c. 200°). The folding of this contact and supra-position of N–S-trending folds over earlier, broadly E–W-trending folds suggests that a N–S contraction (D1) pre-dated an E–W contraction (D2). The N–S folds interpreted as forming in the same stress field as the N–S striking thrust and the E–W trending folds are interpreted with the same stress field that formed the thrust that juxtaposed the Ja'alan Gneiss over the Al Wafi Schist.
The Ja'alan Granite forms a batholith that dominates the area to the south of Jebel Ja'alan. The northern margin of the batholith forms an intrusive contact with the Ja'alan Gneiss, whereas to the SE it is bordered by a hornblendite that may be a co-magmatic cumulate. Dykes cross-cut all rocks and form three main swarms, identified on the basis of lithology, orientation and cross-cutting relationships. Early ‘Grey Dolerite’ and andesite dykes share similar dip angles and are interpreted to belong to the same suite. The orientation of these vary, but are commonly shallow dipping, have irregular margins, commonly mingle with the surrounding granite (Fig. 2c) and follow a rough NE–SW-aligned trend. A later suite of brown-weathering dolerite dykes cross-cut all other lithologies (the ‘Brown Dolerite’). These are steeply dipping, easily visible on aerial imagery and consistently strike towards c. 120°.
4.b. U–Pb geochronology
LA–ICP–MS analytical data are presented in the supplementary material. Analyses have been categorized into their broadly identified internal structure based on SEM CL imaging and grains used for concordia age calculations. Data are presented using Wetherill concordia diagrams (207Pb/235U v. 206Pb/238U). All age uncertainties are quoted at the two sigma level. An attempt was made to analyse zircons from the Ja'alan Granite Batholith; the obtained data are however poor and full of common Pb, so have not been presented.
4.b.1. Kamil Granodiorite
Zircons in samples JA15-08 (742899 m E, 2460099 m N) and JA15-09 (742927 m E, 2460090 m N) (WGS84 reference frame, UTM coordinates, zone 40N) are usually clear with a slight yellow tint, with some grains being noticeably darker. Crystal lengths range from c. 50 μm to 250 μm, with aspect ratios generally being elongate prismatic (4:1) or occasionally stubby (1:1). CL images (Fig. 4) of all zircon grains showed oscillatory zonation, confirming an igneous origin (Corfu et al. Reference Corfu, Hanchar, Hoskin and Kinny2003). Consequently, all analyses were targeted at the oscillatory-zoned zircon cores. Fifty U–Pb analyses were conducted on zircons separated from sample JA15-08 (Fig. 5). Forty analyses occur within 95% of concordance and yielded 206Pb/238U single grain ages ranging over c. 970–760 Ma. The mean 206Pb/238U age was calculated to be 835±9 Ma with a mean square weighted deviation (MSWD) of 5.8 (n = 40). Such an MSWD is too high for the number of zircon analyses undertaken and represents an over-dispersion in the data (Wendt & Carl, Reference Wendt and Carl1991). By examining the data in a weighted average plot (Fig. 5b), the four oldest grains were excluded from age calculations on the basis that they may represent inherited zircon. The youngest four zircons were also excluded on the interpretation that these grains may have been subjected to radiogenic Pb loss. Calculating a 206Pb/238U weighted average age with these grains excluded results in an age of 836±4 Ma with an MSWD of 0.90 and P-value of 0.62 (n = 31), which is interpreted as a reliable estimate of the age of crystallization.

Figure 4. Cathodoluminescence (CL) images of Zircons from samples selected for geochronological analysis. Numbered circles represent LA–ICP–MS spot locations of 30 µm diameter, while accompanying larger circles on each grain represent MC–LA–ICP–MS spot locations. KG – Kamil Granodiorite; JGS – Ja'alan Gneiss.

Figure 5. (a) U–Pb concordia diagram for ≥95% concordant zircons from Kamil Granodiorite sample JA15-08 with 2σ data point error ellipses. Shaded ellipses represent grains used to produce a 206Pb/238U weighted average age, while clear ellipses indicate omitted grains. (b) Age analysis plot of individual 206Pb/238U ages from Kamil Granodiorite sample JA15-08. Analyses are arranged in order of decreasing age from left to right. Dark boxes indicate grains used to produce a 206Pb/238U weighted average age (indicated by the solid black line), while the lighter boxes represent omitted grains.
Forty-nine analyses were conducted on zircons from sample JA15-09 (Fig. 6). Of these analyses 32 grains occur with 95% of concordance and yielded 206Pb/238U ages ranging over c. 897–802 Ma. A weighted average of these analyses yielded a 206Pb/238U age of 839±7 Ma with an MSWD of 3.2 (n =32), again showing that the data do not belong to a single population. Further inspection of the data in a weighted average plot (Fig. 6b) led to the exclusion of the four noticeably oldest grains, which are interpreted as inherited. The fourth oldest grain could arguably be included in further age calculations as it produces a weighted average age with P-value >0.05, although we have excluded the analysis as it would be outside the error of the age it is used to produce. The youngest two grains were excluded on the basis that they may have experienced radiogenic Pb loss. A weighted average of the remaining analyses revealed an age of 836±4 Ma with an MSWD of 1.10 and P-value of 0.33 (n = 26). This rounded age is the same as that calculated for JA15-08, and is interpreted to represent the age of crystallization of this sample.

Figure 6. (a) U–Pb concordia diagram for ≥95% concordant zircons from Kamil Granodiorite sample JA15-09 with 2σ data point error ellipses. Shaded ellipses represent grains used to produce a 206Pb/238U weighted average age, while clear ellipses indicate omitted grains. (b) Age analysis plot of individual 206Pb/238U ages from Kamil Granodiorite sample JA15-09. Analyses are arranged in order of decreasing age from left to right. Dark boxes indicate grains used to produce a 206Pb/238U weighted average age (indicated by the solid black line), while the lighter boxes represent omitted grains.
4.b.2. Ja'alan Gneiss
Zircons from sample JA15-26 (743437 m E, 2459614 m N) and JA15-36 (743707 m E, 2459687 m N) (WGS84 reference frame, UTM coordinates, zone 40N) have a brown–yellow hue, with crystal lengths ranging from c. 50 μm to 180 μm. Aspect ratios of zircon grains range from equant (1:1) to elongate prismatic (4:1). Regardless of size and shape, zircons grains in this sample generally display oscillatory zonation typical of an igneous protolith (Fig. 4). U–Pb zircon analyses were conducted on 49 zircons from JA15-26, with 43 of these analyses being ≥95% concordant (Fig. 7). The ≥95% concordant analyses have 206Pb/238U ages ranging over c. 925–720 Ma. The ≥95% concordant analyses have 206Pb/238U ages ranging over c. 925–720 Ma. From observation of the data in the presented concordia diagram (Fig. 7a), it is apparent that the two youngest analyses have been subjected to Pb loss and have been excluded from further age calculations. The five youngest remaining analyses were conducted on zircon rims, and have therefore been excluded when calculating a crystallization age. A weighted average of these five analyses yields a 206Pb/238U age of 836±10 Ma with MSWD of 0.18 and P-value of 0.95. CL imaging suggests that these rims are likely a later phase of zircon growth, which would have occurred during metamorphism. The remaining 36 concordant analyses gave a 206Pb/238U weighted average age of 887±5 Ma with an MSWD of 1.6 and P-value of 0.020, suggesting a slight over-dispersion of the data. Investigation of the remaining analyses in a weighted average plot (Fig. 7b) resulted in the three oldest grains being excluded from further age calculations. These grains are noticeably older than the remaining population and, as such, may be inherited. The remaining analyses produced an average age of 884±4 Ma with an MSWD of 0.99 and P-value of 0.49 (n = 33), which is interpreted to signify the crystallization of the igneous protolith to this sample.

Figure 7. (a) U–Pb concordia diagram for ≥95% concordant zircons from Ja'alan Gneiss sample JA15-26 with 2σ data point error ellipses. (b) Age analysis plot of individual 206Pb/238U ages from Ja'alan Gneiss sample JA15-26. Dark boxes indicate grains used to produce a 206Pb/238U weighted average age (indicated by the solid black line), which is interpreted to represent the crystallization of the igneous protolith. A possible inflection point is indicated, which may relate to Pb loss. Shading/legend as for Figure 6.
Thirty-four analyses were conducted on zircons from sample JA15-36 (Fig. 8). Twenty-three of these analyses were shown to be ≥95% concordant with ages ranging over c. 930–790 Ma. Similarly to JA15-26, the youngest six ages were obtained from zircon rims and the abrupt change in age that is again interpreted to be due to a later phase of zircon growth, and have been excluded from the calculation of the crystallization age. These six analyses yield a 206Pb/238U weighted average age of 811±20 Ma with MSWD of 2.4 and P-value of 0.032. A 206Pb/238U weighted average of the remaining 17 analyses yielded an age of 883±11 Ma with an MSWD of 2.8 (n = 23). The MSWD suggests that these data do not represent a single age. From further inspection of the data using a weighted average plot (Fig. 8b) it is interpreted that the oldest grain (c. 928 Ma) is inherited; it is therefore excluded from further age calculations. A 206Pb/238U weighted average of the remaining analyses (n = 16) reveals an age of 880±10 Ma with an MSWD of 2.3 and P-value of 0.17. Such an MSWD still suggests an over-dispersion of the data that may be due to minor unresolved lead loss; this sample has therefore been excluded from any further interpretation.
4.b.3. Al Wafi Schist monazite
In situ monazite U–Pb geochronology was undertaken on samples JA15-04, JA15-06, JA15-40 and JA15-43 from the Al Wafi Schist to constrain the age of metamorphism. Individual analyses are provided in the supplementary material. Monazite is abundant within the matrix of these samples, although commonly at sizes unsuitable for U–Pb isotopic analysis (<10 μm). However, a total of 29 analyses were obtained from unzoned grains located within the matrix. Data are displayed on Wetherill concordia plots and weighted mean plots of 206Pb/238U age (Fig. 9). All U–Pb analyses of monazite from the Al Wafi Schist are >95% concordant and reveal a large spectrum of 206Pb/238U ages (c. 905–780 Ma). A 206Pb/238U weighted average of all analyses yields an age of 839±9 Ma with an MSWD of 4.1 (n = 29). Inspection of the plotted U–Pb ages revealed a spread of ages, indicating that the older and younger analyses are slightly discordant. Using the 207Pb/206Pb ages obtained from the analysed grains yields a weighted average age of 834±12 Ma, with an MSWD of 1.04 and P-value of 0.41 (n = 29), which is within error of the zircon rim ages obtained from the Ja'alan Gneiss samples. The ability to calculate a coherent age from the obtained 207Pb/206Pb ages, and not the obtained 206Pb/238U ages, indicates there is a U/Pb calibration uncertainty not included in the presented analytical errors. Because of this, the obtained 207Pb/206Pb weighted average age is interpreted to best signify the time at which the Al Wafi Schist experienced near-peak metamorphic conditions.

Figure 9. (a) U–Pb concordia diagram for ≥95% concordant monazite grains from Al Wafi Schist samples JA15-04, JA15-06, JA15-40, JA15-43 with 2σ data point error ellipses. Shaded ellipses represent grains used to produce 206Pb/238U and 207Pb/206Pb weighted average ages. (b) Weighted average plot of individual 206Pb/238U (dark grey) and 207Pb/206Pb (light grey) ages from Al Wafi Schist samples. All analyses have been used to produce a 207Pb/206Pb weighted average age, which is indicated by the solid black line.
4.c. Zircon Lu–Hf isotopes
The Lu–Hf isotope system enables assessment of the chemical differentiation of the silicate Earth (crust and mantle), as fractionation of Lu from Hf effectively occurs during mantle melting (Hawkesworth & Kemp, Reference Hawkesworth and Kemp2006). Zircon effectively preserves the initial 176Hf/177Hf ratio of the magma from which it formed, providing a persistent record of the Hf isotopic composition of the source environment at the time of crystallization (Payne et al. Reference Payne, McInerney, Barovich, Kirkland, Pearson and Hand2016). Hafnium isotope analyses were obtained for select igneous and metaigneous lithologies found in Jebel Ja'alan, specifically the Ja'alan Granite, Kamil Granodiorite and Ja'alan Gneiss. Data are plotted on εHf v. time plots (Fig. 10); individual analyses are available in the supplementary material.

Figure 10. εHf versus 206Pb/238U age plot for igneous lithologies from Jebel Ja'alan. The depleted mantle line of Griffin et al. (Reference Griffin, Wang, Jackson, Pearson, O'Reilly, Xu and Zhou2002) is plotted, as is the new crust line obtained by Dhuime, Hawkesworth & Cawood (Reference Dhuime, Hawkesworth and Cawood2011). Weighted εHf values are given at the interpreted U–Pb crystallization age for each lithology. Errors for age and εHf values are shown at the 2σ level. The c. 840–820 Ma age range obtained by Whitehouse, Pease & Al Khirbash (Reference Whitehouse, Pease and Al Khirbash2016) is used for the Ja'alan Granite. The plot shows a general trend that suggests all samples are becoming more evolved with time. JG – Ja'alan Granite; KG – Kamil Granodiorite; JGS – Ja'alan Gneiss.
4.c.1. Ja'alan Granite
Nineteen zircons from the Ja'alan Granite (O14-37 and JA15-33) were analysed for hafnium isotopes. Seventeen of the spots returned εHf values ranging between +2.30 and +10.17, suggesting relatively juvenile sources with relatively low crustal involvement.
4.c.2. Kamil Granodiorite
Twenty-nine zircons from the Kamil Granodiorite (JA15-08 and JA15-09) were also analysed for hafnium isotopes. The εHf values obtained from this lithology range from +4.3 to +10, again suggesting a juvenile source. A single analysis value of –0.8 was obtained for this lithology.
4.c.3. Ja'alan Gneiss
Thirty-one zircons from the Ja'alan Gneiss (JA15-26 and JA15-36) were used for hafnium analysis. The zircons displayed εHf values between +7.6 and +13.3, which indicates these grains were formed in a juvenile melt with minor involvement of older crust.
4.d. 40Ar/39Ar geochronology
40Ar/39Ar data were obtained from muscovite grains separated from the Ja'alan Granite and Al Wafi Schist (Fig. 11). The Ja'alan Granite sample, JA15-03, yielded a weighted average plateau age of 831±15 Ma with a MSWD of 0.30, P-value of 0.89 and 100% of 39Ar released. The Al Wafi Schist sample (JA15-04) displays two plateau ages of 831±7 Ma and 827±15 Ma, with a combined weighted average plateau age of 830±6 Ma (MSWD 0.22; P-value 0.99). These data suggest that the granite and country rocks had cooled below the muscovite closure temperature of c. 350–405°C (Hodges, Reference Hodges1991; Hames & Bowring, Reference Hames and Bowring1994; Harrison et al. Reference Harrison, Célérier, Aikman, Hermann and Heizler2009) by this time.
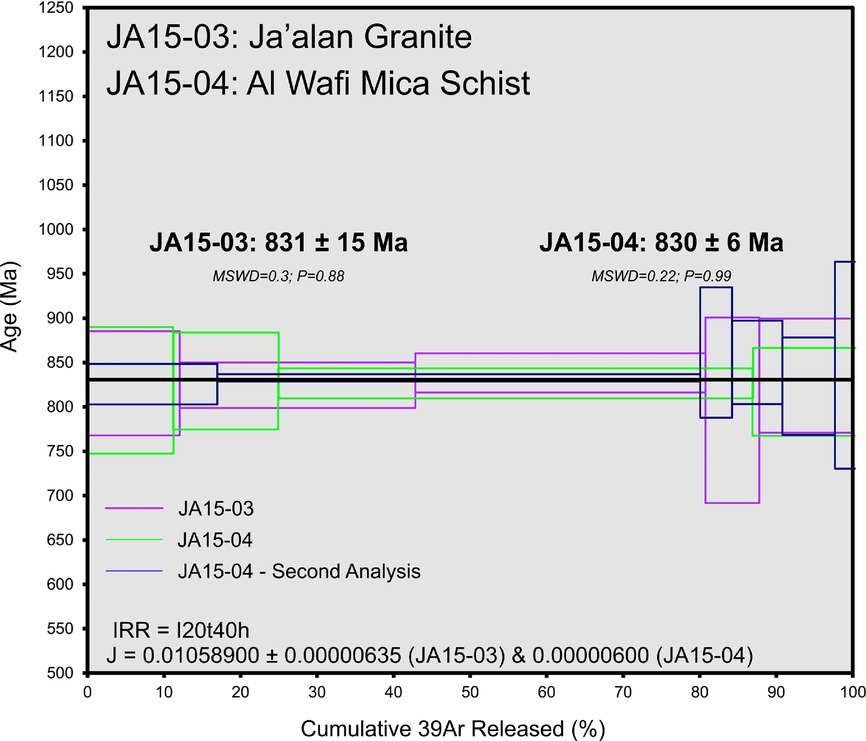
Figure 11. 40Ar/39Ar muscovite age data plot for Ja'alan Granite sample JA15-03 and Al Wafi Schist sample JA15-04. The Ja'alan Granite (pink) sample displays a weighted average plateau age of 831±15 Ma (MSWD 0.30). The Al Wafi Schist (green and blue) sample displays a weighted plateau age of 830±6 Ma (MSWD 0.22).
4.e. Sm–Nd radiogenic isotopes
Five samples were selected for Sm–Nd isotope analysis. These five samples represent the dominant igneous lithologies encountered in southern Jebel Ja'alan: Ja'alan Granite; ‘Grey Dolerite’; andesite; ‘Brown Dolerite’; and hornblendite. All five samples yielded positive εNd values between +0.56 and +6.78, plotting between the depleted mantle (DM) and chondrite universal reservoir (CHUR) values demonstrating the juvenile nature (Fig. 12). The isotopic evolution of JA15-18 (Ja'alan Granite) is plotted on Figure 12, showing the depleted mantle model age of c. 1291 Ma and a εNd (t = 0) value of –8.23. The DM model ages for samples from the other lithologies are all Mesoproterozoic in age and older than the Ja'alan Granite model age, despite field relationships clearly indicating that they were emplaced after the granite. Most notably, the latest intrusion (JA15-42) has the oldest model age (c. 1663 Ma), suggesting an increase in crustal contamination in parent magma with time.

Figure 12. εNd versus time plot showing samples JA15-14 (Grey dolerite), JA15-18 (Ja'alan Granite), JA15-25 (hornblendite), JA15-34 (andesite), JA15-42 (Brown dolerite). Evolution lines for each sample are represented by the dashed lines. The depleted mantle line shown is that obtained by Goldstein, O'nions & Hamilton (Reference Goldstein, O'nions and Hamilton1984).
4.f. Trace-element geochemistry
Trace elements were analysed for two samples of Kamil Granodiorite (JA15-08 and JA15-09) and a single sample of Ja'alan Granite (JA15-03). Figure 13 is a rare Earth element (REE) spider plot that shows how enriched or depleted in REEs each sample is when compared to primitive mantle (Sun & McDonough, Reference Sun, McDonough, Saunders and Norry1989). The REE spider plot demonstrates that the Ja'alan Granite and Kamil Granodiorite are enriched in the light REEs with a general decrease in elemental abundance with increasing atomic weight. All three samples show distinct negative Nb, Ta and Ti anomalies relative to primitive mantle, in addition to positive Pb anomalies relative to primitive mantle.

Figure 13. Rare Earth element (REE) spider plot for samples from the Ja'alan Granite (JA15-03) Kamil Granodiorite (JA15-08 and JA15-09) normalized to primitive mantle (Sun & McDonough, Reference Sun, McDonough, Saunders and Norry1989). All samples display a general decrease in elemental abundance with increasing atomic weight, in addition to distinct negative Nb, Ta and Ti anomalies as well a positive Pb anomaly.
4.g. Petrography
Samples from the metapelitic Al Wafi Schist (JA15-04, JA15-43) were used for phase equilibria modelling; as such, a detailed petrographic analysis was undertaken for this lithology. Results of the petrographic analysis of JA15-04 can be found in the supplementary material. JA15-43 (Fig. 14) contains quartz, plagioclase, biotite, muscovite, garnet and sillimanite with minor ilmenite, magnetite and chlorite. In this sample fine-grained (0.2–0.3 mm) garnet is present with euhedral grain shape, albeit partially elongate, and contains inclusions of quartz. The matrix comprises fine (0.1–0.3 mm) anhedral quartz and subhedral plagioclase, with quartz forming the majority of the matrix. This sample has a coarse-grained (1–2 mm) matrix of quartz and plagioclase in addition to the finer-grained matrix observed for the other Al Wafi Schist samples. A fabric of relatively fine-grained muscovite can be seen to cross-cut quartz and a smaller number of plagioclase grains. In this sample a smaller fabric of biotite can also be seen to run parallel to this fabric. The biotite grains in this fabric are often separated by quartz and plagioclase grains. Sillimanite is also observed in the sample and can be seen to be loosely aligned with the biotite and muscovite fabrics; it can also be seen to be in contact with chlorite. Deformed sillimanite rosettes can also be observed throughout this sample. On the basis of grain characteristics and distribution, as well as textural relationships between minerals, the interpreted peak assemblage for this sample is quartz–plagioclase–muscovite–sillimanite–biotite–ilmenite–magnetite–garnet. Post-peak metamorphism in each sample is restricted; the separation of biotite and muscovite by fine-grained (0.1–0.3 mm) chlorite is observed within each sample, interpreted as retrograde alteration.

Figure 14. Photomicrographs of petrological relationships within Al Wafi Schist sample JA15-43, which has been used for phase equilibria modelling. (a) A strong fabric of relatively fine-grained muscovite that can be seen to cross-cut quartz grains. A smaller fabric of biotite can also be seen to run parallel to this fabric of muscovite; the biotite grains in this fabric are often separated by quartz grains. Sillimanite is also observed in the sample and can be seen to be loosely aligned with the biotite and muscovite fabrics; it can also be seen to be in contact with chlorite. Deformed sillimanite rosettes can also be observed. (b) A strong fabric defined by biotite, muscovite and sillimanite that wraps around quartz grains. Muscovite within the fabric is very fine relative to other minerals in the sample. There are also larger muscovite grains that are separated by quartz. Biotite grains can also be observed to be separated from each other by quartz grains, and also contain inclusions of quartz in some instances.
4.h. Mineral chemistry
Full microprobe analyses for silicate minerals in Al Wafi Schist samples JA15-04, JA15-41 and JA15-43 are given in the supplementary material. Compositional transects were obtained for two garnet grains in Al Wafi Schist samples JA15-41 and JA15-43. Both transects show similar patterns of decreasing Mg from core to rim of each grain, and increasing Mn from core to rim.
4.i. P–T pseudosections
Two samples of the Al Wafi Schist (JA15-04 and JA15-43) were used for phase diagram calculations. T–M O and T–M H2O diagrams were calculated to constrain the amount of FeO v. Fe2O3 and H2O present in each sample prior to pressure–temperature (P–T) modelling. The associated T–M pseudosections, as well as the P–T pseudosection for sample JA15-04, are presented in the supplementary material.
The P–T pseudosection calculated for Al Wafi Schist sample JA15-43 is presented in Figure 15. The staurolite stability field is ‘V’-shaped and is stable above c. 2.5 kbar, with the stable temperature range increasing with pressure. Garnet is stable throughout much of the diagram for this sample, with stability generally increasing with decreasing temperature. The interpreted peak mineral assemblage quartz–plagioclase–muscovite–sillimanite–biotite–ilmenite–magnetite–garnet for JA15-43 is stable within the P–T range of c. 3.2–7.6 kbar at 580–700°C.

Figure 15. Calculated P–T pseudosection for sample JA15-43 from the Al Wafi Schist. The bulk composition used for modelling is given in the top of the diagram and expressed as mole percent. The field muscovite–biotite–ilmenite–plagioclase–magnetite–sillimanite–garnet–quartz–H2O (shown with bold outline) corresponds to the peak assemblage and occurs within the P–T range of c. 3.2–7.6 kbar at 580–700°C. Interpreted prograde and retrograde P–T paths are shown by the grey arrows. Dashed lines represent compositional variable contours of muscovite (yellow – y(mu) = AlVI cations) and garnet (red – x(g) =Fe2+/(Fe2+ + Mg) cations).
5. Discussion
5.a. Structural history
Two inconsistencies can be found in the structural data collected from the northern study area. First, foliation measurements of the Al Wafi Schist are dominantly NE-dipping, while the opposite holds true for the Ja'alan Gneiss. This is interpreted to represent measurements of these lithologies being taken on opposing limbs of E–W-trending folds in the area, suggesting that near-horizontal planes have been measured in close proximity to a fold hinge. The second discrepancy is the c. 35° variation between aggregate mineral lineations and calculated fold hinges. We interpret that this may be the result of shearing that has occurred prior to the folding of both units. Restoring these measurements to pre-folding values gives an approximate trend of 55→115 for plunge and plunge direction.
The structures observed in the study area are indicative of multiple regional-scale deformation events affecting the region, interpreted to occur both during and post metamorphism. Aggregate mineral lineations observed in the Al Wafi Schist and Ja'alan Gneiss are interpreted to have originally formed as a result of shearing that occurred prior to these main deformation events. The first deformation event (D1) involved the top-to-the-NNE thrusting of the Ja'alan Gneiss over the Al Wafi Schist, the creation of approximately E–W-trending folds (F1; Fig. 3), and the generation of the foliation planes (S1) observed within the study area (Fig. 3). Both field and petrographic observations are suggestive of this deformation occurring at high temperatures; this event is therefore interpreted to be contemporaneous with or slightly postdating peak metamorphism (c. 835 Ma). The second deformation event (D2) resulted in a series of structures interpreted to have formed within an E–W compressional stress regime. It is during this period of deformation that top-to-the-east thrusting of the Al Wafi Schist over the Ja'alan Gneiss is interpreted to have occurred. This is in addition to the creation of the two broad, approximately N–S-trending folds (F2) and a heterogeneously developed crenulation cleavage (S2) observed to the north of the study area. The timing of this second deformational period is difficult to constrain; however, Filbrandt, Nolan & Ries (Reference Filbrandt, Nolan, Ries, Robertson, Searle and Reis1990) observe E–W compressional structures within the overlying Simsima Formation, which would constrain the age of deformation to being younger than Maastrichtian.
5.b. Age and tectonic environment of formation of Jebel Ja'alan basement
5.b.1. Early intrusives
U–Pb zircon data were recently obtained for the Ja'alan Granite Batholith by Whitehouse, Pease & Al Khirbash (Reference Whitehouse, Pease and Al Khirbash2016); these authors constrained crystallization of the batholith to 840–825 Ma. Zircons from the Ja'alan Granite gave positive εHf values between +2.30 and +10.17, indicating that the batholith originates from a juvenile mantle source with only limited crustal input. The single sample (JA15-18) analysed for Sm–Nd also returned a positive εNd value of +1.72. The whole-rock Nd data yield more evolved values than the single zircon grain Hf values, which is indicated by the different model ages. The Hf depleted mantle model ages ranged between 990 Ma and 1220 Ma with an average of 1130 Ma, whereas the Nd model age yielded an older age of 1291 Ma. We suggest that this is due to assimilation of country rock in an evolving magma. Zircon, forming early in the cooling history, is preserving more juvenile isotopic values (i.e. younger ‘model’ ages) than the bulk rock that has been affected by post-zircon crystallization assimilation/mixing of more country rock. This later contamination is reflected in the older whole-rock Nd model age and may explain the apparent discrepancy between the two isotopic/sample systems.
U–Pb data from Kamil Granodiorite samples JA15-08 and JA15-09 both yielded rounded ages of 836±4 Ma. This age is interpreted as the age of crystallization for the Kamil Granodiorite, which falls within the suggested timing of metamorphism for the Al Wafi Schist and Ja'alan Gneiss as well as the age of emplacement and crystallization of the Ja'alan Granite. Due to its coarse texture and relative lack of deformation (Fig. 2), we interpret that the Kamil Granodiorite intruded towards the end of the tectono-metamorphic event. εHf values obtained for grains from the Kamil Granodiorite (+4.3 to +10) suggest a juvenile origin with limited crustal input for this lithology.
Ja'alan Gneiss sample JA15-26 yielded zircon 206Pb/238U average ages of 884±4 Ma, which is interpreted to represent the crystallization age of the igneous, likely granitic, protolith to the Ja'alan Gneiss. This crystallization age is younger, but in broad agreement with that obtained by Whitehouse, Pease & Al Khirbash (Reference Whitehouse, Pease and Al Khirbash2016; 900–880 Ma). The younger age obtained in this study may be a result of Pb loss during a rim growth event. A possible inflection is observable in the weighted average plot presented for sample JA15-26 (Fig. 7b), which could reflect Pb loss. A similar feature is observable for sample JA15-36 (Fig. 8b). Excluding the analyses to the left of this inflection in sample JA15-26 yields a weighted average age of 892±6 Ma, with MSWD of 0.34 and P-value of 0.997. Zircons from the Ja'alan Gneiss gave positive εHf values, ranging from +7.6 to +13.3. These values suggest that the Ja'alan Gneiss protolith formed in a juvenile melt, with any recycling of older crust being minor.
The REE multi-element plot shows that the Ja'alan Granite and Kamil Granodiorite display an overall decrease in normalized enrichment compared to the primitive mantle line with increasing atomic number. Furthermore, the samples display clear negative Nb and Ta anomalies relative to primitive mantle, in addition to positive Pb anomalies. These negative anomalies are characteristic of volcanic-arc magmas due to the low solubility of Nb and Ta in water-rich, solute-poor fluids in the shallow parts of a subduction zone (Baier, Audétat & Keppler, Reference Baier, Audétat and Keppler2008). The positive Pb anomalies also suggest a volcanic-arc origin for the analysed samples, as volcanic-arc magma sources are enriched in mantle-derived lead (Miller, Goldstein & Langmuir, Reference Miller, Goldstein and Langmuir1994). We therefore interpret that the basement of Jebel Ja'alan formed in a juvenile arc environment.
5.b.2. Dyke swarm
Three separate lithologies comprise the dyke swarm observed in Jebel Ja'alan: the early ‘Grey Dolerite’; andesite; and the late ‘Brown Dolerite’. Each dyke lithology is temporally distinct as is demonstrated by the clear cross-cutting relationships observed in outcrops. The εNd values of the dykes were all positive and plotted between the depleted mantle and CHUR line (Fig. 12). This suggests that the dyke swarm has a juvenile mantle origin, similar to the juvenile mantle origin of the Ja'alan Granite. With decreasing relative age the separate dyke generations decrease in juvenility, where the ‘Grey Dolerite’ is the most juvenile (εNd = +6.78), followed by the andesite (+4.32) and then the ‘Brown Dolerite’ as the most isotopically evolved (+0.56). The depleted mantle model ages for all generations were derived from Sm–Nd data and are older than the DM model age of the Ja'alan Granite. From field observations these model ages do not simply fit the cross-cutting relationships, as it is expected that the model ages would decrease in age from the Ja'alan Granite to ‘Brown Dolerite’ if the magma reflected consistent mantle input over time. This apparent discrepancy could be due to the higher 147Sm/144Nd ratios recorded by the dykes, which result in the dykes having shallow angle intercepts with the DM line (Fig. 12). These shallow intercepts, in conjunction with uncertainties in the model curve, may be the reason why the granite has the youngest model age. If however real, the isotopic change could be due to increased continental material contaminating the mantle wedge over time from the lower plate. Elburg & Foden (Reference Elburg and Foden1998) provided evidence from Sulawesi, Indonesia that 143Nd/144Nd variations can show a changing magma evolution due to variation in the magma source (i.e. mantle wedge and subducting slab). This suite of Nd data indicates that the model ages may have been distorted by the progressive assimilation of older sediment off the subducting slab into the mantle wedge, significantly contaminating the lithospheric mantle beneath the Ja'alan arc terrane. The decreasing juvenility in the dyke generations supports this idea of progressive sediment/crustal contamination in the mantle wedge that was tapped by the suite of dykes. An alternative reason for these model ages is that the dykes melted and progressively assimilated more basement schist and gneiss with time (e.g. Pandey et al. Reference Pandey, Gupta, Sarma and Sastry1997); we suggest that this is a less likely scenario, however.
5.c. P–T–t path of metamorphism
Mineralogical and textural features, as well as compositional variations in muscovite and garnet provide constraints on the metamorphic history of basement rocks in Jebel Ja'alan. The pseudosection (Fig. 15) was contoured for the composition of garnet (x(g) = Fe/(Fe + Mg) cations) and muscovite (y(mu) = AlVI cations). In sample JA15-43, the measured composition of muscovite grains is inconsistent with that calculated for the interpreted peak assemblage field (being greater than any value calculated for that field), but suggest peak conditions are located in the higher-temperature portion of the peak field, likely 650–700°C at 4–7.5 kbar. The discrepancy between the measured and calculated compositions of muscovite grains within this sample may be a result of ferric iron present in analysed grains that cannot be accounted for by cation calculation procedures. Ferric iron will cause EPMA measured y(mu) values to increase (e.g. Diener & Powell, Reference Diener and Powell2010). Measured compositions of garnet in sample JA15-43 show decreasing Mg from the core to rim of grains, and increasing Mn from core to rim. These patterns have been previously suggested by Tuccillo, Essene & Van Der Pluijm (Reference Tuccillo, Essene and Van Der Pluijm1990) to represent a diffusional retrograde effect, where resorption of garnet to form biotite enriches garnet in Fe relative to Mg. Additionally, as Mn does not easily incorporate into biotite, this forms an enrichment of Mn on the garnet rim. These variations in mineral chemistry are reflected in the measured x(g) (= Fe2+/(Fe2+ + Mg) cations) values, and are able to be correlated with the calculated x(g) values for sample JA15-43 to constrain the retrograde P–T conditions and path trajectory. The trajectory of the retrograde path is further constrained by the absence of retrograde staurolite and epidote in the sample, suggesting that retrograde P–T conditions were not amenable to the growth of these minerals. The EPMA measured x(g) values, when compared to the calculated values, suggest that the sample decreased to 510–540°C and 2–2.6 kbar after peak metamorphism, which is corroborated by the presence of chlorite in the retrograde assemblage. A prograde path is difficult to interpret for this sample but, based on similarities to samples JA15-04 and JA15-06, a trajectory passing through the staurolite stability field may be possible due to the presence of this mineral in the peak assemblages of these samples.
U–Pb age data from matrix monazite grains from three Al Wafi Schist samples preserve a 207Pb/206Pb weighted mean age of 834±12 Ma with an MSWD of 1.04. This age is interpreted to reflect near-peak metamorphism, as monazite has been shown to grow in metapelites from c. 525°C (e.g. Wing, Ferry & Harrison, Reference Wing, Ferry and Harrison2003; Corrie & Kohn, Reference Corrie and Kohn2008), remaining closed to lead loss at or above sillimanite stability (Smith & Barreiro, Reference Smith and Barreiro1990). 40Ar/39Ar age data from muscovite grains located within the Al Wafi Schist yield a plateau age of 830±6 Ma. Hodges (Reference Hodges1991) and Hames & Bowring (Reference Hames and Bowring1994) argue that plateau ages from high-temperature rocks represent a closure temperature of c. 350°C in muscovite grains; more recently however, the closure temperature has been suggested by Harrison et al. (Reference Harrison, Célérier, Aikman, Hermann and Heizler2009) to be within a range of c. 350–405°C, still considerably cooler than peak temperatures experienced by the schist (c. 650–700°C). It is interpreted that since the muscovite 40Ar/39Ar age is within error of the calculated 206Pb/238U weighted average monazite age cooling and exhumation likely occurred relatively rapidly, cooling by c. 300±50°C within 0–22 Ma. Muscovite grains obtained from the Ja'alan Granite yielded a similar age of 831±15 Ma, suggesting that the timing of cooling obtained for the Al Wafi Schist was coeval with cooling of the Ja'alan Granite.
The interpreted P–T path, constrained via linking the measured compositions of minerals to calculated phase compositions as well as via petrographic observations related to mineral stability fields, suggests a clockwise P–T path for rocks in Jebel Ja'alan. The P–T conditions correspond to a Barrovian apparent thermal gradient (e.g. Stüwe, Reference Stüwe2007; Kelsey & Hand, Reference Kelsey and Hand2015), approximately 93.3–162.5°C/kbar. Such a range in apparent thermal gradient can be consistent with what is associated with an active arc setting as shown in a variety of locations (e.g. Bard, Reference Bard1983; Zhao et al. Reference Zhao, Wilde, Cawood and Sun2001; Brown, Reference Brown2007; Abu El-Enen, Reference Abu El-Enen2011; Jarrar et al. Reference Jarrar, Theye, Yaseen, Whitehouse, Pease and Passchier2013). If the thermal gradient is indeed associated with an active arc setting, this would be consistent with the tectonic setting interpreted from the trace-element data for the Ja'alan Granite and Kamil Granodiorite.
5.d. Regional implications
In this study we document the Tonian juvenile volcanic-arc nature of the magmatic rocks of the Jebel Ja'alan basement of NE Oman. This confirms the interpretations of earlier studies in the region (Gass et al. Reference Gass, Ries, Shackleton, Smewing, Robertson, Searle and Reis1990) and also of studies from other Omani basement regions (Allen, Reference Allen2007; Bowring et al. Reference Bowring, Grotzinger, Condon, Ramezani, Newall and Allen2007; Rantakokko et al. Reference Rantakokko, Whitehouse, Pease, Windley, Rollinson, Searle, Abbasi, Al-Lazki and Kindi2014). We interpret the igneous suite of Jebel Ja'alan to relate to the Tonian subduction of the Mozambique Ocean that separated Neoproterozoic India from the Neoproterozoic African continents. This tectonic setting is broadly similar to the inferred tectonic setting of many of the terranes of the ANS, which are thought to be predominantly intra-oceanic island arcs formed within the same Mozambique Ocean (Johnson & Woldehaimanot, Reference Johnson, Woldehaimanot, Yoshida, Windley and Dasgupta2003; Meert, Reference Meert2003; Collins & Pisarevsky, Reference Collins and Pisarevsky2005; Johnson et al. Reference Johnson, Andresen, Collins, Fowler, Fritz, Ghebreab, Kusky and Stern2011; Cox et al. Reference Cox, Lewis, Collins, Halverson, Jourdan, Foden, Nettle and Kattan2012; Robinson et al. Reference Robinson, Foden, Collins and Payne2014; Blades et al. Reference Blades, Collins, Foden, Payne, Xu, Alemu, Woldetinsae, Clark and Taylor2015; Robinson, Foden & Collins, Reference Robinson, Foden and Collins2015a, Reference Robinson, Foden and Collinsb). P–T paths interpreted in this study are also similar to those interpreted for ANS terranes. For example, the Al Wafi Schist shares very similar peak P–T conditions and retrograde path trajectory to those reported by Abu-Alam et al. (Reference Abu-Alam, Hassan, Stüwe, Meyer and Passchier2014) from the Baladiyah Complex, Saudi Arabia. When compared to terranes in Egypt, it can be seen that Al Wafi Schist experienced higher temperatures and lower pressures than rocks of the Central Eastern Desert terrane (Fritz et al. Reference Fritz, Dallmeyer, Wallbrecher, Loizenbauer, Hoinkes, Neumayr and Khudeir2002), which contrasts with results from the Sinai Peninsula (Abu El-Enen, Reference Abu El-Enen2011) where lower peak P–T conditions are recorded. Despite variations in peak P–T conditions, retrograde trajectories are broadly similar across these terranes; likewise, there is no large discrepancy between the thermal gradients experienced between these terranes, which suggests that similar tectonic settings are responsible for metamorphism in these regions.
Where the Omani basement and the ANS differ is in the timing and polarity of arc accretion (Figs 16, 17). Arc magmatism and accretion in Jebel Ja'alan is similar to some of the oldest arc magmatism in west Saudi Arabia (c. 850 Ma; Robinson et al. Reference Robinson, Foden, Collins and Payne2014). As one moves east in Saudi Arabia the arc magmatism and accretion-related deformation/metamorphism becomes younger until, in the Ar Rayn Terrane (the easternmost exposed terrane; Fig. 1), subduction-related magmatism is still active at c. 600 Ma (Doebrich et al. Reference Doebrich, Al-Jehani, Siddiqui, Hayes, Wooden and Johnson2007) with coeval terrane deformation and metamorphism (Johnson et al. Reference Johnson, Andresen, Collins, Fowler, Fritz, Ghebreab, Kusky and Stern2011; Cox et al. Reference Cox, Lewis, Collins, Halverson, Jourdan, Foden, Nettle and Kattan2012). To the south of the Saudi ANS in Yemen, the Al-Mukalla terrane (Fig. 1) is interpreted as a Neoproterozoic island-arc terrane in a similar tectonic position to the Ar Rayn Terrane of Saudi Arabia (Whitehouse et al. Reference Whitehouse, Windley, Stoeser, Al-Khirbash, Ba-Bttat and Haider2001; Heikal et al. Reference Heikal, Al-Khirbash, Hassan, Al-Kotbah and Al-Selwi2014; Yeshanew et al. Reference Yeshanew, Pease, Whitehouse and Al-Khirbash2015). Unfortunately no geochronological data are available for this terrane, but equivalent rocks in Somaliland (the Maydh Complex) yielded age constraints on basalts of 700–640 Ma (Sassi et al. Reference Sassi, Visona, Ferrara, Gatto, Ibrahim, Said, Tonarini, Abbate, Sagri and Sassi1993).
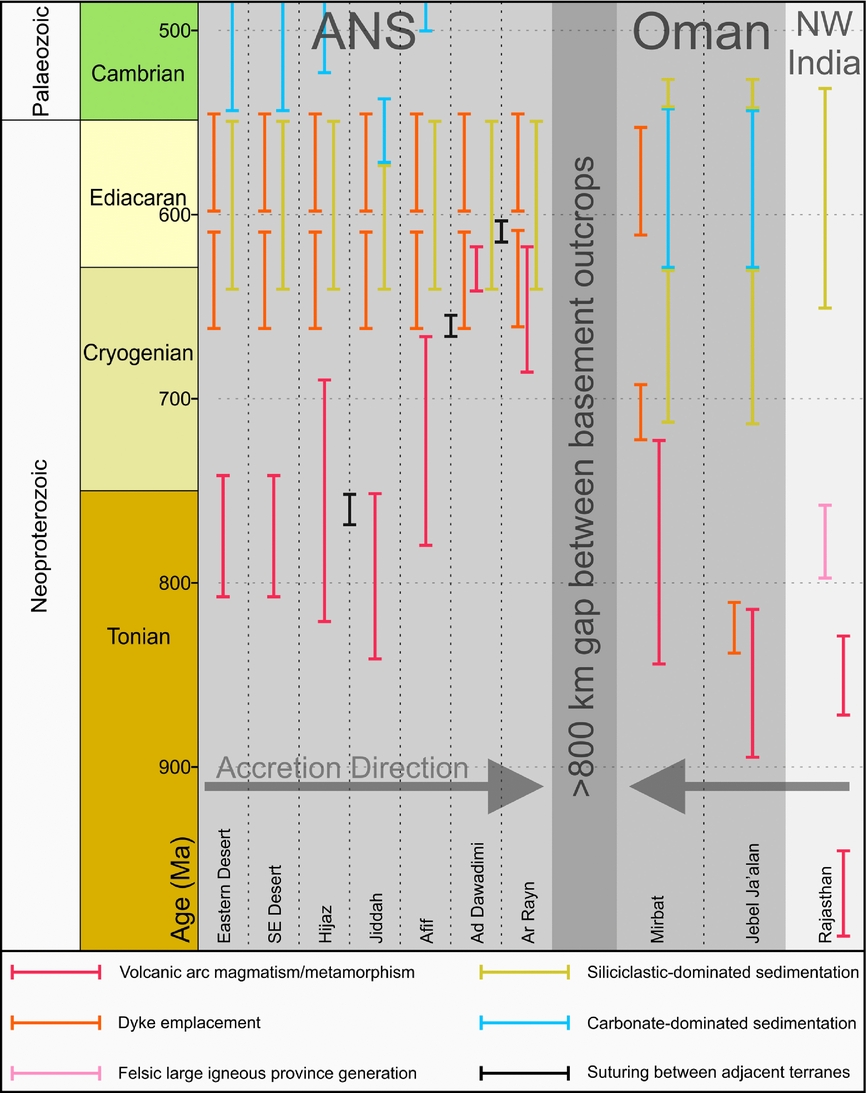
Figure 16. Time–space plot for terranes in the Arabian–Nubian Shield, Oman and NW India. The gap between the ANS and Oman signifies a >800 km gap between the closest basement outcrops. It can be observed that the timing of arc magmatism and metamorphism as well as suturing of terranes decreases to the modern day east of the ANS, reflecting progressive amalgamation of younger arc terranes. The opposite trend can be seen within NW India and the Omani basement, with ages decreasing towards the modern-day west. It can also be seen that accretion in Oman finished earlier than in the ANS, reflected in the earlier deposition of sediments. Ages displayed for the ANS are from Allen (Reference Allen2007) and Johnson et al. (Reference Johnson, Andresen, Collins, Fowler, Fritz, Ghebreab, Kusky and Stern2011); ages displayed for Oman are from Allen (Reference Allen2007), Rantakokko et al. (Reference Rantakokko, Whitehouse, Pease, Windley, Rollinson, Searle, Abbasi, Al-Lazki and Kindi2014) and this study. Ages displayed for Rajasthan are compiled from the following studies: Haldar & Deb (Reference Haldar, Deb, Deb and Goodfellow2001); Buick et al. (Reference Buick, Allen, Pandit, Rubatto and Hermann2006); Gregory et al. (Reference Gregory, Meert, Bingen, Pandit and Torsvik2009); Van Lente et al. (Reference Van Lente, Ashwal, Pandit, Bowring and Torsvik2009); Just et al. (Reference Just, Schulz, de Wall, Jourdan and Pandit2011); Cozzi, Rea & Craig (Reference Cozzi, Rea, Craig, Bhat, Craig, Thurrow, Thusu and Cozzi2012); Raza et al. (Reference Raza, Khan, Bhardwaj and Rais2012); Ashwal et al. (Reference Ashwal, Solanki, Pandit, Corfu, Hendriks, Burke and Torsvik2013); Davis, Meert & Pandit (Reference Davis, Meert and Pandit2014).
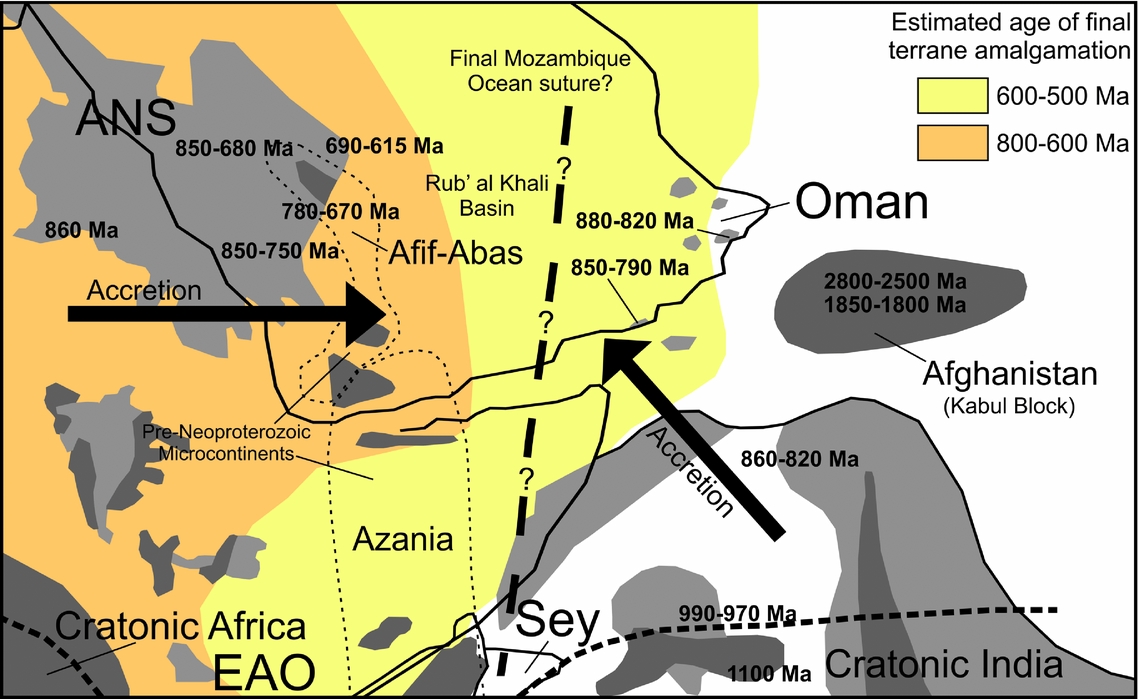
Figure 17. Geological outcrop map of the ANS, Oman and India in Gondwana adapted from Collins and Pisarevsky (Reference Collins and Pisarevsky2005). Outcrops older than 1000 Ma are shown in dark grey, while those younger are shown in light grey. Protolith ages displayed mark arc-terrane formation and accretion within the ANS, Oman and NW India. Interpreted directions of accretion are shown for the ANS and India/Oman by the black arrows. The black dashed line marks the possible final suture of the Mozambique Ocean, and is almost coincident with the boundary between structural domains two and three in figure 3 of Stern and Johnson (Reference Stern and Johnson2010). Basement ages recently obtained by Faryad et al. (Reference Faryad, Collett, Finger, Sergeev, Čopjaková and Siman2016) for the Kabul Block in Afghanistan are also displayed. These ages correlate with detrital zircon age ranges obtained by Whitehouse, Pease & Al Khirbash (Reference Whitehouse, Pease and Al Khirbash2016) for the Al Wafi Schist and may represent a possible sediment source. EAO – East African Orogen; Sey – Seychelles.
There are other basement inliers in Oman (Fig. 1), but the protoliths to the Jebel Ja'alan basement rocks are c. 50 Ma older than the oldest rock preserved in the Mirbat region of southern Oman (Fig. 1), which is the c. 835 Ma Sadh Gneiss complex (Rantakokko et al. Reference Rantakokko, Whitehouse, Pease, Windley, Rollinson, Searle, Abbasi, Al-Lazki and Kindi2014). Similar ages (c. 825–815 Ma) are also reported from the island of Socotra, which lay close to Mirbat before the opening of the Gulf of Aden (Denèle et al. Reference Denèle, Leroy, Pelleter, Pik, Talbot, Khanbarri, Hosani, Roure, Ellison and Lokier2013). The granodioritic basement found within Jebel Ja'alan (c. 840–830 Ma) is older than the granodioritic basement found in northern Huqf region (the Al-Jobah granite, 821–836 Ma; Bowring et al. Reference Bowring, Grotzinger, Condon, Ramezani, Newall and Allen2007) and from volcanic rock clasts in Jebel Akhdar (Bowring et al. Reference Bowring, Grotzinger, Condon, Ramezani, Newall and Allen2007). The age differences observed between basement inliers (Figs 16, 17) show a trend of basement becoming progressively younger westwards towards the Mirbat region, which was also suggested by Whitehouse, Pease & Al Khirbash (Reference Whitehouse, Pease and Al Khirbash2016). This younging is interpreted to reflect the progressive accretion and migration of arc terranes during Tonian time. This interpreted direction of accretion is opposite to that for terranes in the eastern ANS (Johnson & Woldehaimanot, Reference Johnson, Woldehaimanot, Yoshida, Windley and Dasgupta2003; Johnson et al. Reference Johnson, Andresen, Collins, Fowler, Fritz, Ghebreab, Kusky and Stern2011; Robinson et al. Reference Robinson, Foden, Collins and Payne2014; Robinson, Foden & Collins, Reference Robinson, Foden and Collins2015a), and would suggest that the Omani basement represents a tectono-geographic domain separate from that of the ANS.
In Gondwana Oman lay adjacent to NW India and, by Ediacaran times at least, a similar sedimentary package containing exceptional petroleum source rocks and evaporites was deposited across Rajasthan, Pakistan and through Oman (Cozzi, Rea & Craig, Reference Cozzi, Rea, Craig, Bhat, Craig, Thurrow, Thusu and Cozzi2012). These packages were being deposited in a stable, passive margin environment (Allen, Reference Allen2007) at the same time that rocks in the eastern Saudi Shield were forming at an active subduction margin (Cox et al. Reference Cox, Lewis, Collins, Halverson, Jourdan, Foden, Nettle and Kattan2012). The pre-Ediacaran basement rocks in Rajasthan and Pakistan also share similarities with those of Oman. Granitoids have been dated from Rajasthan and from Nagar Parkar in eastern Sind (Pakistan) at c. 1100 Ma (Raza et al. Reference Raza, Khan, Bhardwaj and Rais2012; Meert, Pandit & Kamenov, Reference Meert, Pandit and Kamenov2013). However, no evidence of pre-existing crust occurs west of the Western Margin Fault of the Aravalli–Delhi Orogen. Tonian granitoids and rhyolites occur in inliers through NW India and Pakistan, where they cluster into crystallization ages of c. 990–970 Ma (Haldar & Deb, Reference Haldar, Deb, Deb and Goodfellow2001; Pandit et al. Reference Pandit, Carter, Ashwal, Tucker, Torsvik, Jamtveit and Bhushan2003), c. 860–820 Ma (Davies & Crawford, Reference Davies and Crawford1971; Deb et al. Reference Deb, Thorpe, Krstic, Corfu and Davis2001; Van Lente et al. Reference Van Lente, Ashwal, Pandit, Bowring and Torsvik2009; Just et al. Reference Just, Schulz, de Wall, Jourdan and Pandit2011) and c. 775–760 Ma (Gregory et al. Reference Gregory, Meert, Bingen, Pandit and Torsvik2009; Van Lente et al. Reference Van Lente, Ashwal, Pandit, Bowring and Torsvik2009; Ashwal et al. Reference Ashwal, Solanki, Pandit, Corfu, Hendriks, Burke and Torsvik2013; Meert, Pandit & Kamenov, Reference Meert, Pandit and Kamenov2013). The latter magmatic and extrusive phase forms one of the largest felsic igneous provinces on the planet, which is also traced to the Seychelles (Torsvik et al. Reference Torsvik, Carter, Ashwal, Bhushan, Pandit and Jamtveit2001; Tucker, Ashwal & Torsvik, Reference Tucker, Ashwal and Torsvik2001), and may correlate with the northern Bemarivo Belt of Madagascar where the magmatism dates from c. 750–705 Ma (Collins, Reference Collins2006; Thomas et al. Reference Thomas, De Waele, Schofield, Goodenough, Horstwood, Tucker, Bauer, Annells, Howard and Walsh2009).
The NW margin of India is here interpreted as an extensive Stenian–Tonian (c. 1100–720 Ma) accretionary margin that extends as far as the Omani basement (Figs 16, 17). The rocks in Jebel Ja'alan form a critical part of this interpretation, linking Oman with the Indian subcontinent.
6. Conclusions
The basement of Jebel Ja'alan reveals a window into the accretionary margin of Neoproterozoic India during Tonian time. Pressure–temperature modelling indicates that the basement of Jebel Ja'alan reached peak conditions of c. 4–7.5 kbar at 650–700°C. U–Pb data obtained from Al Wafi Schist monazite suggests that these peak metamorphic conditions occurred at 834±12 Ma, with 40Ar/39Ar muscovite data suggesting rapid, exhumation-related cooling thereafter. The apparent thermal gradient calculated from the P–T modelling, in conjunction with trace-element geochemistry obtained from the Ja'alan Granite and Kamil Granodiorite, is used to interpret that the basement formed in a volcanic-arc environment. U–Pb zircon age data from igneous and meta-igneous lithologies in Jebel Ja'alan are indicative of magmatic activity during c. 890–830 Ma with subsequent emplacement of a dyke swarm consisting of three generations. Nd and Hf analyses of these same lithologies provide CHUR normalized values ranging from +0.56 to +6.78 and +2.3 to +13.3, respectively, suggesting a juvenile mantle origin with low crustal input or mixing with relatively young pre-existing crust. Depleted mantle model ages from Sm–Nd data show evolved Mesoproterozoic ages for the dyke swarm that became ‘older’ with progressively younger intrusions, suggesting that subduction-related contamination of the underlying lithospheric mantle during closure of the Mozambique Ocean.
Similarities can be drawn between the Omani basement and that of the ANS. P–T paths and related thermal gradients for terranes in Saudi Arabia and Egypt are comparable to those interpreted in this study, and timing of arc magmatism is similar for Jebel Ja'alan and the western arc terrane of Saudi Arabia. However, the geochronological data collected in this study suggests a progressive decrease in the ages of arc magmatism and metamorphism from NW India, through Jebel Ja'alan to the Huqf and Mirbat, implying arc accretion had occurred towards the modern-day west. Such a direction of accretion would indicate that Oman is not an eastwards extension of the ANS but is rather its own tectonic domain, related to NW India, Pakistan, the Seychelles and the Bemarivo Belt of north Madagascar.
Acknowledgements
This paper forms TRaX Record #366 and is a contribution to IGCP projects #628 (Gondwana Map) and #648 (Supercontinents and Global Dynamics). This project was funded by Australian Research Council Future Fellowship #FT120100340 to ASC. B. Wade and A. McFadden of Adelaide Microscopy are thanked for their help with collection of analytical data.
Supplementary material
To view supplementary material for this article, please visit https://doi.org/10.1017/S0016756817000061.


