


Introduction
Radiotherapy is an important cancer treatment approximately received by more than 40% of the patients with curative intent during the course of cancer management.Reference Spezi and Lewis 1 The success of radiotherapy depends on uniform and accurate dose delivery to the tumour while simultaneously sparing the organs at risk. This results in greater tumour control probability along with reduced normal tissue complication probability. Dose calculation models implemented in treatment planning systems (TPS) generally use radiation beam profiles measured in a water phantom.Reference Beavis, Weston and Whitton 2 However, the human body presents a number of heterogenous interfaces such as lung–tissue, bone–tissue, etc. in the path of radiation beam resulting in dose perturbations.Reference Bush, Gagne, Zavgorodni, Ansbacher and Beckham 3 The assessment of dose perturbations at such interfaces is important to gauge the outcomes of radiotherapy.
A number of photon dose calculation algorithms have been implemented in commercial TPS including correction based, convolution/superposition based and computational techniques such as Monte Carlo (MC) methods.Reference Papanikolaou and Stathakis 4 Anisotropic analytical algorithm (AAA) implemented in Varian Eclipse™ TPS (Varian Medical Systems, Inc., Palo Alto, CA, USA) is one such convolution/superposition photon dose calculation algorithm. The inhomogeneity corrections in AAA are implemented through scaling of photon and electron scatter kernels anisotropically, in accordance with the electronic density distribution of the irradiated medium.Reference Bragg, Wingate and Conway 5 It has been reported that convolution/superposition calculated dose distributions deviate from the measured values in and around heterogeneous media.Reference Ono, Endo, Tanaka, Hoshi and Hirokawa 6 – Reference Failla, Wareing, Archambault and Thompson 8 Recently, a new photon dose calculation algorithm called The Acuros XB (AXB) has been introduced by Varian which specifically aims to improve the dose calculation accuracy in heterogenous media by solving linear Boltzmann transportation equations equations.Reference Failla, Wareing, Archambault and Thompson 8
MC methods are widely regarded as the gold standard for accurate radiotherapy dose estimation.Reference Ma and Jiang 9 These methods model the primary radiation transport along with scatter in and around inhomogeneities. Various general-purpose MC codes have been used in Medical Physics. One such code is Electron Gamma Shower (EGSnrc) often employed for simulating linear accelerator (LINAC) head and subsequently performing phantom dose calculations.Reference Spezi and Lewis 1 , Reference Ma and Jiang 9 – Reference Kawrakow and Rogers 11 Several authors have compared available photon dose calculation algorithms in modelling heterogeneous interfaces during radiotherapy delivery as discussed further.
In one such study, using a lung geometry slab, the performance of four correction based algorithms and one convolution superposition algorithm [Collapsed Cone Convolution (CCC)] were compared with experimental and MC (using PENELOPE code) results. Percentage depth doses (PDDs) from 10×10 to 1×1 cm2 field sizes were obtained for 18 MV photons.Reference Carrasco, Jornet and Duch 12 The use of smaller field sizes helped in assessing the performance of the algorithm under condition of lateral scatter disequilibrium. It was observed that none of the correction based models predicted the dose accurately within lung as compared to convolution superposition and MC methods. Moreover, the correction based techniques were unable to detect the penumbral broadening in the low-density media.
In another study, it was observed that the correction based algorithms consistently underestimated the doses inside high Z heterogeneity.Reference Carrasco, Jornet and Duch 13 Furthermore, the performance of CCC algorithm in modelling the heterogeneity degraded with reducing the energy from 18 to 6 MV.
Another class of convolution/superposition algorithms uses pencil beam kernels such as the AAA algorithm.Reference Bragg and Conway 14 AAA has been tested in heterogeneous media for small fields and intensity modulated radiation therapy treatment plans by Sterpin et al.Reference Sterpin, Tomsej, De Smedt, Reynaert and Vynckier 15 The AAA results were compared with EGS4 MC code. Overall, AAA results were better than the previously reported studies in lungs using Modified Batho algorithm, however, a significant dose difference below the ribs was still observed.
Ono et al.Reference Ono, Endo, Tanaka, Hoshi and Hirokawa 6 described the accuracy of the dose calculation performed by AAA inside lung with and without bone equivalent heterogeneities. The AAA generated PPDs were compared with Monte Carlo N-Particle MC code in and around the inhomogeneities. It was concluded that MC dose calculations were more accurate as compared with the AAA in the presence of lung and bone heterogeneities.
All the studies reported so far have involved the use of open static photon beams in heterogenous media. However, to improve radiotherapy dose uniformity in patient body, metallic compensators called physical wedges or dynamic wedges using the secondary collimators are often used.Reference Khan 16 The dynamic wedges implemented on Varian LINACs are termed as enhanced dynamic wedges (EDWs).
This study aims to employ Dynamic Jaws (DYNJAWS) component module of BEAMnrc MC code in assessing dosimetric perturbations in heterogenous media during EDW deliveries and its subsequent comparison with AAA and AXB dose computation algorithms for various field sizes and wedge angles.
Material and Methods
The problem geometry
Dose perturbations have been studied in slab geometries. As shown in Figure 1, three scenarios of water–bone, lung–bone and bone–lung interfaces, respectively, were defined in consultation with the clinician and have been analysed as described further.
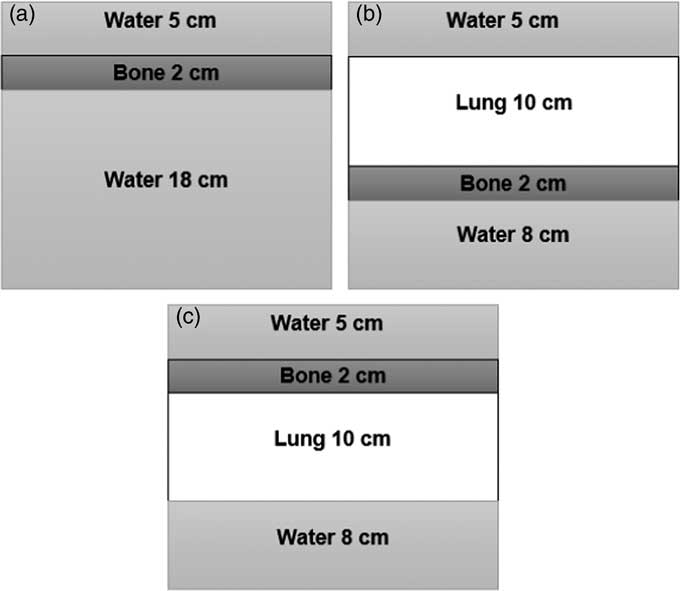
Figure 1 Three heterogenous slab phantom geometries (a) water–bone, (b) lung–bone and (c) bone–lung.
MC simulations
The MC simulations were carried out in two phases. First, a Varian Clinac 2100c linear accelerator was modelled and commissioned as per vendor specifications using BEAMnrc code.Reference Aslam, Kakakhel, Shahid, Younas and Zareen 17 , Reference Rogers, Walters and Kawrakow 18 For simulating EDWs, the DYNJAWS component module in BEAMnrc was employed. Jaw sequencing files were generated as per methodology developed by Kakakhel et al.Reference Kakakhel, Baveas, Fielding, Kairn, Kenny and Trapp 19 Incident electron beam was modelled as a Gaussian profile using source 19. Photon cut-off and electron cut-off values of 0·01 MV and 0·7 MeV were used, respectively. Phase space files were generated for three field sizes, that is, 5×5, 10×10 and 20×20 cm2 and four EDW angles of 15°, 30°, 45° and 60°.
In the second phase of the simulations, the problem geometry of Figure 1 was reproduced in DOSXYZnrc and the BEAMnrc generated resultant phase space files were used as an input in source 2. The TPS densities of materials (water: 1·000 g/cm3, lung: 0·251 g/cm3 and bone: 1·850 g/cm3) were assigned and dose to medium was calculated. Uniform phantom of dimensions was 30×30×25 cm was used for testing all the scenarios. The voxel size along the z direction was 5 mm. The nominal source to surface distance of 100 cm was used. The number of DOSXYZnrc histories were chosen such that the uncertainty in the MC results was not exceeding 1%. PDDs were scored in all phantoms for different field sizes and wedge angles as described earlier and normalised at depth of maximum dose (d max) of 1·5 cm.
TPS data acquisition and data analysis
In Eclipse® TPS (Version 10.0; Varian Medical System) the problem geometry of Figure 1 was reproduced with a 0·25 mm calculation grid size. The relative electron densities for the materials used were: water: 1·000 g/cm3, lung: 0·251 g/cm3 and bone: 1·850 g/cm3. The PDDs were calculated for 6 MV photons using AAA algorithm (rescaled dose to water) as well the AXB algorithm (dose to medium). The EDW field sizes used for MC simulation were reproduced here (except for 20×20 cm2 EDW 60 beam in case of AAA).
For assessing the results qualitative analysis has been performed using Origin 9.0 software (OriginLab, Northampton, MA, USA). While quantitative analysis has been performed using percent deviation. The following relationship was used for percent deviation calculation:
 $$\,\%\,\,{\rm Deviation {\equals} }\left[ {{{D_{{{\rm TPS}}} {\minus}D_{{{\rm EGSnrc}}} } \over {D_{{{\rm EGSnrc}}} }}} \right]{\times}100$$
Results
Only the PDD results for 30° EDW are presented in this section for the various field sizes and phantom geometries as described earlier to conserve space. Results for the remainder of the wedge angles are reported in terms of maximum percentage deviation in Table 1.
Table 1 Maximum percentage deviation between Monte Carlo (MC) and anisotropic analytical algorithm (AAA)/Acuros XB (AXB) percentage depth doses
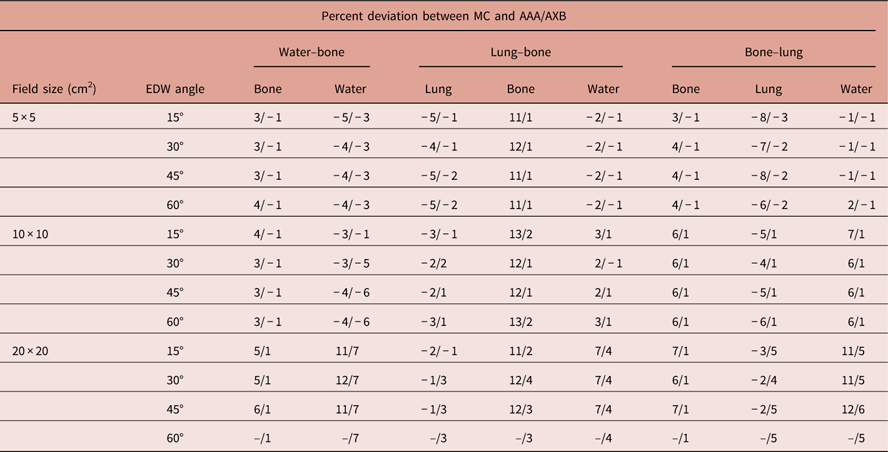
Abbreviation: EDW, enhanced dynamic wedged.
Water–bone interface
In Figure 2, MC, AAA and AXB calculated PDDs for 6 MV photons in water–bone phantom are presented for 5×5 cm2 (Figure 2a), 10×10 cm2 (Figure 2b) and 20×20 cm2 (Figure 2c). AAA and AXB results match well (within ±1%) with MC in the pre-inhomogeneity region for all field sizes (Figure 2) and wedge angles as confirmed by maximum percentage deviation results presented in Table 1.
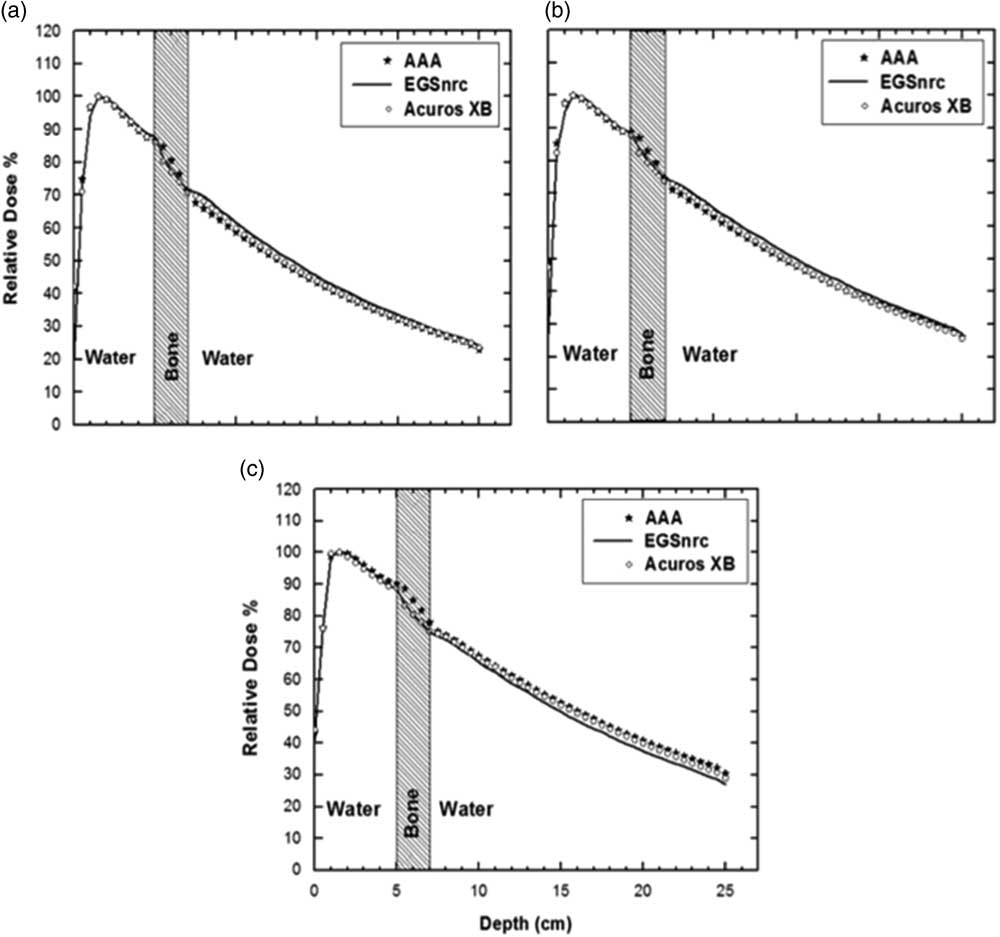
Figure 2 Water–bone phantom enhanced dynamic wedged 30 percentage depth doses for anisotropic analytical algorithm (AAA), Acuros XB (AXB) and Electron Gamma Shower (EGSnrc) (a) 5×5 cm2, (b) 10×10 cm2, (c) 20×20 cm2. The error in EGSnrc MC results was within 1%.
At the entrance side of water–bone interface (Figures 2a–2c) within the first few millimetres a dose build-up is observed for all field sizes. For the smaller field sizes (Figures 2a and 2b), this dose build-up is similar for MC and AAA/AXB. However, for 20×20 cm2, AAA predicts slightly higher (up to 6%) dose build-up whereas AXB results match more closely (within 1%) with MC. This behaviour is field size related but does not show any dependence on the EDW angle.
At the bone–water interface there is a dose rebuild up in water which is more prominent for small field sizes in the MC curves (Figures 2a and 2b) and is not accurately reproduced by AAA and AXB algorithms. In the post inhomogeneity section of the phantom for smaller field sizes the behaviour of AAA and AXB match closely, however both underestimate the dose as compared with MC (AAA: −5 to −3%, AXB: −3 to −6%), whereas for the 20×20 PDD in Figure 2c, AAA and AXB overestimate the dose by 12 and 7%, respectively, from MC.
Lung–bone interface
Figure 3 shows lung–bone interface PDDs for wedged fields. The AAA/AXB results match well with MC (within ±1%) in the pre-inhomogeneity region as evident from Figure 3 and Table 1.
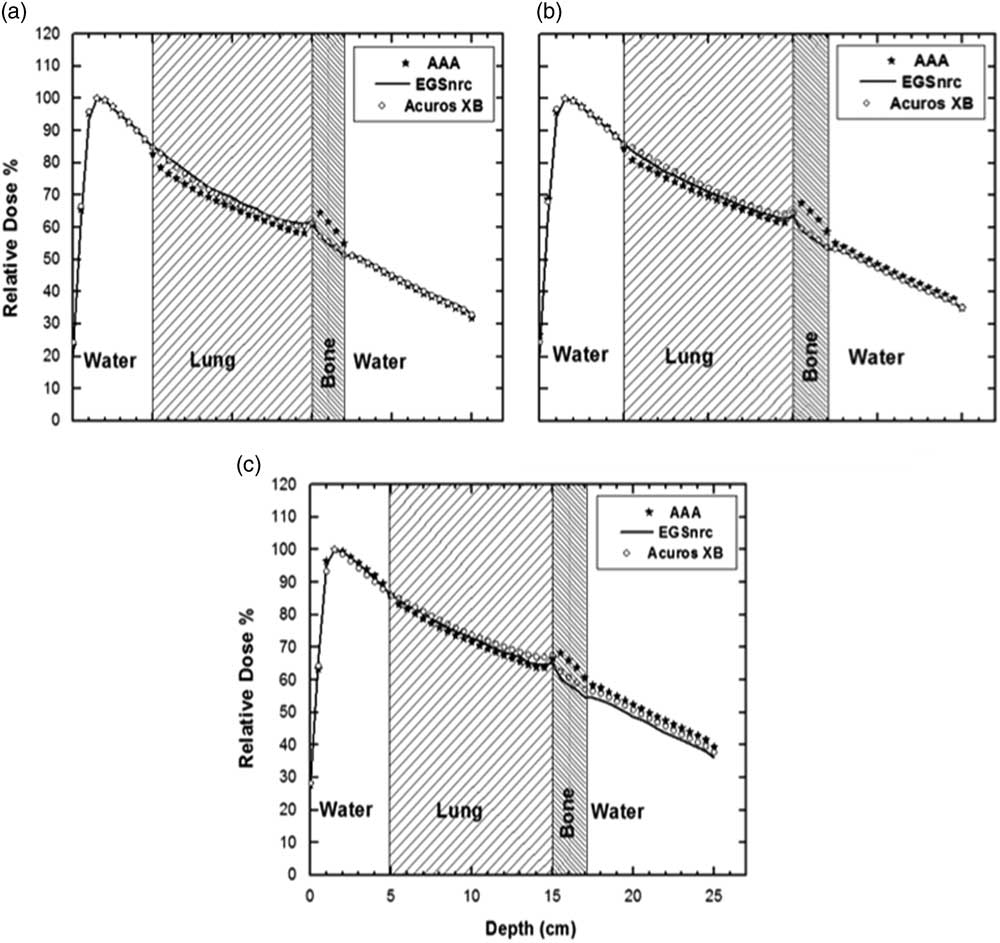
Figure 3 Lung–bone phantom enhanced dynamic wedged 30 percentage depth doses for anisotropic analytical algorithm (AAA), Acuros XB (AXB) and Electron Gamma Shower (EGSnrc) (a) 5×5 cm2, (b) 10×10 cm2, (c) 20×20 cm2. The error in EGSnrc Monte Carlo results was within 1%.
Within the lung inhomogeneity AAA algorithm systematically underestimates the dose; especially for the small field sizes (Figure 3a). A similar trend is observed for AXB in case of small field size (Figure 3a) but to a lesser extent (−5 versus −1%), however, for larger field sizes (Figures 3b and 3c) AXB slightly overestimating the dose within the lung. This shows that the behaviour inside lung is field size dependent, no clear wedge angle dependence can be inferred from this data.
A dose build-up is visible at the lung–bone interface for all field sizes and both wedged and open fields. Compared to MC PDD, this build-up and a subsequent build-down in bone are more accurately calculated by AXB as opposed to AAA (AXB: 1–4%, AAA: 11–13%). Like the bone–water phantom, here after the bone a dose build-up in the water is evident. The MC and AAA/AXB curves match well for smaller wedged as well as open field sizes in the post-heterogeneity region (AXB: −1 to 1%, AAA: −2 to 3%) but a larger mismatch exists for larger wedged field size (AXB: 4%, AAA: 8%)
Bone–lung interface
The final set of PDDs in the bone–lung phantom are shown in Figure 4 and like the previous two heterogeneous phantoms the PDDs agree well (within ±1%) in the pre-inhomogeneity region (Table 1).
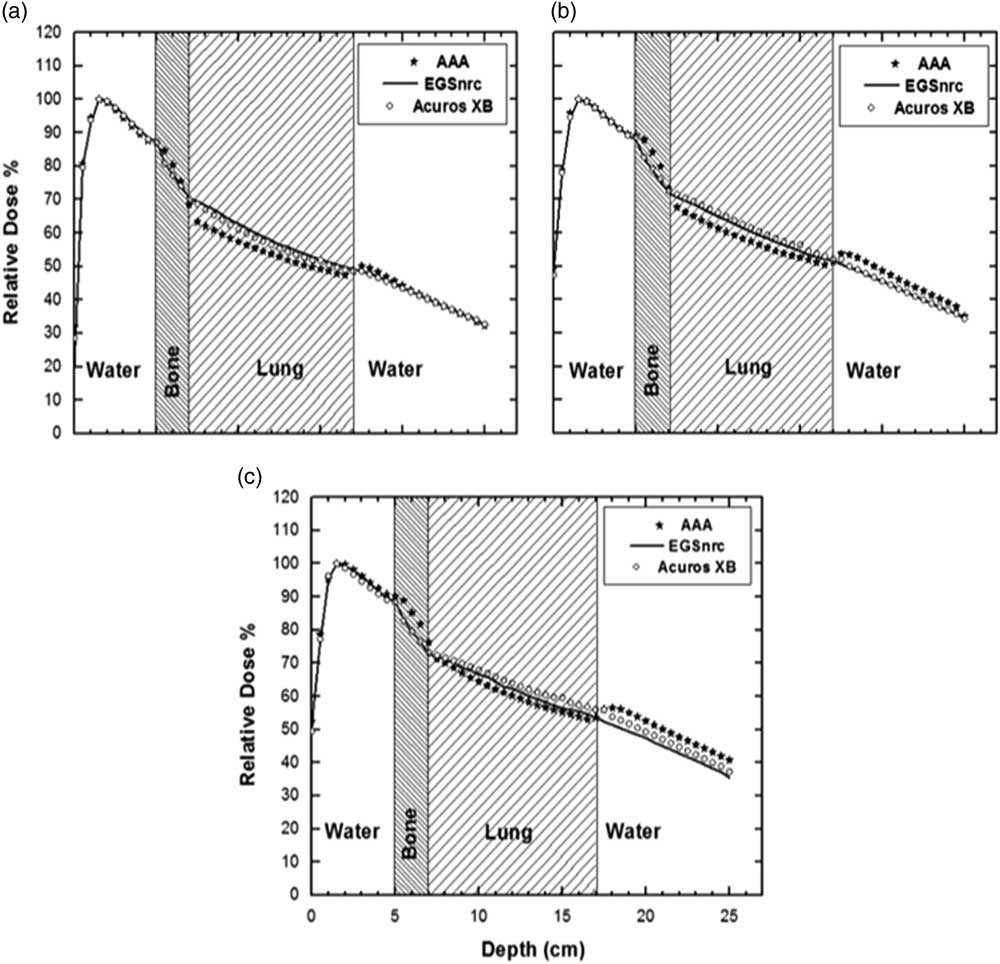
Figure 4 Bone–lung phantom enhanced dynamic wedged 30 percentage depth doses for anisotropic analytical algorithm (AAA), Acuros XB (AXB) and Electron Gamma Shower (EGSnrc) (a) 5×5 cm2, (b) 10×10 cm2, (c) 20×20 cm2. The error in EGSnrc Monte Carlo results was within 1%.
A dose build-up at the water–bone interface and build-down inside bone is seen. A build-down can be observed at bone–lung junction. Again, there is a dose build-up at the lung–water interface. This build-up and the build-down at and within bone is more accurately modelled by AXB as compared with AAA (3–6% versus ±1%)
It can also be inferred from the plots in Figure 4 that the two curves mismatch within and after the inhomogeneity. Both within the inhomogeneity of bone and lung AAA underestimate the dose as compared with EGSnrc. This underestimation is more prominent for smaller filed sizes (Figure 4a).
Also, at the exit side of the lung inhomogeneity a potential rebuild can be seen in case of AAA in water, however the magnitude of this build-up is very small for EGSnrc. After the lung within the water the dose build-up is more noticeable for AAA as compared with AXB/EGSnrc.
Discussion
At the entrance side of water–bone interface in Figure 2 the upstream dose build-up within first few millimetres is caused by electron backscatter from the high-density bone,Reference Khan 16 along with a sharp dose falloff inside the bone due to decreased transmission and increased attenuation. The mismatch between AAA and MC results at the entrance and exit side of the heterogeneity can be attributed to the differences in modelling the backscatter, rebuild-up at the bone–water interface as well as the spectral change in the beam after passing through bone. A similar rebuild-up of dose after the bone in water has been described by Carrasco et al.Reference Carrasco, Jornet and Duch 13 This is due to the decrease in the number of electrons being generated from the bone and the increase of electrons originating from the water. Since electrons that are generated from bone would have undergone a wider angle scattering in a high atomic number material and ejected from the bone in an isotropic manner resulting in a dose build-up. Also, the effect of beam spectral changes after the heterogeneity is observed as well.
Another source of discrepancy between the MC and AAA calculations is the low energy scatter increase that is incorporated by MC but not by AAA as described by Ono et al.Reference Ono, Endo, Tanaka, Hoshi and Hirokawa 6 This increased dose prediction by AAA near and around the heterogeneity is resulted by the overestimation of build-up and build-down kernel corrections for AAA. This systematic error is greater in case of larger field sizes and if there exist large density differences as can be seen in Figure 2c for 20×20 cm2 field. There is a field size dependence of the deviation; however, no clear EDW angle dependence can be inferred from this data. In all scenarios, the MC-AXB match is superior to the MC-AAA results; the reasons for improved matching are discussed later in this section.
Within the lung inhomogeneity the underestimation of dose by AAA, especially for the small field sizes (Figure 3a) is possibly due to the loss of electronic equilibrium. The dose build-up at the lung–bone interface, which is more prominent for AAA as compared with MC could be attributed to the backscattered electrons from the bone.Reference Ono, Endo, Tanaka, Hoshi and Hirokawa 6 Inside the bone after lung a build-down may be due to reduced side scatter from the lung and in part due to increased attenuation in bone, owing to its high density. After the bone, a dose build-up in the water is due to increased forward scatter from the bone.
The MC and AXB/AAA curves mismatch for larger field sizes in the post-heterogeneity region because of the field size dependent bone shielding effect. This discrepancy between AAA/AXB and MC may be because of the effects of attenuation and scattering close to the bone that are not fully taken into account by AAA/AXB as compared with MC as described earlier.Reference Sterpin, Tomsej, De Smedt, Reynaert and Vynckier 15
The underestimation of dose by AAA inside the lung and after the bone inhomogeneity may be clinically relevant. For example, if the tumour lies within the inhomogeneity of lung or in the immediate vicinity after the bone a higher dose needs to be delivered to compensate for the underdosage resulting in overdosage of lung. These results are similar in trend to the open beam heterogeneous PDDs however the magnitude of discrepancies varies as the spectral properties of the EDW beam differ from the open beam. Therefore, during treatment planning it is necessary to be aware of such under- and over-dosage. Both qualitatively and quantitatively the results of AXB algorithm are superior in accurately modelling the behaviour of wedged photon beams traversing the heterogenous interface.
A comparison of the lung–bone and bone–lung phantoms in Figures 3 and 4 reveals that the order of placement of inhomogeneity affects the PDD behaviour within and post inhomogeneity section of the phantom. This can be seen from the percent deviation values presented in Table 1. In case of bone as a first heterogeneity, the deviation in lung from MC results is higher for both AAA and AXB (though AXB results are closer to MC) as compared with the case where lung precedes the bone.
Similarly, for the last sections of phantoms in Figures 2 and 3, if bone is the first inhomogeneity, then the beam spectral changes results in more dose deviation between AAA/AXB and MC results (percent deviation up to 12–5% in Table 1 as compared to a maximum of 8–4% in Table 1). In all the phantoms, no clear pattern of wedge angle dependence has been observed.
The decreasing dose inside the low-density lung is because of loss of electronic equilibrium. The dose build-up at the lung–water interface is due to the loss of electronic equilibrium inside the lung. Due to the scatter of electrons from lung and reduced attenuation of the beam, more dose is deposited inside the water after lung.
The possible reasons of discrepancy between MC and TPS algorithms could be the low energy scatter increase as reported by Ono et al.Reference Ono, Endo, Tanaka, Hoshi and Hirokawa 6 These types of spectral changes introduce an uncertainty in the corrections for the build-up and build-kernels in case of AAA that results in a systematic error which can be greater for larger field sizes and when there exists significant differences in the densities.Reference Carrasco, Jornet and Duch 13
The improved results of AXB compared with AAA are because of the detailed modelling of the radiation transport utilising linear Boltzmann transport equations. In case of AXB the material of each voxel is assessed from the CT number as opposed to AAA where a 3D pencil beam Convolution/Superposition algorithm is used.Reference Failla, Wareing, Archambault and Thompson 8 The MC and AXB results are quantitatively similar to those reported in literature such as Bush et al. while comparing open beam photon deliveries in heterogenous phantoms comprising of lung and bone inserts.Reference Bush, Gagne, Zavgorodni, Ansbacher and Beckham 3 However, in this study different phantom geometries and the usage of wedged beams, were different as reported by Bush et al. The AXB results still differ from the MC calculations though to a much lesser extent than the AAA algorithm. These differences have been discussed in literature.Reference Bush, Gagne, Zavgorodni, Ansbacher and Beckham 3
Conclusion
The dose perturbation effects in inhomogeneities were found to be slightly dependent on the field size in EDW beams. The wedge angles dependence was not as obvious along the PDD. This study demonstrated the limitations of AAA dose calculation in the presence of inhomogeneities encountered during clinical radiotherapy planning. Also, the accuracy of AXB and MC dose prediction inside and around the inhomogeneities was demonstrated. The study may help radiation oncology professionals in better understanding of the interface dosimetry during practical radiotherapy planning.
Acknowledgements
The authors would like to thank Shahbaz Ahmed from Department of Physics and Applied Mathematics for helping in the MC simulations.
Conflicts of interest
All the authors declare that they have no competing interest.


