


1. INTRODUCTION
Drivers frequently employ electronic navigation systems to assist them in route-planning and route-following. Such systems typically act as ‘uncertainty minimisers’, thereby enabling effective navigation and increased mobility (King, Reference King1986; Streeter and Vitello, 1986). Indeed, research suggests that navigational uncertainty can reduce the mobility of individuals who are cautious of travel, particularly in unfamiliar environments, with such drivers reporting frustration or anxiety when they are unable to navigate effectively (Barrow, Reference Barrow1991; Burns, Reference Burns1997). The use of an electronic navigation aid can assist such drivers by automating the task of route planning and by providing navigational support and assistance throughout a journey. This has the added benefit of allowing the driver to focus on the primary, safety-critical task of driving.
However, the use of in-vehicle navigational systems is not without concerns, with literature highlighting the potential for elevated workload and distraction (Bach et al., Reference Bach, Jæger and Skov2009; Nwakacha et al., Burnett, 2013). Relying on such systems can also result in erratic behaviour, such as unexpected lane changes, sudden braking and the inappropriate use of indicators, especially where drivers are unsure of the correct route to follow and subsequently make last minute changes (Burnett, Reference Burnett2000). In addition, it has been recognised that issues with a navigational display and phrasing of wayfinding prompts can hinder the correct interpretation of navigation information (Forlizzi et al., Reference Forlizzi, Barley and Seder2010).
While a substantial corpus of vehicle navigation literature understandably focuses on distraction issues, usability and interface design (Jensen et al., Reference Jensen, Skov and Thiruravichandran2010; Kujala et al., Reference Kujala, Grahn, Mäkelä and Lasch2016; Lavie et al., Reference Lavie, Oron-Gilad and Meyer2011; Liu, Reference Liu2001), an increasing number of scholars are examining the wider, human implications of automating route planning and following. A particular area where in-vehicle navigation devices (or ‘SatNavs’) have not compared favourably to their paper map predecessors is their ability to connect the driver with the world around them (Lesghed et al., 2010). Specifically, the use of electronic navigation devices has been associated with driver disengagement from the environment (Lorimer and Lund, Reference Lorimer and Lund2003). Lorimer and Lund (Reference Lorimer and Lund2003) proffer that navigating with a SatNav that utilises simple turn-by-turn instructions supports only a reduced, fragmented understanding of a landscape, and therefore impedes an individual's cognitive map formation. As such, drivers who rely on electronic navigation devices are typically only able to demonstrate a poor reconstruction and memory of the environment through which they have travelled (Antrobus et al., Reference Antrobus, Burnett and Krehl2016; Burnett and Lee, Reference Burnett and Lee2005). Consequently, drivers may become reliant on the technology even during regular journeys or routinely navigable environments.
Burnett and Lee (Reference Burnett and Lee2005) suggest that the level of engagement with the environment during route-following is associated with the extent to which the navigation task is ‘active’ or ‘passive’. Active navigation involves the driver in route planning and utilises environmental elements within more extensive route instructions, with the aim of ensuring that the driver maintains a sense of orientation throughout the journey. In such approaches, drivers must interpret this information to identify and select a specific turn, often where there are a number of options available. Conversely, within passive navigation systems, drivers are presented with simpler instructions, typically incorporating an ego-centred direction (for example, ‘left’, ‘right’, ‘straight on’) together with proximity information regarding the adjacency to a particular action (for example, ‘next turn’, ‘second exit’). Such instructions are presented over shorter time periods (typically one or two manoeuvres ahead), and therefore require fewer mental resources to process.
Burnett and Lee (Reference Burnett and Lee2005) found that by using more active forms of navigation, people acquire spatial knowledge more readily, meaning drivers would require less exposure to the environment before they reach a point of system independence. However, the authors warn that more active forms of navigation are likely to require higher workload initially, compared to more ‘passive’ approaches, and therefore may be less popular to drivers. Nevertheless, workload purportedly drops more quickly with repeated exposure to active navigation systems, compared to drivers who are passively engaged. Even so, there is clearly scope to explore how to provide the benefits of ‘active’ engagement, while avoiding any associated increases in workload.
1.1. Driver-passenger model
One situation in which some of these benefits may already be apparent is collaborative driving, that is, situations in which a passenger is also present and consequently supports the driver in route-finding activities. In these situations, the passenger is often called upon to assist the driver in route-finding. Moreover, this often happens routinely, without a formal or specific request from the driver. The location of the passenger within the same shared vehicle space as the driver means that they are ideally suited to support the driver in the most appropriate manner – they are likely to be aware of the demands of the driving environment (particularly if they are also an experienced driver) and the driver's current navigational dilemma, and can therefore mediate the support they provide, and the method in which they deliver it. It also provides the opportunity to subsequently check the driver's understanding of any instructions and offer clarification, if and when necessary (Forlizzi et al, Reference Forlizzi, Barley and Seder2010; Perterer et al., Reference Perterer, Sundström, Meschtscherjakov, Wilfinger and Tscheligi2013; 2015).
Recognising the value of the passenger in route-finding, Perterer et al. (2015) devised a passenger-facing advanced driver navigation system. Acting as a secondary system, the authors proposed that the driver should still have access to traditional, driver-facing turn-by-turn guidance, so that they are able to navigate routes alone without passenger assistance. However, in demanding driving situations (for example, unfamiliar areas, bad weather conditions, night-time driving), the passenger was able to access a tablet device containing enhanced environmental information (such as a route overview in the form of a detailed map containing landmark information) which they could then relay to the driver, thereby assisting with the navigation task.
In addition to supporting the development of dedicated passenger-facing navigation systems, understanding the driver-passenger relationship also provides the opportunity to extract elements that could be replicated in a driver-only system. In an ethnographic observation of driver-passenger pairings, Perterer et al. (Reference Perterer, Sundström, Meschtscherjakov, Wilfinger and Tscheligi2013) revealed a number of activities performed by passengers to assist and support drivers during the course of the journey. These behaviours centred on the mediation of interactions according to the perceived demand of the driving task. For example, passengers were observed withholding or delaying interactions until driving manoeuvres, such as lane changes, had been completed. Conversely, interactions were more frequent during hazardous road conditions, such as driving on snow covered roads, where passengers repeatedly checked the well-being of the driver.
Recognising that it is not always possible, or practical for drivers to be accompanied by a passenger, a further point of interest is exploring how to provide the benefits of driver-passenger collaborative navigation in the absence of a passenger.
1.2. Natural Language Interactions (NLI)
Due to the realities and practicalities of everyday car travel, it is not always possible for drivers to be accompanied by a passenger and therefore a large proportion of journeys now see drivers travelling alone. This means that they are unable to access or make use of the contextually sensitive, interactive assistance of an in-car passenger. However, the recent proliferation and popularity of ‘intelligent’ voice-based systems in everyday applications presents an ideal opportunity to consider how such technology may be employed within the navigation task. Specifically, this would be to explore whether such technology could adopt the role of a knowledgeable, loquacious passenger to support bilateral dialogue based on the collaborative effort of both interactants to ensure mutual understanding (Buschmeier and Kopp, Reference Buschmeier and Kopp2011). Thus, it may be possible to provide the benefits of collaborative driving and navigating in the absence of a passenger, and thereby deliver ‘active’ engagement during the navigation task to improve performance and ultimately promote system independence, without increasing workload.
Evidently, such capabilities are not yet available in commercially-available speech technologies, which are often restricted to a single vocal exchange, initiated by the human interlocutor, in which a request is made and an isolated response is delivered. Nevertheless, it is possible to envisage a future scenario in which cars can have embodied highly-capable, digital assistants, communicating through the use of conversational language, as highlighted by Large et al. (Reference Large, Clark, Quandt, Burnett and Skrupchuk2017).
1.3. Overview of research
In order to inform the development of such a system, three existing, recognised navigational models were explored. These were a SatNav (‘passive’), an informed passenger and a collaborative passenger (‘active’) and from them the associated workload and performance were determined. Data collated and curated from the driver-passenger collaborations (specifically, the linguistic intercourse) was then used to develop and evaluate a ‘natural language’ navigational aid that actively engages the driver in the navigation task using bilateral conversation. Specifically, the aims of the study were to explore the relationships between driver workload and environmental engagement associated with active and passive navigation systems and to inform the development of a navigation natural language interface that adopts a long-term perspective in the development of spatial knowledge, while managing workload.
2. METHOD
Four on-road studies were conducted between February 2016 and September 2017 involving 61 experienced drivers. Participants primarily comprised employees and students at the University of Nottingham and were reimbursed for their time with a £30 shopping voucher. A prerequisite to taking part was that they had no prior knowledge of the Clifton area of Nottingham, where the study took place. Participants were also limited to taking part in only one of the four studies. All studies took place using an instrumented Ford Focus car owned by the University of Nottingham. The vehicle was fitted with forward facing cameras to capture the road view, and a camera facing the driver.
In a between-subjects design (that is, a different cohort of drivers took part in each of the four studies), participants were required to complete two experimental drives, each lasting approximately 45 minutes, staged one week apart. During the first three studies, participants were presented with navigational support in the form of either a SatNav, an informed passenger or a collaborative passenger, and were asked to follow three routes with overlapping sections. A week later, participants returned and followed the same routes with the same navigational support to explore any changes in workload, performance etc.
Following this, verbal interactions between drivers and passengers during the collaborative condition were transcribed and analysed to develop a context-aware, interactive navigational script that was subsequently delivered to drivers during the fourth study, which followed the same three routes.
The navigational script was constructed based on the dialogue between drivers and passengers which scored highly on the basis of environmental engagement measures (such as, the landmark information they contained and the structure of route information on approach to each navigational decision point). Dialogue from each of the four highest scoring transcripts were collated for each junction. Junction-specific guidance was then created based on the descriptive content (such as landmarks and environmental references) as guided by the recommendations of Denis (Reference Denis1997) and Burnett (Reference Burnett2000) and determined by a panel of experts, to formulate route guidance for each of the experimental routes, ensuring that this followed a consistent, informative structure.
The natural language system was created using a ‘Wizard-of-Oz’ approach (Kelley, Reference Kelley1984), with an actor mimicking the system and providing verbal responses dictated by the script. System responses were delivered in real-time utilising a subtle computer inflexion, honed through extensive training and practice sessions, in line with current state-of-the-art natural language speech interfaces. The actor was instructed to respond to all comments made by the driver and avoid any clinical, out-of-domain responses, such as “Sorry. I don't understand”, other than in the event of technical problems.
An overview of each of the four studies is presented below. Results are subsequently presented and discussed collectively.
2.1. Study One – SatNav
Fifteen participants (11 male, four female), with an average age of 33 years (range 22, 60), took part in study one. They were required to navigate the route by following the auditory and visual wayfinding prompts provided by a commercially available, nomadic navigation device (Garmin Nuvi 2569), installed in the test vehicle according to the manufacturer's instructions in the far-right corner of the windscreen. Participants were trained in the use of the system prior to commencing the drive, although they were not required to physically interact with the device (for example, to enter the destination) while driving.
2.2. Study Two – Informed Passenger
Fifteen participants (11 male, four female), with an average age of 32 years (range 22, 55), took part in study two. They were required to navigate by following the directions provided by an ‘Informed Passenger’, defined as somebody who was familiar with the routes, but with whom the driver had no prior relationship. To ensure consistency between participants, a researcher acted as the informed passenger and delivered navigational guidance by following a semi-structured navigational script. This actively referenced the world around them by identifying landmarks at each navigational choice point (for example, turn right after the leisure centre) and on the route – even where these were not essential to achieving accurate navigational performance. Further guidance or clarification was available if requested by the driver.
2.3. Study Three – Collaborative Passenger
Fifteen participants (10 male, five female), with an average age of 33 years (range 21, 55), took part in study three. Prospective participants were asked to sign up in pairs, whereby each partnership had an existing, close relationship and had navigated together previously (for example, work colleagues, couples, friends and siblings). Partners self-selected the roles of ‘driver’ and ‘navigator’. Prior to the study, the navigator was provided with training and familiarisation for all routes using video footage (captured from a driver's viewpoint) and supported by an audio commentary, which used the same navigational script as the ‘informed passenger’ study, including the additional ‘points of interest’ and ‘added value’ information about the surrounding area. Navigators were subsequently asked to confirm that they understood and had utilised the available training materials and were familiar with the route. During each drive, the navigator used their newly-acquired knowledge to direct the driver as they deemed fit.
2.4 Study Four – Natural Language Interface (NAV-NLI)
Sixteen participants (11 male, five female), with an average age of 29 years (range 23, 50), took part in study four. Interactions between drivers and passengers during the collaborative condition were used to develop a context-aware, interactive navigational script that was subsequently delivered to drivers using natural language. Described to participants as a “prototype natural language navigation system called NAV”, the system delivered navigational advice using a Wizard-of-Oz approach, with an actor embodying the role of system/navigator. The actor was located remotely from the vehicle and issued navigational guidance at predetermined points along the route, identified using a live-stream dash-cam. Participants were told that ‘NAV’ would provide them with spoken navigational assistance throughout their journey and could understand and respond to what they said. They were instructed to question NAV if they were unsure of route directions or if they had any questions about the environment through which they were travelling. To ensure that participants believed that the navigational guidance they were receiving originated from technology rather than a human, the actor used a prosodic syntax akin to other ‘current’ commercially-available speech systems. For example, short pauses were incorporated into instructions. Prior to commencing the drive, NAV introduced itself to participants using a predefined script detailing its features and capabilities.
2.5. Route selection
The test area was a large village and residential estate within Nottingham, UK, called Clifton. Clifton was chosen as it provided three inter-connected routes that met the following constraints, based on existing literature (Webber, Reference Webber2013):
1. All three routes should have a minimum of six decision points (defined as a navigational point or junction which presented the opportunity to change heading).
2. Each of the routes must intersect one another at three disparate points (although this was not specifically told to participants).
3. The three routes should be similar in terms of the number of salient landmarks or features.
4. The three routes should be completed within approximately 45 minutes driving time.
All three routes also incorporated a variety of different road and junction types, including roundabouts, T-junctions and side-roads, and were approximately 2.5 miles. Traffic density was controlled as much as was possible by conducting each road-trial outside of peak rush-hour traffic (between 10:00 and 16:00) and during periods when each of the experimental routes were free from any planned roadworks. The researcher accompanied participants in the vehicle and defined the start and end-point of each route. If route errors were made, the researcher redirected participants onto the correct path. The researcher also intervened to avoid any action that may put the vehicle occupants' safety at risk or meant performing an illegal manoeuvre.
2.6. Measures
Workload was measured using the Tactile Detection Task (TDT) (Engström, Reference Engström and Rupp2010), which is the cross-modal equivalent of the well-established Peripheral Detection Task (PDT) (Martens and Van Winsum, Reference Martens and Van Winsum2000). To administer the TDT test, a series of tactile stimuli are presented via a tactor attached to the participant's shoulder. Participants are required to respond to the presence of a new stimulus by triggering a button, attached to their finger, as quickly as possible. The delay between stimuli is varied subtly to ensure that participants are unable to predict stimulus presentation. Detection performance is measured by response time and success-rate (or missed responses). In a driving context, these measures represent the degree to which selective attention is affected by the demand of the primary (driving) and/or secondary task under evaluation (Diels, Reference Diels and Anderson2011). In addition, participants completed the National Aeronautical and Space Administration Task Load Index (NASA-TLX) (Hart and Staveland, Reference Hart and Staveland1988) after each drive.
Environmental knowledge was determined using a landmark and route recognition exercise - a common approach in spatial cognition and navigation literature (Galea and Kimura, Reference Galea and Kimura1993; Golledge et al., Reference Golledge, Ruggles and Pellegrino1993; Head and Isom, Reference Head and Isom2010). In the first landmark recognition test, participants were given a set of 12 images and were asked to identify those images which had appeared across the three routes and those which had not. For the second route learning test, participants were given a set of images for each of the three routes travelled, each image was a view of a junction encountered on the route. Participants were asked to put these images in the order in which they had appeared.
Finally, drivers were asked to draw a sketch map of the routes travelled, incorporating as much detail as possible to demonstrate their survey knowledge. They were specifically asked to depict any landmarks that they were aware of, specify junction types and illustrate any overlapping sections of the route, if they thought any were present (Appleyard, Reference Appleyard1970; Forbes and Burnett, Reference Forbes and Burnett2007; Rovine and Weisman, Reference Rovine and Weisman1989).
3. RESULTS
3.1. TDT
A Kruskal Wallis H test (Kruskal Wallis H test: Definition, Examples and Assumptions, 2016) indicated that there were no significant differences between the four conditions regarding the percentage of TDT stimuli missed by participants for drive one (HFootnote 1(3)=5.46, p = 0.14) and drive two (H(3)=6.24, p = 0.10) (Figure 1-left). Similarly, there were no significant differences in the response time of participants between the four conditions for both drives (Drive 1: H(3)=3.41, p = 0.33, Drive 2: H(3)=5.89, Calculated probability (p) = 0.12) (Figure 1-right).
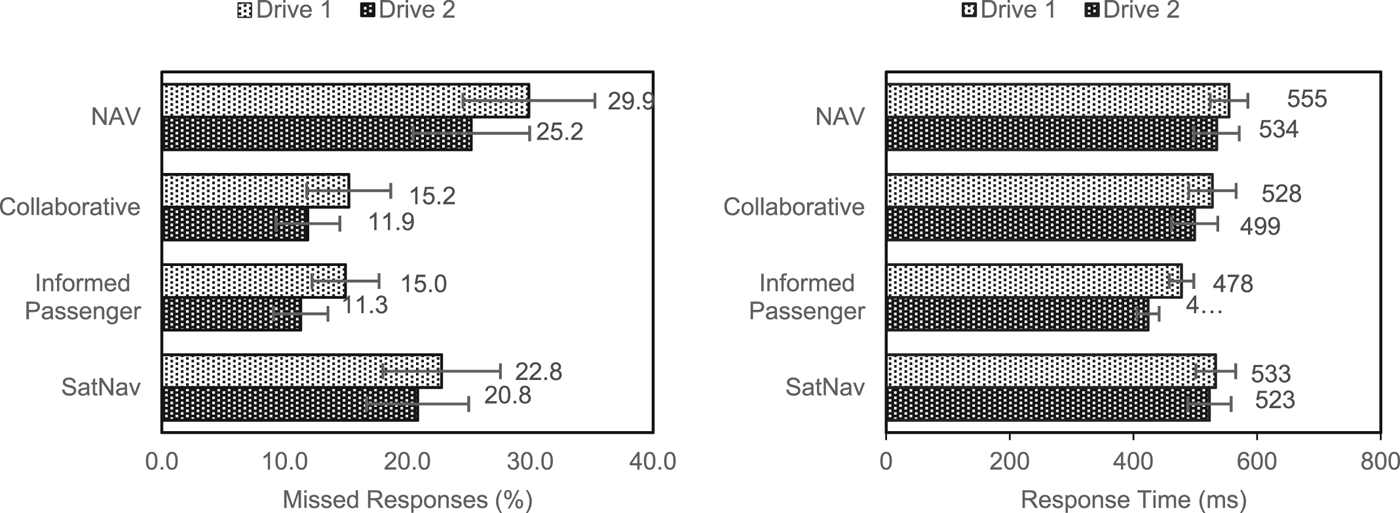
Figure 1. DT results, showing missed responses (left) and response time (right), with standard deviation error bars.
3.2. NASA-TLX
A between subjects (one way) Analysis of Variance (ANOVA) indicated that there were no significant differences in the perceived workload of participants between the four conditions during Drive 1 (D1) (FFootnote 2 (3,57) = 1.10, p = 0.36) and Drive 2 (D2) (F(3,57) = 0.54, p = 0.66) (Figure 2). However, paired-samples T tests revealed a significant drop in the perceived workload from D1 to D2 for the SatNav (D1 Mean =56.93, SD = 18.95; D2 Mean = 46.80, SD = 16.47, tFootnote 3(14) = 3.22, p = 0.01) and Collaborative Passenger (D1 Mean = 51.87, SD = 19.42; D2 Mean = 39.87, SD= 17.60, t(14) = 4.19, p < 0.001). Reductions in workload were also observed for the NAV condition, from D1 (Mean = 47.00, SD = 18.67) to D2 (Mean = 40.19, SD = 20.42), and these differences were approaching significance (t (15) = 1.99, p = 0.065).
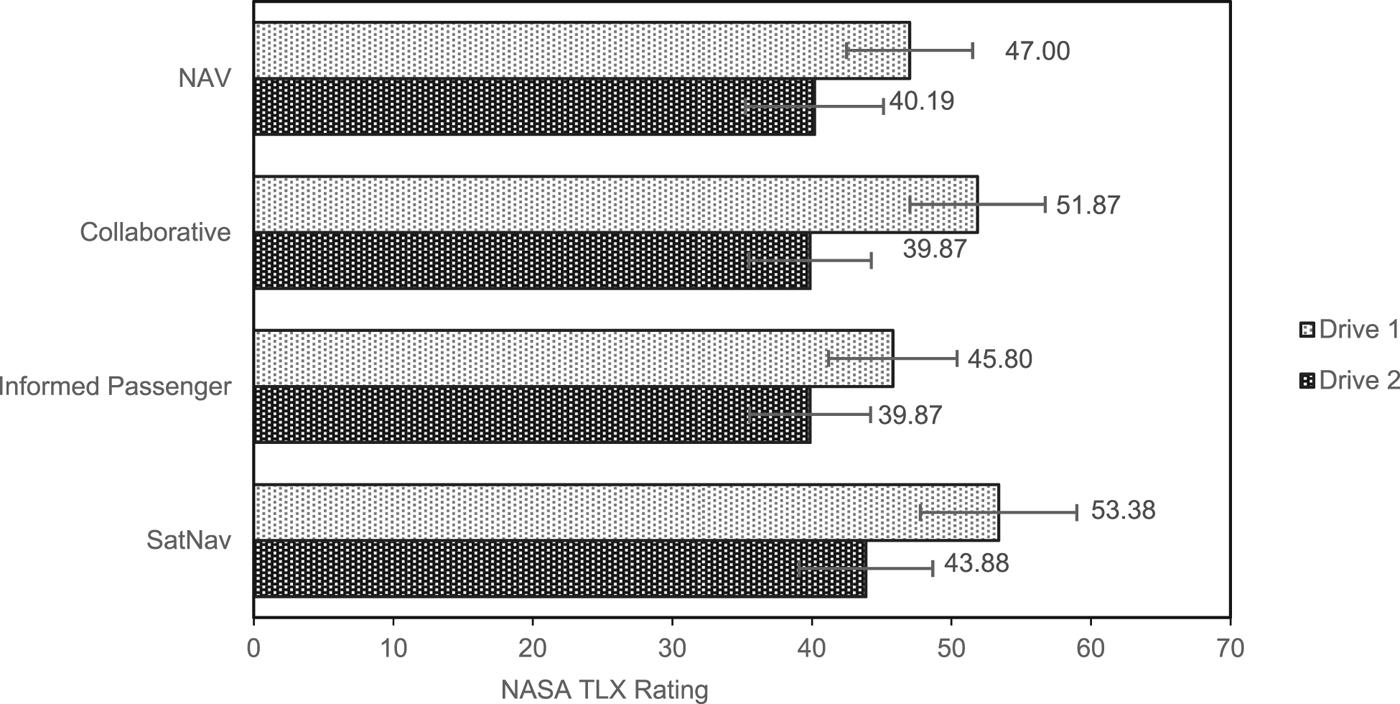
Figure 2. NASA-TLX ratings, with standard deviation error bars (max. possible value = 126).
3.3. Landmark recognition
During the landmark recognition test, participants identified images as ‘on route’ or ‘off route’. The number of incorrectly placed images were subtracted from the number of correctly placed images, yielding a ‘landmark recognition score’ for each route (Figure 3-left). A between subjects (one way) ANOVA revealed a statistically significant difference in landmark recognition between conditions, with post-hoc tests revealing that participants in the Collaborative Passenger (Mean = 0.85, SD = 0.17, p = 0.001) and NAV (Mean = 0.83, SD = 0.14, p=0.001) conditions were able to identify significantly more landmarks on route than participants who followed the wayfinding guidance of the Satnav (Mean = 0.60, SD = 0.15).

Figure 3. Environmental knowledge measures, showing landmark recognition scores (left) and route error scores (right), with standard deviation error bars.
3.4. Route learning
Participants placed images taken from each route in the order in which they believed they had appeared on the route. The position of each image was scored relative to its actual position on the route, with the number of incorrectly placed images subtracted from the number of correctly placed images, yielding an ‘absolute route error’ score for each route. To improve sensitivity, a ‘sequencing score’ was also generated. This was the number of the longest string of images which were placed sequentially without error. Total error values were then calculated by subtracting the sequencing score from the absolute route error (Figure 3-right). A between subjects (one way) ANOVA revealed a statistically significant difference in the total route error between navigational conditions (F(3,57) = 3.85 p = 0.03). Post-hoc tests revealed that participants with a collaborative passenger (Mean = 0.20, SD = 0.15) demonstrated significantly lower route error scores than those using the SatNav (Mean = 0.38, SD = 0.21).
3.5. Survey knowledge
Participants were asked to draw a sketch map of the routes travelled, adding as much detail as possible (representative examples of sketch maps are shown in Figure 4). Sketch maps were visually assessed by the experimenter based on the number of landmarks, the accuracy of landmark placement, and the number of route intersections and pathways (Forbes and Burnett, Reference Forbes and Burnett2007). To ensure consistency, a reliability check was performed, with a Cohens Kappa (Cohen, Reference Cohen1960) test indicating a high level of agreement (Cohens Kappa coefficient {k} = 0.845 (95% Confidence Interval {CI}, 0.759 to 0.931), p < 0.0005).

Figure 4. Representative examples of sketch maps for each condition.
A between subjects (one way) ANOVA revealed a statistically significant difference in the number of landmarks depicted within participants' sketch maps between navigational conditions (F(3,57) = 17.27 p =< 0.001). Post-hoc tests revealed that participants in the SatNav condition (Mean = 4.2) depicted significantly fewer landmarks than participants in the Informed Passenger (Mean = 8.4; p = 0.002), Collaborative (Mean = 9.33; p< 0.0001) and NAV (Mean = 11.81; p< 0.0001) conditions. However, there were no significant differences in the landmark orientation between SatNav, Informed Passenger, Collaborative and NAV participants, revealed by a Kruskal Wallis test (H(3) = 4.69, p = 0.20).
A Kruskal Wallis H test revealed that there was also a statistically significant difference in the number of route intersections depicted within participants sketch maps between navigational conditions (H(3) = 12.50, p = 0. 01). Subsequent post-hoc tests revealed that Collaborative participants (Median = 1, range = 0,3) depicted significantly more route intersections than SatNav (Median = 0, range = 0,2; p = 0.01) and NAV (Median = 0, range = 0,2; p = 0.04) participants.
Finally, a Kruskal Wallis H test revealed that there was a statistically significant difference in the number of pathways depicted within participants' sketch maps between navigational conditions (H(3) = 7.89, p = 0.048). Subsequent post-hoc tests revealed that informed passenger participants (Median = 4, range = 0,8) depicted significantly more pathway sections than those using the satnav (Median = 3, range = 2,5; p = 0.044).
4. DISCUSSION
This research aimed to explore the relationships between driver workload and environmental engagement associated with ‘active’ and ‘passive’ forms of navigation. Three existing recognised navigational models – a commercially-available SatNav (‘passive’), an informed passenger and a collaborative passenger (‘active’), were selected as these differed according to the content of information they relayed to the driver, and the level of interactivity they permitted. Results from excursions using each of these methods were subsequently used to inform the design of a natural language system (NAV-NLI) that adopted a long-term perspective in the development of spatial knowledge, while aiming to manage driver workload, and this was subsequently evaluated in the same environment.
It was evident that workload (revealed through both objective and subjective measures, that is, TDT and NASA-TLX) was equivalent across all conditions, with generally no significant differences revealed between conditions, and across the two drives, participants provided with the SatNav (representing a more ‘passive’ approach) tended to report higher subjective levels of workload overall. This is in contrast to the earlier findings of Burnett and Lee (Reference Burnett and Lee2005), who predicted higher initial levels of workload associated with more active forms of navigation, due to the depth of processing required in order for drivers to maintain orientation and make specific navigational decisions, particularly when presented with a number of viable options. A possible explanation is that the directions provided by the SatNav were more ‘unnatural’ in their delivery (as far as human conversational language is concerned), and participants therefore found it more difficult to parse the instructions (or, conversely, the human dialogue was easier to parse). In addition, the lack of differentiation exposed by the tactile detection task may reflect the difficulty in administering this technique while driving (even though this technique has been successfully applied in numerous simulated driving studies). For example, some drivers reported that they were aware of the tactor stimulus but in some situations were unable to acknowledge it by activating the switch, particularly when manoeuvring the vehicle.
Whilst the informed and collaborative passenger (and ultimately, the NAV-NLI) represent increasingly ‘active’ methods of navigation – providing more extensive navigational prompts peppered with environmental information – drivers did not report an associated increase in workload. This is likely to be because drivers were provided with more ‘natural’, interactive support across the entire journey, rather than specific, functional commands delivered at isolated navigational decision points. Moreover, drivers were able to question their ‘partner’ to improve their understanding of route instructions and ensure they had correctly identified the upcoming and subsequent manoeuvres. In essence, the informed and collaborative passenger (and indeed, the NAV-NLI) were able to provide drivers with an interactive, personalised experience and provide appropriate reassurance, thereby improving confidence while not necessarily impacting on workload. Moreover, the use of natural language (delivered either by the passenger or NAV), also ensured that information was easy to receive and process, factors that are also likely to minimise the disruption to workload. In contrast, instructions provided by the ‘computerised’ SatNav voice may have been difficult to parse.
It is also noteworthy that, although drivers did not perceive differences in workload between conditions, there were notable reductions from Drive 1 to Drive 2 indicated by users of the SatNav, collaborative passenger and NAV-NLI. This is likely to reflect increased route familiarity, making the navigational process less challenging during the second drive, although it is worth positing that it may also indicate increased familiarity with the experimental procedure and test vehicle, thereby influencing drivers' expectations and perceived competence/workload.
In addition, environmental engagement measures indicate enhanced landmark recognition, route learning and survey knowledge associated with the more active methods, in particular, for the collaborative passenger and NAV conditions, compared to the SatNav. Navigational instructions provided by the SatNav (representing the least ‘active’ method) commonly take the form of turn-by-turn prompts utilising distance-to-turn information, alongside directional (left, right, straight on) instructions. However, this information is issued unilaterally (from system to driver), thereby preventing interactivity and route collaboration. Moreover, the emphasis on distance descriptors diverges from how humans naturally convey spatial information to one another (Denis, Reference Denis2017). As such, it only supports the construction of a fragmented cognitive map, even though there is scope for the driver to draw additional information from the environment (such as relevant landmarks), independently from the system. Consequently, drivers using the SatNav performed relatively poorly on environmental engagement measures.
In contrast, navigational guidance provided by the informed and collaborative passenger frequently contained landmarks in place of distance-to-turn information, with familiar driver-passenger couplings commonly drawing upon previous experiences to situate route guidance. This is likely to support the formation of more comprehensive route knowledge, which was clearly evident in the environmental engagement measures. In particular, the sketch maps associated with the more ‘active’ methods of navigation were typically far more comprehensive, and populated with significantly more, accurately-placed landmarks.
Even so, it is interesting to note that drivers provided with the informed passenger questioned route guidance information less frequently than those in collaborative pairings. This is likely to reflect the level of confidence the driver placed in the navigator – the informed passenger was presented to drivers as an ‘expert navigator’ who had prior experience with the experimental routes. Thus, drivers may have placed more trust and confidence in the guidance issued to them, rendering navigational checks redundant. Alternatively, the pre-existing relationship between driver and passenger in the collaborative condition may have introduced more social dynamism into the car environment, effectively reducing the formality between driver and navigator. This may have increased the driver's willingness to engage with their passenger, for example, by commenting on environmental features and discussing, or questioning, the route guidance provided to them. It was also particularly revealing that the sketch maps constructed following the collaborative driving experiences often included landmarks that were not specifically referred to within the navigational instructions, confirming enhanced environmental engagement associated with these approaches.
It is worth noting that the analysis of the sketch maps focussed on the quantity and type of navigational elements that were included in participant's maps, rather than dimensional accuracy, in line with the approach taken during previous studies and the overall aims of the study. However, the accuracy of dimensions/distances of the overall map could also be explored (for example through Procrustes analysis (Gower, Reference Gower1975)), and this will be the subject of future work.
However, it is clearly unrealistic to expect all drivers to be accompanied by an obliging and knowledgeable passenger during all journeys, and therefore, a further aim of the research was to utilise data collected from the driver-passenger collaborations (specifically, the linguistic interactions), and use this to create a ‘natural language’ navigational aid that actively engages the driver in the navigation task, even in the absence of a passenger. This was subsequently evaluated over the same routes. Delivered using a Wizard-of-Oz approach, the NAV-NLI provided contextual, landmark-rich, wayfinding guidance through a collaborative information exchange with the driver. Route guidance was formulated by referencing roadside landmarks at navigational choice points (rather than traditional distance-to-turn information) and using these environmental features to draw attention to the external environment, thereby aiming to increase the driver's confidence in their path selection, while managing workload. This information was subsequently provided to the driver in a two-way dialogue exchange, allowing the driver to clarify their understanding, or question guidance.
Results from the evaluation demonstrate clear potential for such an approach – environmental engagement measures were enhanced, and there were no adverse effects on workload, as discussed. It is further anticipated that through the regular use of such systems, drivers may become less reliant on the system itself, particularly on repeated or regular journeys, and begin to re-establish associations between viewing an environmental feature and the related navigational manoeuvre, for example, ‘I need to turn left when I see the Fairham pub’.
Moreover, delivering navigational advice in this manner also offers the capacity to further enhance route knowledge by incorporating and communicating information from connected vehicle technologies, which could provide real-time route information to the driver, such as current or estimated traffic delays or congestion, obstructions in the road or accidents ahead, in a similar, colloquial manner.
5. CONCLUSIONS
This research demonstrates clear benefits and potential for a natural navigation system employing conversational language with landmark-rich information (in preference to distance descriptors) delivered at navigational choice points. Results show that such a system ensures that the navigation task remains ‘active’, thereby enhancing environmental engagement and supporting a long-term perspective in the development of spatial knowledge but does not demand the elevated workload traditionally expected with increased navigational activity. In addition, it offers the flexibility to tailor interactions (as a collaborative passenger might) while also providing the capacity to incorporate real-time updates, information that is less likely to be available to a passenger.


