1. INTRODUCTION
In Inertial Confinement Fusion (ICF) (Lindl, Reference Lindl1995; Reference Lindl, Amendt, Berger, Glendinning, Glenzer, Haan, Kauffman, Landen and Suter2004; Atzeni & Meyer-ter-Vehn, Reference Atzeni and Meyer-Ter-Vehn2004), a spherical target containing the deuterium-tritium thermonuclear fuel is heated and compressed to generate the ignition of the nuclear fusion reactions. In the central ignition scheme, the ignition conditions are generated in a relatively small plasma volume characterized by a plasma temperature around T ≈ 10 keV and a confinement parameter ρR of about 0.3 g/cm2 (α-particle range).
In the indirect drive (Lindl, Reference Lindl1995) approach, the fusion capsule is located within a high-Z casing. Powerful laser beams are directed into the case, where a fraction of energy is converted to X-rays, driving the capsule implosion. This scheme has been adopted by the National Ignition Facility (NIF) (Miller et al., Reference Miller, Moses and Wuest2004; Moses et al., Reference Moses, Boyd, Remington, Keane and Al-Ayat2009; Lindl et al., Reference Lindl, Landen, Edwards, Moses and Nic2014) and by the Laser MegaJoule (LMJ) (Cavailler, Reference Cavailler2005; Lion, Reference Lion2010) facility. The NIF facility is composed by 192 laser beams arranged in 48 quads and has demonstrated a total energy (power) of 2 MJ (500 TW), while the current design of the LMJ consist of 176 laser beams for a total of 44 quads (1.3 MJ, 440 TW).
Another option is offered by the direct drive scheme (Nuckolls et al., Reference Nuckolls, Wood, Thiessen and Zimmerman1972; Bodner et al., Reference Bodner, Colombant, Schmitt, Gardner, Lehmberg and Obenschain2002) where the laser beams heat directly the external shell of the ICF capsule. In both cases, the uniformity of the irradiation represents an important issue. Indeed, large non-uniformity in the irradiation would introduce inefficiency through asymmetric fuel assembly and could trigger dangerous hydrodynamic instabilities as Richtmyer-Meshkov and Rayleigh-Taylor. These instabilities can cause deleterious mixing of shell material into the fuel or could damage and even destroy the capsule during the implosion.
The illumination model (Skupsky & Lee, Reference Skupsky and Lee1983; Schmitt, Reference Schmitt1984) provides a simple way to evaluate the non-uniformity of the irradiation for a given laser-capsule configuration. The model can also include statistical analyses that take into account beam uncertainties such as power-imbalance, pointing error, and target positioning. Several studies have been performed to analyze the capsule illumination uniformity for different facilities (Murakami et al., Reference Murakami, Nishihara and Azechi1993; Reference Murakami1995; Reference Murakami, Sarukura, Azechi, Temporal and Schmitt2010; Canaud et al., Reference Canaud, Fortin, Dague and Bocher2002; Temporal et al., Reference Temporal and Canaud2009; Reference Temporal, Canaud and Le Garrec2010a; Reference Temporal, Canaud, Laffite, Le Garrec and Murakami2010b; Reference Temporal, Ramis, Canaud, Brandon, Laffite and Le Garrec2011; Reference Temporal, Canaud, Garbett and Ramis2014a; Reference Temporal, Canaud, Garbett and Ramis2014b; Temporal & Canaud, Reference Temporal and Canaud2011) In these studies, it has been assumed that the quality of the illumination (usually measured by a root-mean-square deviation of the incident intensity on a spherical surface) is representative of the non-uniformity induced in the first shock wave, also called imprint phase.
The aim of this paper is to test if this assumption is satisfied for the case of a specific two-dimensional axis-symmetric irradiation configuration defined in Section 2. Two-dimensional hydrodynamic calculations have been performed to analyze the non-uniformity of the shock front generated in a spherical plastic target (Section 3). A parametric study, varying the laser beam intensity profile and the polar direct drive (Skupsky et al., Reference Skupsky, Marozas, Craxton, Betti, Collins, Deletrez, Goncarov, Mckenty, Radha, Knauer, Marshall, Harding, Kilkenny, Meyerhofer, Sangster and Mccrory2004; Craxton et al., Reference Craxton, Marshall, Bonino, Epstein, Mckenty, Skupsky, Deletrez, Igumenshchev, Jacobs-Perkins, Knauer, Marozas, Radha and Seka2005) parameter, has been performed using both the illumination model and the hydrodynamic model. Finally, the results of the hydrodynamic calculations have been compared with the data obtained with the illumination model (Section 4). We anticipate that the results of the two models show good agreement, enabling the use of the illumination model to define the optimum laser-capsule parameters that optimize the non-uniformity of the first shock wave.
2. IRRADIATION CONFIGURATION
The LMJ facility configuration considered in this paper foresees the use of a total of 176 laser beams organized in 44 quads (3ω, 1.3 MJ, 440 TW). Four quads will be devoted to diagnostics and the other 40 quads are distributed in four cones — two per hemisphere — located at 33.2°, 146.8° (1st cone), and at 49°, 131° (2nd cone) with respect to the polar axis. The LMJ facility has been planned and optimized for the indirect drive scheme. Nevertheless, it could also be useful in order to test aspects relevant for the direct drive approach. In this context, special attention is devoted to the shock ignition scheme (Betti et al., Reference Betti, Zhou, Anderson, Perkins, Theobald and Solodov2007) that envisages the employ of two laser pulses: a first compression pulse followed by a high-power igniting pulse. One of the possibilities offered by the LMJ facility is to dedicate the 20 quads in the 2nd cone to the compression pulse and the 20 quads at the 1st cone for the ignition phase. Recently, it has been shown (Canaud et al., Reference Canaud, Brandon, Laffite and Temporal2012) that special attention has to be paid to the sphericity of fuel assembly even when using shock ignition.
This paper aims to analyze the irradiation non-uniformity provided during the first few ns that dominate the imprinting phase. The first shock is important as it is principally responsible for determining the entropy of the fuel. Moreover, the asymmetry of the shock needs to be minimized and studies performed at NIF suggest that one needs to tune the symmetry of the first and fourth shocks (Landen et al., Reference Landen, Edwards, Haan, Robey, Milovich, Spears, Weber, Clark, Lindl, Macgowan, Moses, Atherton, Amendt, Boehly, Bradley, Braun, Callahan, Celliers, Collins, Dewald, Divol, Frenje, Glenzer, Hamza, Hammel, Hicks, Hoffman, Izumi, Jones, Kilkenny, Kirkwood, Kline, Kyrala, Marinak, Meezan, Meyerhofer, Michel, Munro, Olson, Nikroo, Regan, Suter, Thomas and Wilson2011; Kyrala et al., Reference Kyrala, Seifter, Kline, Goldman, Batha and Hoffman2011). Thus, we only considered the compression pulse provided by the 20 quads (10 per hemisphere) located in the 2nd cone. In a direct drive scheme the laser pulse power is formed by a relatively low-power foot pulse followed by the main pulse that drives the fuel compression (McKenty et al., Reference Mckenty, Sangster, Alexander, Betti, Craxton, Deletrez, Elasky, Epstein, Frank, Yu. Glebov, Goncharov, Harding, Jin, Knauer, Keck, Loucks, Lund, Mccrory, Marshall, Meyerhofer, Regan, Radha, Roberts, Seka, Skupsky, Smalyuk, Soures, Thorp, Wozniak, Frenje, Li, Petrasso, Seguin, Fletcher, Paladino, Freeman, Izumi, Koch, Lerche, Moran, Phillips, Schmid and Sorce2004; Canaud et al., Reference Canaud, Garaude, Clique, Lecler, Masson, Quach and Van Der Vliet2007b; Brandon et al., Reference Brandon, Canaud, Primut, Laffite and Temporal2013). Hereafter, our analysis is restricted to the irradiation non-uniformity provided by the first few ns of the low-power foot pulse that has been schematically represented by a flat constant 2 TW power pulse.
The two-dimensional hydrodynamic calculations have been performed with the numerical code DUED (Atzeni, Reference Atzeni1987). The code deals with tabulated EOS data, 2T model, flux limited heat conduction and inverse-bremsstrahlung laser energy deposition driven by a three-dimensional ray-tracing package. In these hydrodynamic simulations, a plastic (CH) spherical target with density ρCH = 1.05 g/cm3 and radius r 0=500 μm has been considered. The system is axis-symmetric with respect to the polar axis (Z) and only a π/2 angular sector has been simulated assuming rigid boundary conditions at the plane of symmetry (see Fig. 1). The target has been discredited with a Lagrangian mesh (r-θ) composed by 32 cells equally distributed in the π/2 angular sector, while 300 cells are used in the radial dimension (50 cells equally-spaced between 0 to 200 μm and 250 cells distributed to have the same mass between r = 200 μm and r 0=500 μm).

Fig. 1. Lagrangian cells at 2 ns, for a target whose initial radius is r0 (blue curve). The red curves show some of the photon paths, while the white curve (rS) is the position of the shock front.
The laser axis is located at 49o with respect to the polar axis and the intensity profile is given by the super-Gaussian function I(x,y)=I 0 exp-[(x/Δa)2 + (y/Δb)2]m/2, characterized by the parameters Δa and Δb (half width at 1/e) and the exponent m. Of course, the elliptical laser intensity profile becomes circular when Δa=Δb. The y coordinate is located in the plane R-Z of the two-dimensional hydro-calculations and it is orthogonal to the beam axis, while the x coordinate is orthogonal to the R-Z plane. In agreement with the point design of the LMJ laser beams, the ratio between the two axis of the elliptical profile is set to 2(Δa:Δb = 2:1) and the super-Gaussian exponent is set to m = 4. At each hydrodynamic time step the three-dimensional ray-tracing package follows the path of 2048 beamlets that are randomly distributed on the surface where the laser intensity is larger than I 0/100.
Advancements on the optimization of the direct drive capsule irradiation (Canaud et al., Reference Canaud, Fortin, Garaude, Meyer and Philippe2004a; Reference Canaud, Fortin, Garaude, Meyer, Philippe, Temporal, Atzeni and Schiavi2004b; Reference Canaud, Garaude, Ballereau, Bourgade, Clique, Dureau, Houry, Jaouen, Jourdren, Lecler, Masse, Masson, Quach, Piron, Riz, Van Der Vliet, Temporal, Delettrez and Mckenty2007a) have been recently offered by the polar direct drive (PDD). In this case, the laser beams axis are not aligned with the capsule center but are moved by a quantity δ toward the capsule equator. Figure 1 shows the Lagrangian mesh at t = 2 ns for a spherical target irradiated by an elliptical laser intensity profile. The red curves are the three-dimensional photon paths projected into the R-Z plane (only 1/10 of the total beamlets are shown). In the same figure, it also indicated the position of the initial target radius (r 0) and the current shock front position (r S).
3. ILLUMINATION MODEL AND HYDRODYNAMIC CALCULATIONS
The quality of the irradiation could be estimated as the root-mean-square deviation of the laser intensity I(θ,j) that illuminates a spherical surface. In the case of a system axis-symmetric around the polar axis Z, the intensity over the target surface I(θ) only depends on the polar angle θ and the root-mean-square non-uniformity σ2D is given by the Eq. (1).
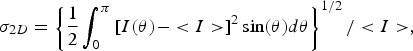 $${\rm \sigma}_{2D} = \left\{\displaystyle{1 \over 2} \int_0^{{\rm \pi}} \left[I\lpar {\rm \theta}\rpar - \lt I \gt \right]^2 \sin \lpar {\rm \theta}\rpar d {\rm \theta} \right\}^{1/2}/ \lt I \gt\comma \;$$
where <I> is the average intensity over the whole spherical surface. The first two calculations have been performed for a circular laser intensity profile characterized by Δb=Δa=r 0 = 500 μm and m = 4, and an elliptical profile where Δa=2Δb. In both cases, the lasers axes are aligned with the target center, thus the polar direct drive parameter is set to zero (δ = 0). The numerical results given by the illumination method show that the elliptical laser intensity profile provides a non-uniformity σ2D = 5.2% much better than the one found with the circular profile, σ2D = 11.9%. A parametric study performing a variation of the PDD parameter δ from 0 to δ/r 0 = 20% allows determination of the optimum PPD parameter that minimizes the non-uniformity. It has been found that for the circular (elliptical) laser intensity profile the optimum PDD parameter is δ/r 0 = 13.7% (δ/r 0 = 7.4%) and reduces the non-uniformity to σ2D = 1.1% (σ2D = 1.3%).
In the hydrodynamic calculations, a plastic target is irradiated by the laser beams and the position of the shock front moving inward to the target center is tracked as a function of time. The shock front position r S(θi,t) is defined as the location of the plasma density growth up to the double of the initial plastic density (ρS = 2ρCH). The position of the shock front is tracked at the 33 angles θi = θi-1 + Δθ, with θ1 = 0 and Δθ = π/64. Thus, with the r S(θi,t) it is possible to calculate the non-uniformity σS(t) (root-means-square deviation) associated to the shock front surface. Figure 2 shows the flow-chart of the average radius r(t) evaluated for two hydrodynamic simulations. In the first case, (1) the target has been irradiated by a circular laser intensity profile (Δa = Δb = r 0, m = 4, δ/r 0 = 13.7%); while in the second simulation (2) the intensity profile is elliptical (Δa = 2 Δb, Δb = r 0, m = 4, δ/r 0 = 7.4%). In the two frames of Figure 2, the red dashed curves are the average position of the shock front r S(t). The shock wave is faster in case (1) rather than in case (2); this is due to the different laser intensity profiles that generate a larger laser-target coupling in the circular case (1) with comparison to the elliptical case (2). Indeed, in the circular case the energy absorption is ηa = 85% while it is reduced to ηb = 61% in the elliptical case.
Fig. 2. Flow-chart of the average radial position r as a function of time for the circular (a) and elliptical (b) laser intensity profile. The blue curves represent the rms non-uniformity associated to the shock front without PDD (continuum) and with PDD (dashed). Red curves are the average shock front position, rS.
In both frames of Figure 2, the blue curves are the root-mean-square non-uniformities σS(t) associated to the shock front surface. The blue full curves refer to the cases without PDD while the dashed curves concern the cases with the PDD. It is found that the shock front non-uniformity increases with the time. Moreover, in the circular cases, the PDD technique improves significantly the shock front uniformity. Differently, in the elliptical cases, the application of the PDD technique modifies only slightly the uniformity. Indeed, when the shock wave arrive at the radius r = 400 μm (t ≈ 3 ns case (1) and t ≈ 3.5 ns case (2)) the circular laser intensity profile provides a root-mean-square non-uniformity σc = 5.6 μm and the elliptical case σe = 2.3 μm. Comparable non-uniformities are provided by the two intensity profiles when the optimum PDD parameters apply: σc = 2.0 μm with δPDD/r 0 = 13.7% and σe = 1.8 μm when δPDD/r 0 = 7.4%. Thus, in the circular (elliptical) case the PDD reduces the non-uniformity by a factor 2.8 (1.3).
4. PARAMETRIC ANALYSIS
In this section, the non-uniformity of the target irradiation has been evaluated as a function of the PDD parameter δ, the width of the circular and elliptical laser intensity profiles Δb, and their super-Gaussian exponent m. Then, these non-uniformities calculated with the illumination model and through the hydrodynamic calculation, have been compared.
As shown previously, in the hydrodynamic simulations, the non-uniformity of the shock front evolves with the time. In order to be independent of the shock velocity — which depends on the laser intensity profile — the average non-uniformity σn has been evaluated at 10 positions of the shock front radius r n=r 0 – n 20 μm, with n=[1–10]. These results are affected by numerical noise that produces a variation of about 10% in the value of the non-uniformity. In order to minimize this numerical noise, the average non-uniformity σn is evaluated by performing 10 simulations.
In the first set of calculations with circular (elliptical) laser intensity, profiles has been assumed with a width Δb= r 0 with Δa=Δb (Δa=2Δb) and m=4. In these calculations, the polar direct drive technique is applied and the parameter δ varies between 0 to 100 μm (20% r 0). The shock front non-uniformities σn (gray curves) as a function of δ are shown in Figure 3 for the circular and elliptical laser intensity profiles. The gray dashed curves enlighten the non-uniformity of the shock front at the selected radius of r 5=400 μm. The non-uniformities σ2D evaluated with the illumination model (blue curves) are also shown. It is found that the results provided by the two models exhibit similar behaviors. The illumination model provides an optimum PDD parameter δC/r 0=13.7% and δE/r 0=7.4% for the circular and elliptical cases, respectively. The hydrodynamic data show a minimum of the non-uniformity that corresponds quite well to these optimum PDD parameters. It is noted that in the elliptical case the optimum PDD parameter coincide with the illumination model at early time, while it shifts at lower values as the shock front moves deeper into the target.
Fig. 3. Shock front non-uniformities σn (gray curves) evaluated at different radius (between r1 = 480 μm and r10 = 300 μm, one each 20 μm) and illumination non-uniformity σ2D (blue curves) as a function of the PDD parameter δ/r0 for circular laser intensity profile (top) and elliptical case (bottom).
A second set of simulations has been performed keeping constant the optimum PDD parameters (δC/r 0 = 13.7% and δE/r 0 = 7.4%) and varying the width of the circular and elliptical laser intensity profiles, while the super-Gaussian exponent is fixed to m = 4. In these calculations, the width Δb varies between 0.6 r 0 and 1.8 r 0 and for the circular (elliptical) profile it is assumed Δa = Δb (Δa = 2Δb). As before the non-uniformities of the hydrodynamic calculations are calculated when the shock wave crosses the 10 spherical shell located between 480 μm and 300 μm (one each 20 μm). The non-uniformities σn (gray curves) evaluated with the circular (top) and elliptical laser intensity profile (bottom) are shown in Figure 4 as a function of the parameter Δb. The non-uniformities evaluated by the illumination model are indicated by blue curves. It shows a good correspondence between the optimal laser intensity width (Δb ≈ r0) obtained by the two methods. In the elliptical cases, the correspondence is better at early time when the shock front is located at about 10 µm into the target. Nevertheless, in both cases — circular and elliptical laser intensity profiles — the hydrodynamic data show a very well defined minimum of the shock front non-uniformity in correspondence to the optimal values found by the illumination model.
Fig. 4. Non-uniformities as a function of the width of laser intensity profiles, Δb. Hydrodynamic data (gray curves) and illumination model (blue curves).
Figure 5 compared in detail the non-uniformity of the shock front when it crosses the surface located at the radius r 5 = 400 μm. These calculations assume a circular (top frame) and elliptical (bottom) laser intensity profile. In this case, the shock front non-uniformity has been normalized to the distance travelled by the shock, namely σ5[%] = σ5[μm]/(r 0-r 5). These non-uniformities are shown as a function of the laser intensity profile parameter, Δb. In Figure 5, the red circles indicate the results without PDD, while the blue boxes refer to the calculations assuming the optimal PDD parameter (δC/r 0 = 13.7% and δE/r 0 = 7.4%). The red curves show the results of the illumination model without PDD, while the blue curves refer to the cases optimized with PDD. These results indicate that the illumination model reconstruct the same behaviors shown by the hydrodynamic data. In the elliptical case, the curves of the non-uniformities with and without PDD cross each other. It is also worth noting that this behavior is also shown by the hydrodynamic data. The hydrodynamic data appear smoothed and exhibit less pronounced minima in comparison with the results of the illumination model; nevertheless, both models show similar trends and similar optimum parameters that minimize the non-uniformity.
Fig. 5. Illumination non-uniformity (σ2D) with (blue curves) and without (red curves) PDD is shown as a function of Δb. The non-uniformity σ5 evaluated by hydrodynamic simulations at the shock front position r5 = 400 μm is shown by the red circles without PDD and by the blue boxes with PDD.
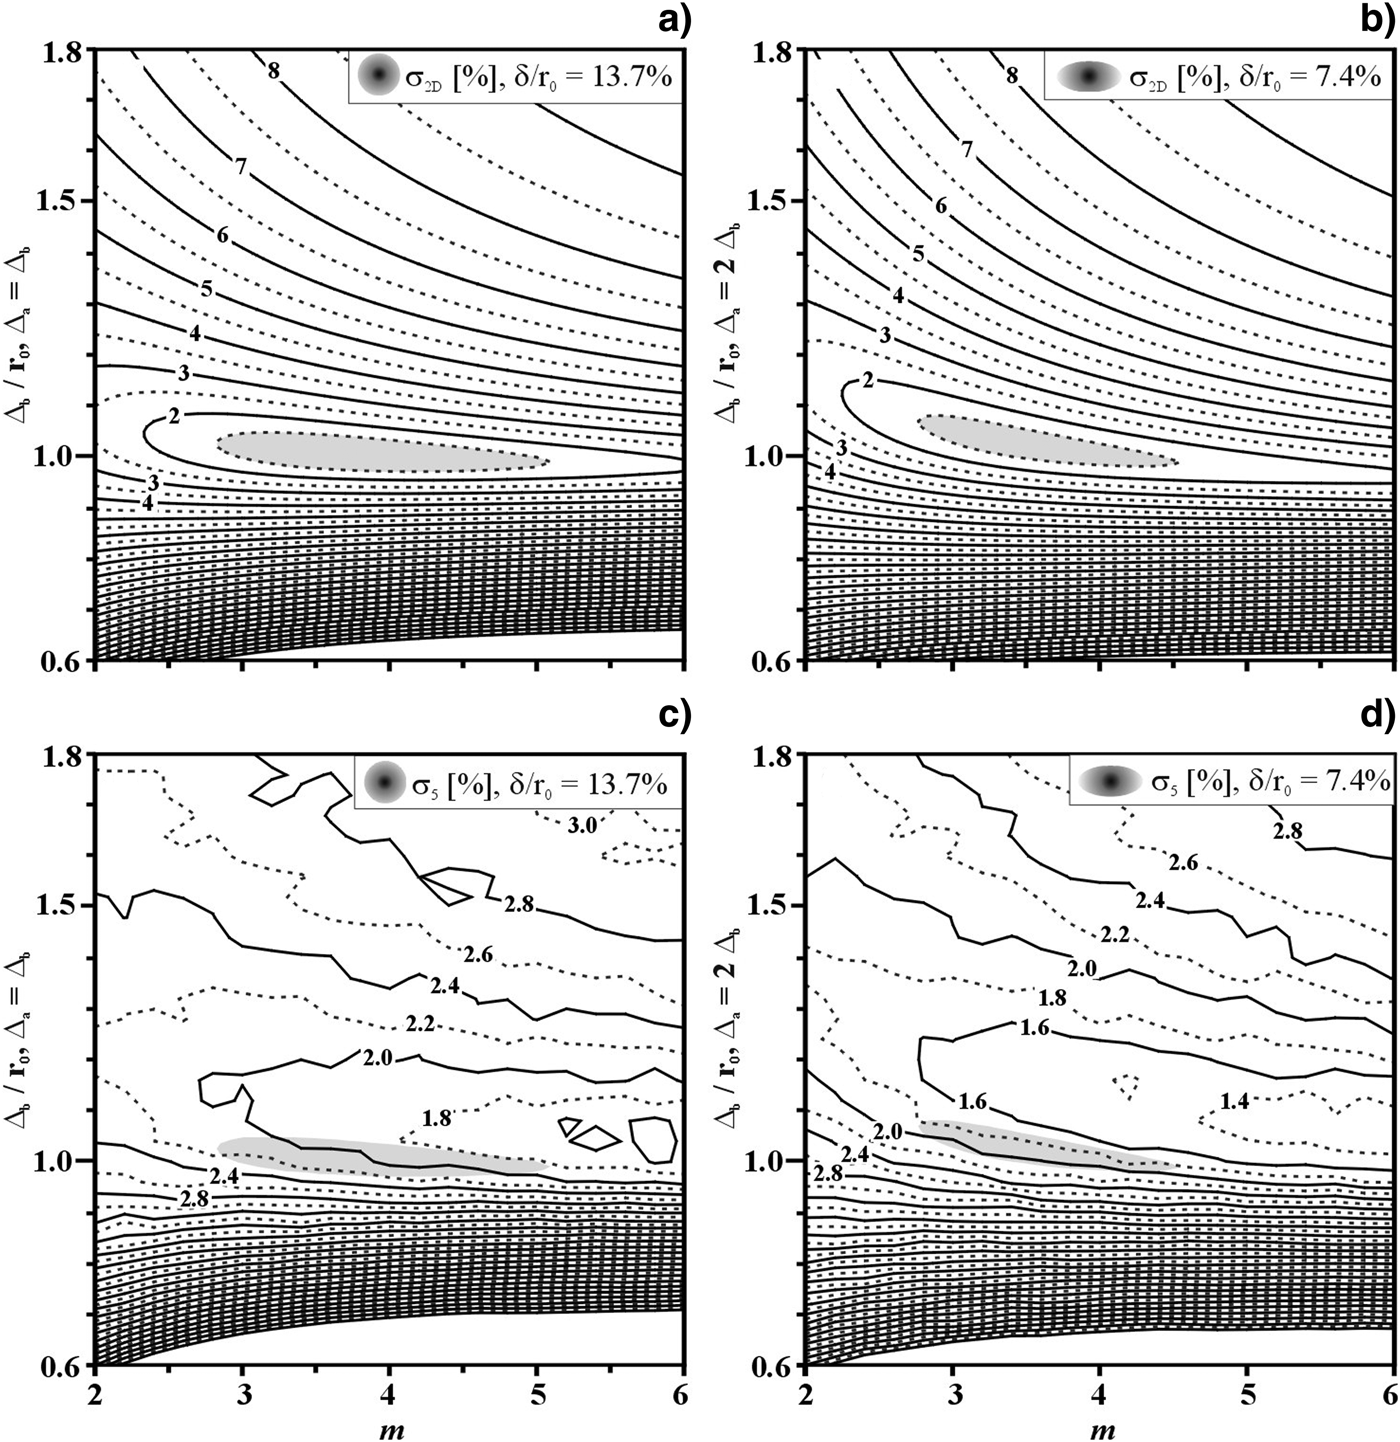
The optimum illumination non-uniformity is a function of the laser intensity profile parameters Δb and m. This has also been recently shown (Temporal et al., Reference Temporal, Canaud, Garbett, Philippe and Ramis2013) for the Orion facility (Hopps et al., Reference Hopps, Danson, Duffield, Egan, Elsmere, Girling, Harvey, Hillier, Norman, Parker, Treadwell, Winter and Bett2013) that with 5 + 5 laser beams located at 50° and 130° has a configuration similar to the LMJ with the 10 + 10 quads at 49° and 131° with respect to the polar axis. Thus, to explore the non-uniformity in the Δ-m space for the two optimal PDD parameters: δC/r 0 = 13.7% and δE/r 0 = 7.4%. The parametric study has been performed varying the width Δb/r 0 from 0.6 to 1.8 and the super-Gaussian exponent m between 2 and 6. The results of the illumination non-uniformity as a function of Δb and m are shown in Figure 6a (circular profile) and Figure 6b (elliptical). Hydrodynamic calculations have been performed to analyze the non-uniformity σ5(Δb/r 0, m) associated to the shock front when it crosses the radius r 5 = 400 μm. The contour levels of these non-uniformities (normalized to r 0-r 5) are shown in Figure 6c for the case of circular laser intensity profiles and Figure 6d for the elliptical cases. It is found that in the circular and elliptical cases both models provide similar results. The hydrodynamic data showed slightly better values of the minimum non-uniformities for the cases of elliptical profiles (≈ 1.4%) compared to the circular ones (≈ 1.8%). As it can be seen by comparing Figure 6a with Figure 6c and Figure 6b with Figure 6d, the minimum of the non-uniformity is roughly located in the same parametric space, even if the illumination model (shadowed areas) underestimates the optimal width (Δ) by about 10% and identifies a smaller parameter m. These results indicate that the optimum laser intensity profile provided by the illumination model could be used as a first estimation to minimize the non-uniformity associated to the front surface of the first shock.
Fig. 6. Non-uniformities as a function of the laser intensity parameters Δb and m. Illumination model (a and b) and shock front non-uniformity σ5 (c and d) provided by the hydrodynamic calculations at r5 = 400 μm. Cases with circular profiles (a and c) assume a PDD parameter δ/r0 = 13.7% whilst in the elliptical cases (b and d) δ/r0 = 7.4%. The shadowed areas correspond to the zones of minimum non-uniformity provided by the illumination model.
5. SUMMARY
A spherical target directly irradiated by laser beams has been considered. The laser configuration is axis-symmetric and the laser beams are located in two annular rings at the angles 49o and 131o with respect to the polar axis and correspond to those of the second ring in the LMJ facility. The laser beams have been characterized by circular (Δa = Δb) or elliptical (Δa = 2Δb) super-Gaussian laser intensity profile with the half-width at 1/e (Δa and Δb) and the exponent m. In order to optimize the uniformity of the target irradiation the polar direct drive technique has been used. In these cases, the laser beams move by a quantity δ toward the target equatorial plane.
The non-uniformity associated to the laser irradiation has been calculated by means of the illumination model as well as using two-dimensional hydrodynamic simulations. In these hydrodynamic calculations, a spherical solid plastic (CH) target of radius r 0 = 500 μm has been considered. In order to mimic the foot-pulse of a direct drive irradiation a constant laser power of 2 TW has been associated to the super-Gaussian laser intensity profile. A shock wave travelling inward through the target is generated as consequence of the laser irradiation. The shock front surface has been tracked providing a measurement of his non-uniformity during the time.
By using the illumination model it has been found that the minimum irradiation non-uniformity corresponds to the laser intensity parameters Δb/r 0 ≈ 1 and 3 <m <5 with the PDD parameters δC = 13.7% and δE = 7.4% for the circular and elliptical profile, respectively. The hydrodynamic results have been compared with those provided by the illumination model showing a satisfactory agreement between both approaches. In the hydrodynamic calculations the shock front non-uniformity grows with the time and the agreement of the two models in the optimal focal spot is better during the first few ns of the irradiation when the shock crosses the first 100 μm of the target.
In conclusion, the correlation between the illumination model and the non-uniformity of the first shock wave has been numerically confirmed for a specific two-dimensional axis-symmetric laser-target configuration. These results validate the hypothesis that the illumination model represents a valid method to assess the optimum laser-capsule parameters that minimise the shock front non-uniformity in the imprint phase. Nevertheless, further analysis is needed to explore the validity of this result also in the cases of more general laser-capsule configurations.
ACKNOWLEDGMENTS
M. T. and B. C. express their thanks to Daniel Bouche for the support given to this work. M. T. would like to thank Stefano Atzeni for the DUED code. R. R. was partially supported by the EURATOM/CIEMAT association in the framework of the “IFE Keep-in-Touch Activities.”