


Introduction
Obesity is a major problem of industrialized countries with paramount individual, social, and economic implications.Reference Williams, Mesidor, Winters, Dubbert and Wyatt1, Reference Apovian2 This is essentially due to the association of the obese phenotype with severe diseases at risk of premature death, such as severe depression, diabetes, metabolic syndrome, cardiovascular illnesses, and some types of cancers.3–7 The crucial question is why many people eat in excess of their metabolic needs, developing social maladjustment and overweight-related diseases. Among causes thought to engender unbalanced energy expenditure and adiposity gain, there are genetic vulnerabilities, sedentary lifestyle, endocrine illnesses, some pharmacological treatments, and, noticeably, mental factors, such as abnormal stress responses, anxiety, food addiction, and compulsive food intake.Reference Apovian2, 5, Reference Volkow, Wang and Baler8, Reference Field9
Eating is a complex behavior, requiring the coordination of central and peripheral nervous systems, as well as of endocrine system, and of peptides, such as leptin, ghrelin, insulin, and neuropeptide Y.Reference Volkow, Wang and Baler8, Reference Field9 Leptin is secreted from adipocytes and is a mediator of long-term regulation of energy balance, by suppressing food intake and thereby inducing weight loss, while ghrelin is a fast-acting hormone, playing a role in meal initiation.Reference Volkow, Wang and Baler8, Reference Field9 Leptin inhibits the hypothalamic-pituitary-adrenal axis (HPA), the CRF mRNA expression, and glucocorticoid levels, as well as the rewarding properties of feeding, while ghrelin exerts opposite activities.Reference Volkow, Wang and Baler8, Reference Field9
Several converging studies of the last 40 years suggest that serotonin (5-HT) may be implicated in the control of satiety and feeding behaviors with different receptors, specifically 5-HT1B, 5-HT2C, and 5-HT6 at the level of the hypothalamic ventromedial and lateral nuclei, while interacting with both orexin and α−melanocortin-stimulating hormone (α-MSH), and in the nucleus of the solitary tract by integrating peripheral satiety inputs.Reference Voigt and Fink10 Intriguingly, the 5-HT neurotransmission and receptor functions are influenced by glucocorticoid response in the central nervous system (CNS), affecting feeding behavior and the choice of macronutrient composition in diet that, in turn, is able to influence 5-HT synthesis.11–15 Furthermore, 5-HT improves the glucose homeostasis, lipid metabolism, bone density, and some conditions associated with metabolic syndrome, such as obesity,Reference Martin, Young and Leong12, Reference Wyler, Lord, Lee, Elmquist and Liu16 and it is also synthesized in pancreatic islets and co-secreted along with insulin, potentially acting as a local autocrine/paracrine signal.Reference Wyler, Lord, Lee, Elmquist and Liu16 Again, 5-HT pathways are involved in the adaptation to cold exposure through the sympathetic activation of thermogenic adipose tissue, as adipocytes express 5-HT receptor subtypesReference Kinoshita, Ono and Horie17 and the 5-HT reuptake carrier (5-HT transporter, SERT).Reference Stunes, Reseland and Hauso18 The adipocyte-derived 5-HT has been implicated in lipogenesis, with some activity also on leptin.Reference Wyler, Lord, Lee, Elmquist and Liu16, Reference Marazziti, Rutigliano, Baroni, Landi and Dell’Osso19 Intriguingly, leptin has been shown to inhibit appetite by decreasing the 5-HT synthesis or release by the serotonergic neurons of the brainstem, targeting arcuate nucleus 5HT1A and 5-HT2B receptors.Reference Oury and Karsenty20, Reference Yadav, Oury and Tanaka21
Not surprisingly, 5-HT, leptin, ghrelin, and several other peptides have been suggested to play a role in the pathophysiology of different eating disorders. Reference Tortorella, Brambilla and Fabrazzo22
One possibility to study 5-HT in humans in vivo is represented by blood cells, such as platelets or lymphocytes.Reference Stahl23, Reference Marazziti, Rossi, Giannaccini, Baroni, Lucacchini and Cassano24 Both platelets and lymphocytes possess the protein carrier for 5-HT uptake, SERT, identical to that found on presynaptic serotonergic neurons, as shown by pharmacological and cloning studies.Reference Lesch, Wolozin, Murphy and Reiderer25 For this reason, they have been widely used in biological psychiatry as a reliable model of the same CNS structure.26–30 In addition, platelets respond to agonist-induced activation by rapid phosphorylation and represent a good model to study signal transduction events.Reference Aharonovitz and Granot30 In this context, SERT, as other carriers belonging to the superfamily of monoamine transporters, undergoes a fine-tuned short-term and long-term regulation to adapt 5-HT levels in cells, tissues, and body fluids. Several trafficking proteins, proteases, phosphatase, and kinase activities may change SERT at the level of its gene expression, density, protein turn-over, and conformational states, modifying the affinity and functional kinetics of the carrier.Reference Carneiro and Blakely31, Reference Giannaccini, Betti and Palego32 Moreover, the SERT protein is a target of different psychotropic compounds, primarily, the selective 5-HT reuptake inhibitors (SSRIs), the most common antidepressants (ADs) widely used in eating disorders.
Given the increasing role of 5-HT in metabolism, the aim of the present study was to evaluate, by extending a previous survey,Reference Giannaccini, Betti and Palego11 both platelet SERT binding and reuptake parameters, together with circulating leptin, insulin, triglycerides (TD), total cholesterol (TC), low-density lipoprotein-cholesterol (LDL), high-density lipoprotein-cholesterol (HDL), glucose, systolic and diastolic pressure, body mass index (BMI, Kg/m2), circumference of waist (WC), and hips (HC), as well as their possible interactions, in a group of obese individuals, also including the large obese ones, as compared with nonobese subjects. Based on theoretical and empirical arguments, we propose the following three hypotheses: presence of platelet SERT alterations in obesity; differential leptin, insulin values, and metabolic parameters values in different BMI classes; and eventual interrelationships between the SERT, leptin, insulin, and metabolic parameters.
Materials and Methods
Chemicals and reagents
[3H]-paroxetine (specific activity: 15-21Ci/mmol) and [3H]-5-HT (28.1-30 Ci/mmol) were purchased from Perkin-Elmer, Life Science, Milan, Italy. All other reagents used were of the best analytical grade. High-performance liquid chromatography–grade water was employed for all solutions and buffers.
Subjects
Seventy-four subjects were enrolled for the present study and were recruited among patients and their nonobese accompanying persons at the Obesity and Lipodystrophy Center of the Department of Clinical and Experimental Medicine, Endocrinology Unit, University of Pisa. All overweight and obese individuals were consulting the Endocrinology Center to lose weight. Medical exclusion criteria, appraised by F.S. and A.M., were active cancer, heart, liver or kidney diseases, and presence of hematological or neurological illnesses. Another exclusion criterion was the use of hypotensive drugs or compounds interacting with carbohydrate-lipid metabolism (insulin, oral hypoglycemic compounds, and statins). The psychiatric exclusion criteria were presence of family or personal history of any major psychiatric disorder or substance abuse. Therefore, all subjects underwent a detailed, 1-hour long psychiatric interview conducted by FM, BC, IMC and EM and supervised by senior psychiatrists (DM and LD), to clinically exclude both major and minor psychiatric disorders. The absence of any major psychopathological disorder was subsequently confirmed by the structured clinical interview for DSM-IV-Patient Version 2.0 (SCID-P).Reference First, Spitzer, Gibbon and Williams33 All recruited subjects had or were currently suffering from no eating or anxiety disorders. Three obese and four nonobese subjects reported the occasional use of different sleeping pills (melatonin, benzodiazepines, or Z-drugs). All subjects neither were heavy cigarette smokers nor belonged to groups of high-risk HIV individuals.
Subjects taking psychotropic drugs acting on the SERT, other psychotropic agents, estro-progestinic drugs, or nonsteroidal anti-inflammatory agents were included in the study after a 3 months and 10 days withdrawal, respectively.
Height was measured while subjects were standing, using standardized techniques and equipment. Body weight was measured by a precision instrument and an electronic scale (± 0.1 Kg). The subjects were classified according to the five classes of the BMI (Kg/m2) as follows: BMI between 18.5 and 24.9: normal weight (n = 18); BMI between 25 and 29.9: overweight (preobesity, n = 12); BMI between 30 and 35: class I obesity (n =9); BMI between 35 and 39.9: severe obesity or class II obesity (n = 10); and BMI > 40: class III obesity (n = 25). Given the small numbers of subjects of the class I and II, they were merged together for statistical analyses.
All subjects signed the informed consent after a full explanation of the study that had been approved by the Ethics Committee at Pisa University.
Blood collection
Venous blood samples (35 mL) were obtained after an overnight fasting between 8 and 9 a.m. during the months of April to June 2019, in order to avoid the possible interference of circadian or seasonal rhythms, respectively.Reference Marazziti, Falcone, Castrogiovanni and Cassano34
Measurement of metabolic parameters
After sample withdrawal, 5 mL of the collected venous blood were immediately sent to the Laboratory of Clinical Chemistry, University Hospital of Pisa, for the determination of glucose, TD, TC, LDL-cholesterol, HDL-cholesterol, insulin, and leptin, measured by means of automatized procedures. Leptin and insulin were measured by ELISA methods (Mediagnost, Germany).
Platelet sampling
The remaining 30 mL blood samples were used for platelet preparation, after mixing them with 1 mL of EDTA 0.1 M. Platelet-rich plasma was obtained by low-speed centrifugation (150 × g, for 20 minutes, at 22°C). Platelets were counted automatically by means of a flux cytometer (Cell-dyn 3500 system, Abbott, Milano, Italy).
For [3H]-5-HT reuptake, platelets were used immediately. For [3H]-Par binding, platelets were precipitated by centrifugation at 10 000 × g for 10 minutes at 4°C, and the ensuing pellets were then stored at −80°C until the assay, which was performed within a week.
[ 3 H]-5-HT reuptake
For [3H]-5-HT reuptake assay, intact platelets were maintained under physiological conditions, such as isotonic buffer, presence of NaCl and glucose, 37°C assay temperature. Precisely, the assay was performed according to the method of Arora and Meltzer,Reference Arora and Meltzer35 with some modifications.Reference Marazziti, Falcone, Castrogiovanni and Cassano34 Aliquots of platelets (2x10⁶ cells)6 were incubated with [3H]-5-HT at six crescent concentrations ranging from 20 nM to 1500 nM in a Krebs assay buffer (118 mM NaCl, 4.7 mM KCl, 1.07 mM MgSO4 7H2O, 1.17 mM KH2PO4, 25 mM NaHCO3, 11.6 mM glucose, pH 7.4) to a final volume of 0.5 mL. The incubation was carried out for 10 minutes at 37°C. Nonspecific reuptake was measured in the presence of 10 μM fluoxetine (a gift from Eli Lilly Co, Indianapolis, IN). Specific reuptake was determined as the difference between total and nonspecific reuptake. All points were performed in duplicate. The reaction was halted by the addition of 5 mL of ice-cold assay buffer, subsequently followed by rapid filtration through Whatman GF/C glass-fiber filters. Filters were incubated with 200 μL of 0.2 N NaOH to obtain the cell lysis, neutralized by adding 200 μL of 0.2 N-glacial acetic acid, and placed in plastic vials with 10 mL of scintillation liquid for radioactivity measurement, performed through a liquid phase scintillation β-counter (Packard 1600 TR) and taken as dpm.
[ 3 H]-Par binding
At the time of assay, platelets were thawed and homogenized by means of an Ultra-turrax homogenizer in 10 mL of ice-cold buffer (5 mM Tris-HCl, 5mM EDTA, pH 7.4, 4°C), containing a cocktail of protease inhibitors (160 μg/ml benzamidine, 200 μg/ml bacitracine, 20 μg/ml Soy-Trypsin Inhibitor), and centrifuged at 48 000 × g for 15 minutes at 4°C. The pellet was resuspended in 10 mL of ice-cold 50 mM Tris-HCl buffer, and washed twice by centrifugation at 48 000 × g for 15 minutes at 4°C. The final precipitate was suspended in the assay buffer (50 mM Tris, 120 mM NaCl, 5 mM KCl pH 7.4) and homogenized. Protein content was determined by the Bradford method (Bio-rad), using γ-globulins as the standard.The [3H]-Par binding was carried out according to the method of Marazziti and coauthors.Reference Marazziti, Rossi and Gemignani27 The incubation mixture consisted of 100 μL of platelet membranes (50-100 μg protein/tube), 50 μL of [3H]-Par at six concentrations ranging from 0.01 to 1 nM and 1.85 mL of assay buffer. Specific binding was obtained as that remaining in the presence of 10 μM fluoxetine as a displacer. All samples were assayed in duplicate and incubated at 22°C for 1 hour. The incubation was halted while adding 5 mL of cold assay buffer. The content of the tubes was immediately filtered under vacuum through Whatman glass-fiber filters GF/C and washed three times with 5 mL of assay buffer. Filters were then placed in vials with 4 mL of scintillation cocktail, and radioactivity (dpm) was measured by means of a β-counter (Packard LS 1600).
Calculations and statistical analyses
All demographic, clinical, and laboratory data were presented as mean ± standard deviation (SD), variation range (min and max values). The maximal velocity (V max, pmol/min/109 platelets) and the Michaelis–Menten constant (KM, nM) of the [3H]-5-HT reuptake were calculated by transforming saturation data according to the Lineweaver–Burk plot method with the aid of the GraphPad Prism program (version 7.0, San Diego, CA). Equilibrium-saturation binding data, the maximum binding capacity (B max, fmol/mg protein), and the dissociation constant (KD, nM) of [3H]-Par binding were analyzed by means of iterative curve-fitting computer programs, EBDA-LIGAND (Kell for Windows, version 6.0) and GraphPad Prism.Reference McPherson36
For gender comparisons on biological parameters, the Student’s t-test for independent samples was used.
The correlation between the [3H]-5-HT, [3H]-Par binding, and the other parameters, and between characteristics of the subjects and biological markers were explored by calculating the Pearson’s correlation coefficient.
The possible differences between obese and nonobese subjects of different categories were assessed by the ANOVA Bonferroni’s post hoc comparisons.
Multiple linear-regression analyses were also carried out to appraise predictive independent variables on SERT parameters, taken as the dependent variables.
All statistical analyses were carried out using the GraphPad Prism software and the Statistical Package for Social Sciences (SSPS), version 23.
A two-sided P value of .05 was considered the statistical threshold.
Results
As shown in Table 1, the recruited subjects were prevalently women, with a mean age of 38.2 years. According to recruitment criteria, comprising normal weight, overweight, and obese subjects, as well as large obese ones, the BMI ranged between 16.5 and 54.8 kg/m2 (34.38 ± 10.61). The systolic pressure (mmHg, mean ± SD) was 126.8 ± 12.3 and the diastolic pressure was 79.8 ± 11.0, being on average within the normal range, as the metabolic parameters and platelet SERT binding or reuptake velocity measures (B max and KD; V max and KM). About 40% of obese subjects (obese I/II and III ones) had high fasting insulin (> 20 μIU/mL) and leptin (> 30 ng/mL) levels. The mean levels of glucose were 94 ± 18 mg/dL, but 40% of obese subjects had value >100 mg/dL, while those of total cholesterol were 200 ± 11 mg/dL, with only 17% subjects beyond 200 mg/dL. No difference was detected between men and women, except that for leptin levels being significantly higher in men than in women (44.5 ± 30.6 vs 25.5 ± 26.9, P = .013).
Table 1. The Anthropometric, Blood Pressure, Blood Metabolic Variables, and the Platelet SERT Parameters, Measured in the Whole Group of Subjects.
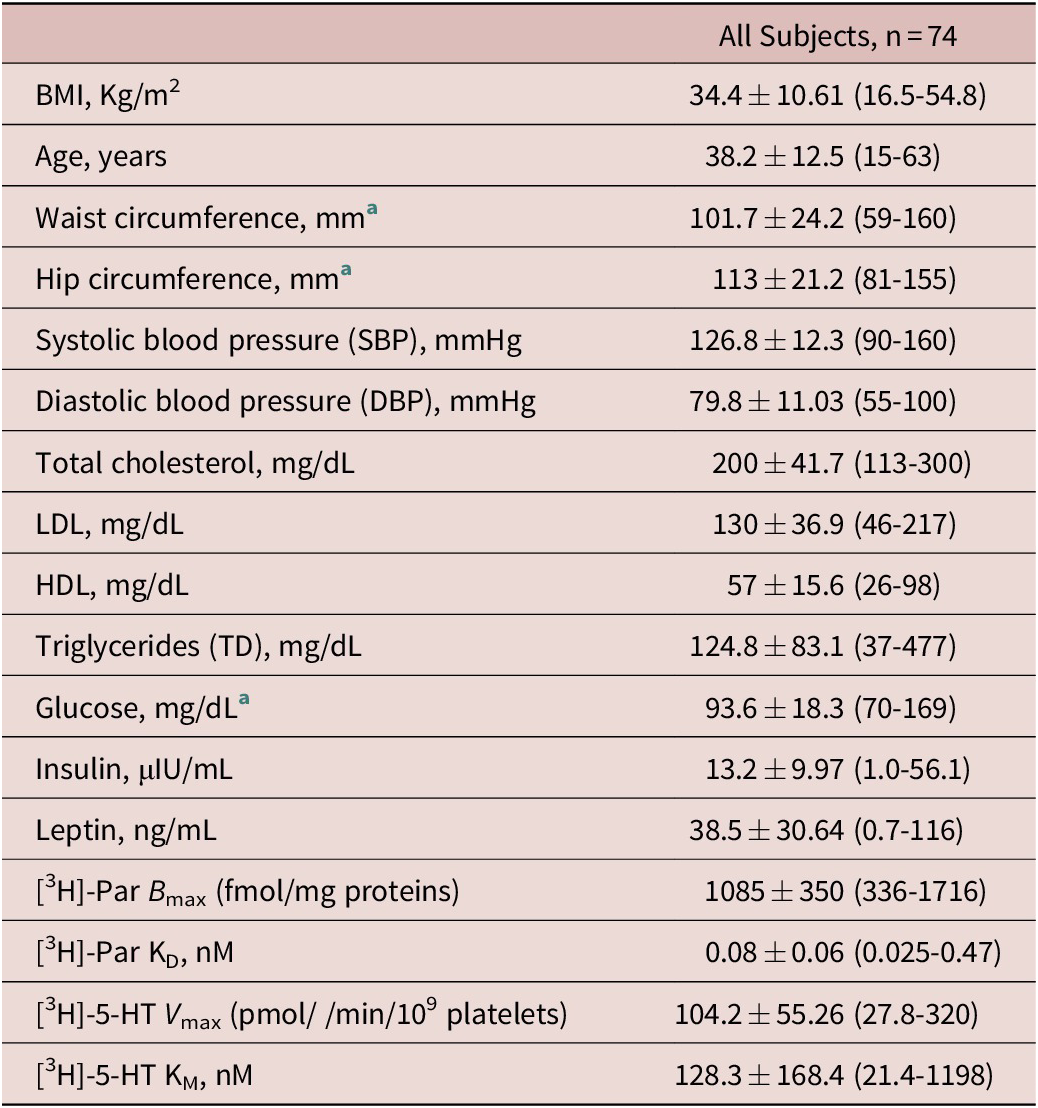
Data are presented as the mean ± SD and ranges (min and max values).
Abbreviations: BMI, body mass index; HDL, high-density lipoprotein-cholesterol; LDL, low-density lipoprotein-cholesterol; NW, normal weight; OB, obese; OW, over weight.
a These parameters were appraised in n = 41 subjects, NW: n = 9; OW: n = 9; OB-I/II: n = 13; OB-III: n = 10.
Table 2 reports the mean ± SD of all investigated variables, in their different BMI groups, together with corresponding results of ANOVA inferential tests. Prior to ANOVA and correlation tests, the [3H]-Par KD and [3H]-5-HT KM values, parameters linked to the carrier conformational, and ligand affinity state were −log [M] transformed (trKD and trKM), because they were not normally distributed.
Table 2. The Investigated Anthropometric, Blood Pressure, Blood Metabolic Variables, and the Platelet SERT Parameters, Divided with Respect to BMI.

Data are presented as the mean ± SD and ranges (min and max values). ANOVA, significant Bonferroni post hoc tests: NW vs OW or OB groups.
Abbreviations: BMI, body mass index; HDL, high-density lipoprotein-cholesterol; LDL, low-density lipoprotein-cholesterol; NW, normal weight; OB, obese; OW, over weight.
a These parameters were appraised in n = 41 subjects, NW: n = 9; OW: n = 9; OB-I/II: n = 13; OB-III: n = 10.
**** P < .0001.
*** P < .0001.
** P < .001.
* P < .05; OW vs OB groups.
The post hoc comparisons between nonobese and obese subjects showed that the [3H]-Par B max values were progressively lowering from nonobese to class III obesity (F: 8.15. P < .001), while insulin and leptin were increasing (F: 14.00. P < .001), as they were TD, glucose, blood pressure values, and WC or HC measures. While HDL was progressively and significantly reducing with higher BMIs, there was no relevant increase in TC and LDL levels with the degree of obesity.
The Pearson’s correlation analyses, carried out in the whole sample, revealed the presence of different relationships among biological parameters. Figure 1(A-C) shows that the platelet SERT density, or [3H]-Par B max, was negatively correlated with BMI, and with WC and HC, anthropometric parameters linked to obesity. Figure 2(A-E) depicts the significant correlations between B max and most circulating fasting metabolic indexes: negative with insulin, leptin, glucose, and TD, while positives with HDL. Concerning the SERT functionality, significant and negative correlations were found between the [3H]-5-HT reuptake V max, leptin, and the trKM itself (Figure 3A,B). Figure 4A-F displays that trKD was significantly and positively correlated with glucose and TD, and trKM, with glucose, WC, HC, and close to significance with leptin. When the subjects were distinguished in normal weighted and obese, no significant correlations were present in the first group, while they remained in obese subjects.

Figure 1. Significant correlations of platelet [3H]-Par B max with anthropometric indices: (A) body mass index (BMI); (B) waist circumference (WC); (C) hip circumference (HC). The Pearson’s coefficient of correlation r and corresponding P values are depicted; the dotted lines represent the best fit from linear-regression analysis. ****Strong and **high-to-moderate statistical significance of the Pearson’s correlation.

Figure 2. Significant correlations of platelet [3H]-Par B max with glycolipid metabolic parameters: (A) insulin; (B) leptin; (C) glucose; (D) triglycerides (TD); (E) the high-density lipoprotein-cholesterol (HDL). The Pearson’s coefficient of correlation r and corresponding P values are depicted; the dotted lines represent the best fit from linear-regression analysis. ****Strong, **high-to-moderate, and * moderate statistical significance of the Pearson’s correlation.

Figure 3. Significant correlations of platelet [3H]-5-HT reuptake V max with leptin and trKM (−log[M]KM). The Pearson’s coefficient of correlation r and corresponding P values are depicted; the dotted lines represent the best fit from linear-regression analysis. ****Strong and **high-to-moderate statistical significance of the Pearson’s correlation.

Figure 4. Correlations of the platelet [3H]-Par and [3H]-5-HT reuptake affinity measures with glycolipid metabolic parameters: trKD (−log[M]KD) vs (A) glucose; (B) triglycerides (TD); trKM (−log[M]KM) vs (C) waist circumference (WC); (D) hip circumference (HC); (E) leptin. The Pearson’s coefficient of correlation r and corresponding P values are depicted; the dotted lines represent the best fit from linear-regression analysis. **High-to-moderate, *moderate, and °trend for statistical significance of the Pearson’s correlation.
Multiple linear-regression analysis, carried out considering SERT binding and function parameters as dependent variables, reported that increased insulinemia was predictive of reduced SERT B max values (P < .006), independently from body weight and obesity degrees (Table 3).
Table 3. Significant Multiple Regression Analysis with [3H]-Par B max as the Dependent Variable.

Discussion
Obesity is a burden for the world public health due to its association with the risk of developing severe metabolic and cardiovascular illnesses. This motivated intense investigation on those neuroendocrine and biochemical substrates that underlie body fat mass accrue as possible targets for successful therapeutic interventions. 5-HT, a monoamine acting as a neurotransmitter in the brain and a pleiotropic signal in peripheral tissues, has been linked to eating behavior and obesity in animal models and humans. It is considered among satiety factors, being able to reduce food intake and meal size, while its downregulation bringing about the opposite effect.37–39 The functioning of the 5-HT network is tightly regulated by the balance between its biosynthesis rate from the essential amino acid tryptophan, its release, and catabolism,Reference Höglund, Øverli and Winberg40 and by the degree of occupation/sensitivity of the different 5-HT receptors and the activity of intra-cellular 5-HT reuptake via the protein carrier SERT.Reference Daws and Gould41, Reference Brindley, Bauer, Blakely and Currie42 Moreover, peripheral 5-HT has been involved in the modulation of energy metabolism, stimulating the search for its networks linked to adipose tissue accumulation.Reference Wyler, Lord, Lee, Elmquist and Liu16, Reference El-Merahbi, Löffler, Mayer and Sumara43
In the present study, we explored the relationships between the platelet SERT, a peripheral serotonergic marker, and TD, total, HDL and LDL cholesterol, insulin, glucose, leptin, blood pressure, BMI, WC and HC. The mean values of the platelet SERT parameters found in the overall subjects, included in this study, were within the range of healthy control individuals, as compared with those patients with different psychiatric conditions of our extensive database.Reference Stahl23, 27–29, Reference First, Spitzer, Gibbon and Williams33, Reference Marazziti, Rossi and Palego44 This was expected, because we excluded all subjects with family or personal history of any major psychiatric disorder. Even the mean values of most glycolipid metabolic parameters in most subjects were within the normal range. These results highlighted that the majority of the subjects, in spite of the evidence of being more or less obese, did not show any severe overt metabolic disturbances. This might be due to the fact that all were Italian and, although coming from different regions, they share common food habits and recipes. Taken together, these findings again support the paramount benefits of Mediterranean diet.Reference Fond, Young and Godin45, Reference Shafiei, Salari-Moghaddam, Larijani and Esmaillzadeh46
However, the post hoc comparisons of nonobese vs obese subjects of different BMI classes revealed significant differences. The density of the SERT (B max) was significantly higher in the control subjects than in all BMI classes that were different one from another, confirming previous investigations conducted in plateletsReference Giannaccini, Betti and Palego11 or in brain cortical and subcortical regions.Reference Erritzoe, Frokjaer and Haahr47 Furthermore, to our knowledge, this is the first study investigating SERT functionality and 5-HT reuptake kinetics in obesity: reduced SERT binding was paralleled by a similar trend in V max values, although these findings would indicate progressive and significant changes of the 5-HT system in parallel with increasing weight, until the point that SERT expression (and, perhaps, functionality) values are similar to those found in patients with different psychiatric disorders.Reference Marazziti, Rossi and Gemignani27, Reference Marazziti, Dell’Osso and Rossi28, Reference First, Spitzer, Gibbon and Williams33, Reference Marazziti, Rossi and Palego44 The reduced SERT number, therefore, might constitute, not only a marker of vulnerability toward the onset of psychopathology, but an additional cue of severe obesity and/or of those metabolic disorders quite present in different psychiatric conditions, while perhaps suggesting a common diathesis.Reference Rajan and Menon48 This is hence supported by the findings of significantly lower and higher levels of, respectively, HDL and TD, leptin, insulin, or glucose in obese vs control subjects, with a constant progression along the different classes of obesity. According to us, the changes in fasting insulin and leptin values from overweight to class III subjects are really impressive.
The differences between nonobese and obese subjects are confirmed by the presence of several and significant correlations among the different parameters. The most numerous were negative and between the B max and BMI, WC, HC, TD, glucose, insulin, and leptin. On the contrary, B max resulted to be positively related to HDL cholesterol, a marker of lipid metabolism endowed with athero- and cardioprotective actions.Reference Navab, Reddy, Van Lenten and Fogelman49 As the B max is a measurement of the density of the SERT proteins, these findings reveal that the higher these values, the lower BMI, TD, glucose, insulin, leptin, WC and HC, and vice versa. On the contrary, the higher the B max values, the higher the HDL cholesterol. Intriguingly, the V max, which is the velocity of the reuptake of 5-HT, was negatively correlated with leptin. Both the trKD and trKM, that measure the affinity of the ligand, that is to say, 5-HT to its site, were positively related to TD and glucose the first, and to glucose the second. Moreover, these significant correlations were specific for obese subjects only, suggesting that adiposity is able to modulate platelet SERT.
These results generate other reflections. First, a normal density and functioning of the SERT seem to be related to “healthy” values of different parameters, specifically of lipid and glucose metabolism, while a decreased SERT is a cue or a consequence of, or provoke metabolic alterations, or, probably, as mentioned, share the same pathophysiology. In this regard, it should be mentioned that increased glycemia values and decreased HDL levels, as reported here in subjects with higher BMIs and lower B max, have been linked to the presence of inflammatory patterns and increased oxidative stress,50–52 similarly, in part, to what reported in mood disorders.53–55 Of note, obesity and psychiatric disorders may share impairment in energy metabolism.Reference Zuccoli, Saia-Cereda, Nascimento and Martins-de-Souza56
Adipokines are thought to be among the mediators of such common features.Reference Iikuni, Lam, Lu, Matarese and La Cava57, Reference Taylor and Macqueen58 Leptin has been considered as an anti-obesity agent, acting as a signal of an adiposity negative feedbackReference Chehab59: low leptin prevent from starvation, while its release by adipocytes is related to plenty of food intake.Reference Jéquier60 Although the links between leptin and 5-HT are unclear,Reference Giannaccini, Betti and Palego61 different data support the close relationships between them as the peptide inhibits appetite by suppressing the biosynthesis and release of 5-HT from 5-HT neurons in the brainstem.Reference Oury and Karsenty20, Reference Yadav, Oury and Tanaka21 These findings seem in contrast to the decreased density of the SERT in obese individuals, as we observed a negative relationship between the two parameters. Anyway, the literature is consistent in reporting high leptin levels in obesity, so that a condition of leptin resistance is considered as one of the factors provoking obesity.62–64 Obese subjects, in spite of the high levels of leptin, indeed, would continue to eat. Interestingly, although data are conflicting, increased levels of leptin have been associated also with 20% prevalence of depression in obese subjects.Reference Milaneschi, Lamers, Bot, Drent and Penninx65 In light of these findings, it would be interesting to know whether leptin may trigger depression only in those obese subjects with a decreased density of the SERT and reduced 5-HT uptake.
We also observed a decreasing expression of platelet SERT related to increasing levels of insulin along the different degrees of obesity. Interestingly, high level of glycemia, linked to insulin resistance, was positively correlated with SERT affinity (trKD and trKM), implying a higher affinity for 5-HT under this condition. Insulin is the key hormone in ensuring energy reserves, through its action of strengthening anabolic pathways after food intake as the synthesis of glycogen and proteins, the activation of lipogenesis and fat storage in adipose tissue. In an attempt to explain the present results, it should be considered that insulin, stimulated by meal consumption, promotes the synthesis and release of 5-HT (brain) and leptin (adipocytes). “Gene × environment” interactions and/or different triggers and disruptors are supposed to impact this endocrine pathway at various degrees, also at the level of the 5-HT system in vulnerable individuals: among these variables, there are genetic polymorphisms, stressors, and the stress response, lifestyles inducing carbohydrate craving, and reward circuits, as well as inflammation patterns.Reference Field9, Reference Wurtman13, Reference Fernstrom14, Reference Sinha and Jastreboff66, Reference Tomiyama67 Ensuing 5-HT changes might entail a different metabolism, a reduced sensitivity of 5-HT2C and 5-HT1B receptors,37–39 in respect to the 5-HT1A and 5-HT2B receptors in the hypothalamus,Reference Oury and Karsenty20, Reference Yadav, Oury and Tanaka21 and/or to the 5-HT6 ones in the hypothalamus and nucleus accumbens,Reference Pratt, Schall and Choi68 in favor of an increased motivation to eat. Increased food intake would stimulate peripheral 5-HT generated from the gut and pancreatic cells to induce more insulin secretion, body fat increase, further release of leptin, and, ultimately, insulin and leptin resistance, reinforcing hunger circuits. Reference Wyler, Lord, Lee, Elmquist and Liu16, Reference Ohta, Kosaka and Kishimoto69 The normal cooperation between insulin and 5-HT is lost, and insulin, instead of being hampered, continues to be produced by pancreatic islets.Reference Paulmann, Grohmann and Voigt70 This is a condition of insulin resistance widely reported in obesity, diabetes, and depression.Reference Webb, Davies and Ashra71 Therefore, the reduced platelet SERT density with increased BMI would reflect the defective and adipogenic activity of this brain-periphery endocrine loop, or the insulin-5-HT-leptin axis.
Another important result of this study is that insulin was found to significantly predict the reduction of platelet SERT number, independently from BMI, confirming the tight physiological relationship between insulin, 5-HT, and energy metabolism by brain-periphery pathways.Reference Höglund, Øverli and Winberg40, Reference Paulmann, Grohmann and Voigt70 Insulin and 5-HT cooperate to regulate energy homeostasis and eating behavior, indicating that alterations in their reciprocal interactions are linked to a variety of metabolic disorders, as diabetes and obesity, further providing a rationale to their comorbidity with depression.Reference Milaneschi, Lamers, Bot, Drent and Penninx65, Reference Ohta, Kosaka and Kishimoto69, Reference Webb, Davies and Ashra71, Reference Lu72
In summary, alterations of the insulin-5-HT-leptin axis, accompanied by conditions of leptin and insulin resistance, would distinctively regulate the density, function, and/or affinity of platelet SERT by complex adaptive and appetite/reward-related cross talks involving the brain, the gut, pancreatic islets, and adipose tissue in the obese phenotype. The impairment of the insulin-5-HT cooperation seems to be a main effector of the observed platelet SERT number downregulation. On the other hand, although insulin reduces the platelet SERT number in a BMI-independent manner, this does not exclude that SERT expression, under a condition of insulin resistance, would be diminished by other blood obesity factors in grade II or III obese subjects. Further investigation is required to ascertain which signaling pathways related to obesity have the greatest impact on the regulation of platelet SERT.
Limitations
The present study shows some limitations that should be underlined. First, the relatively small number of subjects per category included in the sample, so that further studies are warranted to confirm or reject the present findings. Second, two-thirds of the obese subjects were women and one-third were men: in any case, all were outpatients and within a limited age range. Third, given the small numbers of subjects of the class I and II, they were merged together for statistical analyses: this might have prevented us to detect differences between these two classes of obesity. Fourth, platelet SERT is a peripheral measure and, even though it is widely used to investigate central serotonergic function, the surrounding environment could be quite different.Reference Marazziti, Landi and Baroni29
Conclusions
Taken together, our findings further support the role of the 5-HT system, specifically of the SERT in the regulation of feeding and metabolism.Reference Yabut, Crane, Green, Keating, Khan and Steinberg73, Reference Cataldo Bascuñan, Lyons, Bennet, Artner and Fex74 Consequently, although the complex interactions between 5-HT and other satiety and appetite factors are not yet elucidated, nevertheless, the serotonergic system remains among the major targets for future anti-obesity drugs.
Disclosures
Donatella Marazziti, Laura Betti, Stefano Baroni, Lionella Palego, Federico Mucci, Barbara Carpita, Ivan Mirco Cremone, Ferruccio Santini, Laura Fabbrini, Caterina Pelosini, Alessandro Marsili, Enrico Massimetti, Gino Giannaccini, and Liliana Dell’Osso do not have any disclosures, and the coauthors do not have any affiliation with or financial interest in any organization that might pose a conflict of interest.
Authorship Contributions
D.M. and L.B.: conceived and designed the investigation; analyzed and interpreted the data; wrote the paper. G.G. and L.D.: conceived and designed the investigation; supervised the study and revised the final manuscript. F.S. and A.M.: conceived and designed the investigation; recruited subjects based on the inclusion/exclusion criteria; analyzed and interpreted the data. D.M., and L.D.: conducted the psychiatric interview. S.B., L.P., L.F., and C.P.: Designed the experiments and prepared the database; analyzed and interpreted the data; wrote the paper. S.B., L.F., and C.P.: supervised blood samplings and separated platelets; carried out experiments. F.M., B.C., I.M.C. and E.M.: participated to subjects’ selection; analyzed and interpreted the data.


