


Introduction
Faba bean (Vicia faba L.) is one of the earliest domesticated food legumes in the world, first cultivated in the Neolithic period (Metayer, Reference Metayer2004). In Tunisia, faba bean cultivation is common among traditional farmers, especially in Southern regions (Khaldi and Zekri, Reference Khaldi and Zekri2002). In recent years, the area under faba bean production has reduced due to low yield and yield instability (Gresta et al., Reference Gresta, Albertini, Raggi and Abbate2009), mostly as a result of environmental conditions and inefficient agronomical management.
Various studies have described genetic variations in local faba bean collections in the Mediterranean region using morphological traits (Zeid et al., Reference Zeid, Schon and Link2003; Terzopoulos et al., Reference Terzopoulos, Kaltsikes and Bebeli2003, Reference Terzopoulos, Kaltsikes and Bebeli2008; Terzopoulos and Bebeli, Reference Terzopoulos and Bebeli2008). Indeed, the morphological and agronomical evaluation of faba bean populations is imperative for effective exploitation in plant breeding schemes, as well as for their efficient conservation and management. The advent of molecular marker systems has provided new tools for evaluating faba bean germplasms and assessing genetic diversity (Zeid et al., Reference Zeid, Schon and Link2003; Terzopoulos and Bebeli, Reference Terzopoulos and Bebeli2008; Zong et al., Reference Zong, Ren, Guan, Wang, Liu, Paull and Redden2010; Gong et al., Reference Gong, Xu, Mao, Li, Hu, Zhang and Ding2011). Molecular markers are not affected by environmental factors or by developmental stages (Bebeli and Kaltsikes, Reference Bebeli, Kaltsikes, van Gastel, Pagnotta and Porceddu1993). Furthermore, molecular data can contribute to a more holistic picture of genetic diversity within a collection of populations (Curley and Jung, Reference Curley and Jung2004).
Genetic variability in V. faba populations is relatively high in Tunisia, and information on such variability is essential for their conservation, breeding and commercial production. Screening methods based on isozymes (Ouji et al., Reference Ouji, Suso, Rouaissi, Abdellaoui and El Gazzah2011a) and agromorphological (Ouji et al., Reference Ouji, Rouaissi, Abdellaoui and El Gazzah2011b) and biochemical (Chaieb et al., Reference Chaieb, Louis González, Lopez-Mesas, Bouslama and Valiente2011) traits have all been used previously to assess faba bean genetic diversity. However, molecular marker systems have proven particularly useful for evaluating germplasms and assessing genetic diversity (Zeid et al., Reference Zeid, Schon and Link2003; Terzopoulos and Bebeli, Reference Terzopoulos and Bebeli2008). Link et al. (Reference Link, Dixkens, Singh, Schwall and Melchinger1995) employed random amplified polymorphic DNA markers to study genetic diversity within European and Mediterranean faba bean germplasms. Zeid et al. (Reference Zeid, Schon and Link2003) used amplified fragment length polymorphism (AFLP) markers to assess genetic diversity among elite faba bean inbred lines, while Terzopoulos and Bebeli (Reference Terzopoulos and Bebeli2008) described the genetic diversity of 20 Greek faba bean local populations with inter-simple sequence repeat (ISSR) markers. However, simple sequence repeat (SSR) markers have been postulated to be of more relevance to faba bean germplasm characterization (Kaur et al., Reference Kaur, Pembleton, Cogan, Savin, Leonforte, Paull, Materne and Forster2012; Yang et al., Reference Yang, Bao, Ford, Jia, Guan, He, Sun, Jiang, Hao, Zhang and Zong2013), DNA fingerprinting and genetic mapping (Ma et al., Reference Ma, Bao, Yang, Hu, Quan, He, Wang, Wan, Sun, Jiang, Gong and Zong2013), due to their high information content, co-dominant and relatively simple-to-interpret properties (Powell et al., Reference Powell, Machray and Provan1996) and potential for analysis of intra-cultivar variability (Cipriani et al., Reference Cipriani, Marazzo, Marconi and Cimato2002; Lopes et al., Reference Lopes, Mendoca, Sefc, Sabino Gil and Da Camara Machado2004).
A previous study investigating faba bean populations from Southern Tunisia based on agromorphological traits (Yahia et al., Reference Yahia, Guetat, Elfalleh, Ferchichi, Yahia and Loumerem2012) did not reveal any population–geographical area interaction. However, some traits proved useful for the classification of populations. The aim of the present study was to describe genetic diversity and population structure of local faba bean germplasms from Tunisia using SSR markers. Our results provide a framework for future studies aimed at the conservation, improvement and management of cultivated faba bean in Tunisia.
Materials and methods
Plant material
The germplasm studied consisted of 16 southern Tunisian faba bean local populations from the collection described by Yahia et al. (Reference Yahia, Guetat, Elfalleh, Ferchichi, Yahia and Loumerem2012). Populations have been traditionally divided into Vicia faba minor, Vicia faba equina and Vicia faba major on the basis of seed weight. Accordingly, based on the criteria proposed by Henelt (cited by Lawes et al. (Reference Lawes, Bond, Poulsen and Hebblethwaite1983)) and Duc (Reference Duc1997), ten of the populations were classified as major (MR1, MR3, MD1, MD2, MD3, MD4, BK1, TF1, FRT and TZ2), five as equina (MR2, TF2, BK2, HMG and TZ1) and one as minor (MD5). The commercial varieties ‘Aguadulce’ and ‘Super Aguadulce’ (equina Var.) were used as references, coded, respectively, as AGD and SAG. The population codes, localities of origin and 1000-seed weight of each entry are listed in Table 1. Each population was represented by randomly selected pools of individual plants.
Table 1 Geographical data and 1000-seed weight of Vicia faba L. populations collected from the oases of Southern Tunisia

aCommercial varieties (Aguadulce ‘AGD’ and Super Aguadulce ‘SAG’).
DNA extraction and polymerase chain reaction (PCR) procedure
Nucleic acid extraction
Samples (2–3 g) of very young, healthy leaf tissue harvested from each bulk of three plants were lyophilized and kept at − 20°C. Due to the high anthocyanin content of faba bean leaf tissue, genomic DNA extraction was carried out using the protocol described by Sreelakshmi et al. (Reference Sreelakshmi, Gupta, Bodanapu, Chauhan, Hanjabam, Thomas, Mohan, Sharma, Srinivasan and Sharma2010). DNA quality was tested using 1% agarose gel electrophoresis and DNA concentration was determined spectrophotometrically. DNAs of all the samples were diluted to 5 ng/μl using sterile PCR-grade water.
SSR genotyping
Twenty-four SSR markers previously developed by Zeid et al. (Reference Zeid, Mitchell, Link, Carter, Nawar, Fulton and Kresovich2009) were employed in the present study, of which 16 were polymorphic (Table 2). The SSR primers were synthesized by Invitrogen (Bacelona, Spain). A 20-nucleotide sequence from the M13 cloning vector (5′-CACGACGTTAAAACGACC-3′) was attached to the 5′ end of each forward primer to incorporate fluorescent dyes during the PCRs by adding oligonucleotides complementary to the M13 cloning vector sequence labelled with 6-FAM (6-carboxyfluorescein), NED, PET or VIC (Applied Biosystems, Foster City, USA) (Schuelke, Reference Schuelke2000). PCRs were carried out in a total volume of 25 μl, containing 2.5 μl of 10 × PCR buffer, 0.6 mM of dNTPs, 3 mM of MgCl2, 0.5 μM of each primer (forward and reverse), 0.3 μM of labelled primer, 1 unit of Taq polymerase (ECOTAQ; Ecogen srl, Barcelona, Spain) and 50 ng of genomic DNA.
Table 2 Information on polymorphic simple sequence repeat markers detected among the studied faba bean genotypes

PIC, polymorphism information content.
PCRs were carried out in a Robocycler Gradient 96 thermocycler (Stratagene, La Jolla, CA, USA) using the following cycling profile: a denaturation step at 94°C for 5 min, followed by 35 cycles of a denaturation step at 95°C for 30 s, annealing at 52°C for 30 s and extension at 72°C for 45 s. After the last cycle, a final elongation step of 72°C for 5 min was included. PCR products were visualized using the 3130xl Genetic Analyzer (Applied Biosystems). The loading mixture contained 0.5 μl of PCR product, 0.5 μl of 500 LIZ® Size Standard (Applied Biosystems) and 12 μl of Hi-Di™ formamide (Applied Biosystems). Band molecular sizes were determined using Genemapper 3.0 (Applied Biosystems).
Statistical analysis
Summary statistics including the allele number, major allele frequency and polymorphism information content (PIC) were calculated for each primer (Table 2) using PowerMarker version 3.25 (Liu and Muse, Reference Liu and Muse2005). The same program was employed to calculate genetic diversity (H e), number of effective alleles (N e), heterozygosity (H o), percentage of polymorphic loci (P), PIC and fixation index (F is) for each population. Analysis of molecular variance (AMOVA) was conducted for 56 individuals sampled from 18 faba bean populations using 16 SSR markers.
Genetic distance (GD) between the genotypes (Nei, Reference Nei, Nei and Koehn1983) was estimated using PowerMarker version 3.25, and neighbour-joining (NJ) trees were constructed using MEGA 4 (Kumar et al., Reference Kumar, Nei, Dudley and Tamura2008). Factorial correspondence analysis (FCA) based on allele frequencies was carried out using NTSYS-PC version 2.1 (Rohlf, Reference Rohlf1997).
Results
Microsatellite genotyping
Of the 24 tested SSR markers, 16 were polymorphic in the germplasm collection studied. A total of 50 alleles were observed. The number of alleles per marker ranged from 2 to 6, with an average of 3 (Table 2). SSR marker M34 exhibited the highest major allele frequency (0.69), whereas SSR marker M4 exhibited the lowest (0.34). The PIC value of the 16 SSRs ranged from 0.33 to 0.68, with an average of 0.51.
Genetic diversity within and among the faba bean populations
The percentage of polymorphism within the faba bean populations varied from 80.6 (TZ1) to 95.0% (MR1 and BK2) with an average of 91.1% (Table 3), excluding the eight SSRs found to be monomorphic in all accessions. The genetic diversity value ranged from 0.34 (TZ1) to 0.50 (MR1 and BK2). The heterozygosity value ranged from 0.16 (TZ1) to 0.38 (MD4).
Table 3 Parameters of genetic variability in faba bean populations based on 16 simple sequence repeat markers

H e, genetic diversity; N e, mean number of effective alleles; H o, heterozygosity; P, percentage of polymorphic loci; PIC, polymorphism information content; F is, fixation index.
The highest PIC values were observed for the MR1 population (0.43), originating from Mareth (Gabes) province, followed by the BK2 (0.42) and BK1 (0.41) populations, both from Beni Khedache (Medenine) province. The lowest PIC value was detected within the TZ1 population from Tozeur province (0.28). Mean effective allele values were found to be highest for the MR1 and BK2 populations (N e= 2.50), followed by the BK1, MD2, MD5 and MR2 populations (2.43). For all the other populations, N e values ranged from 1.93 to 2.37.
Fixation index (F is), or the differentiation of individuals within populations, was quite high (mean F is= 0.36) for all populations, indicating that the degree of selfing may be high within these populations (Table 3).
The AMOVA revealed that the majority of the observed genetic variability was among individuals with subpopulation variation (53.8%). There was a significant amount of variation (8.7%) among the faba bean populations based on geographical origin. Variation among the subpopulations within populations accounted for 7.6% of the total variation (Table 4).
Table 4 Data from analysis of molecular variance for 56 individuals sampled from 18 populations of faba bean using 16 simple sequence repeat markers
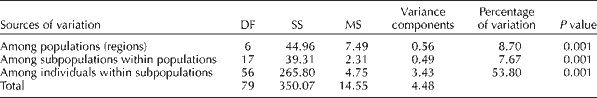
DF, degree of freedom; SS, sum of squares; MS, mean squares.
SSR data were used to establish genetic relationships among the faba bean populations, analysed using Nei's GD (Nei, Reference Nei, Nei and Koehn1983). On the whole, GDs among the faba bean populations analysed in this study varied from 0.06 to 0.42. For the most closely related populations, GDs were 0.06 (TF1 and TF2) and 0.07 (AGD and SAG and MD4 and MD5). For the most divergent populations, GDs were 0.38 (MD1 and FRT) and 0.42 (MD1 and TZ1) (Table S1, available online). The GD between members from the same geographical site was lower than that between individuals from different geographical sites.
Cluster analysis
SSR data were used to construct a NJ tree based on pairwise GDs (Fig. 1). The populations resolved into two major clusters, reflecting their regional or geographical origin: populations from Medenine (MD4, MD5, MD3, MD1 and MD2), Mareth (Gabes) (MR2, MR1 and MR3) and Beni Khedache (Medenine) (BK1 and BK2) clustered together, whereas the eight remaining populations from four different localities [HMG (Hamma-Gabes), TF2 and TF1 (Tafartassa-Gafsa), TZ1 and TZ2 (Tozeur), FRT (Tataouine) and both commercial populations SAG and AGD] formed a separate cluster.

Fig. 1 Unrooted neighbour-joining tree depicting relationships among faba bean germplasms and commercial varieties (Aguadulce and Super Aguadulce) based on Nei et al.'s (Reference Nei, Nei and Koehn1983) genetic distance computed from simple sequence repeat marker frequencies (value of seed weight given in brackets in g).
Factorial correspondence analysis
Three FCA axes explained 32.7% of the total genetic variability (Fig. 2). The first and second axes, which accounted for 24.5% of the variance, clearly separated the Beni Khedache (BK1 and BK2), Medenine (MD1, MD2, MD3, MD4 and MD5) and Mareth (MR1, MR2 and MR3) germplasms with a south-eastern origin from the other group with mostly south-western origin together with the AGD and SAG varieties. FCA, similar to the NJ tree, revealed a higher variability within the south-western germplasm than within the south-eastern germplasm.

Fig. 2 Multivariate analysis (factorial correspondence analysis) of simple sequence repeat data for 16 faba bean germplasms from Southeastern ● and Southwestern ○ Tunisia and commercial varieties Aguadulce and Super Aguadulce ▲.
Discussion
In the present study, we used SSRs to examine genetic diversity in a collection of faba bean germplasms from Southern Tunisia and identified a relatively high degree of genetic variability in the collection. Genetic diversity scores were found to be higher at the intragroup level than at the inter-group level, with a positive fixation index. These results indicate partial cross-pollination, as expected, for local faba bean populations due to their partially allogamous nature. Indeed, previous studies have shown that Mediterranean-type populations are mixtures of V. faba minor, V. faba equina and V. faba major (Link et al., Reference Link, Schill, Barbera, Cubero, Filippetti, Stringi, von Kittlitz and Melchinger1996; Yahia et al., Reference Yahia, Guetat, Elfalleh, Ferchichi, Yahia and Loumerem2012) and that, more generally, faba bean populations represent heterogeneous mixtures of inbreds and hybrids (Terzopoulos et al., Reference Terzopoulos, Kaltsikes and Bebeli2008). Collectively, these results are in accordance with those reported by Hamrick and Godt (Reference Hamrick, Godt, Brown, Clegg, Kahler and Weir1990), who stated that reproductive biology is the most important factor determining the genetic structure of plant populations and that out-crossing maintains most of the genetic variation within populations rather than among populations. Similarly, Gabriella et al. (Reference Gabriella, Angel a and Domenico1996) confirmed that intrapopulation diversity was higher than inter-population diversity in out-crossing plants. High levels of intrapopulation variance have been revealed previously in faba bean populations using ISSR (Terzopoulos and Bebeli, Reference Terzopoulos and Bebeli2008; Wang et al., Reference Wang, Zong, Guan, Yang, Sun, Ma and Redden2012) and isozyme markers (Sonnante et al., Reference Sonnante, Piergiovanni and Pignone1997; Ouji et al., Reference Ouji, Suso, Rouaissi, Abdellaoui and El Gazzah2011a), as well as in other out-crossed species such as soybean (Glycine max) (Jin et al., Reference Jin, He and Lu2006), Lathyrus populations (Belaid et al., Reference Belaid, Chtourou- Chorbel, Marrakchi and Trifi-Farah2006) and Haloxylon ammodendron (Sheng et al., Reference Sheng, Zheng, Pei and Ma2005). In crops, such results could be attributed to the lack of genetic material exchange between farmers, use of traditional cultivation methods (e.g. no mechanical harvesting) and consecutive cycles of inbreeding and selection carried out over a long period by farmers. It has been suggested that traditional cultivation practices may have led to increased genetic homogeneity within populations, which was higher than that reported for Spanish bean landraces (Alvarez et al., Reference Alvarez, Sáenz de Miera and Pérez de la Vega1998) and Greek wheat landraces (Mantzavinou et al., Reference Mantzavinou, Bebeli and Kaltsikes2005).
The NJ tree clustered genotypes into two main groups, correlating well with geographical origin and seed weight. The first cluster included ten faba bean populations from three provinces in geographical proximity: Mareth (Gabes), Beni Khedache (Medenine) and Medenine. This group represented faba bean populations from Southeastern Tunisia, with the exception of MD5, and represented populations with the heaviest seeds. The second cluster included eight faba bean populations originating from Southwestern Tunisia and represented populations with the lowest seed weights. The Aguadulce and Super Aguadulce varieties clustered within group 2, had medium-weight seeds, and were classified as V. faba L. Var. equina (Ouji et al., Reference Ouji, Rouaissi, Abdellaoui and El Gazzah2011b). The grouping structure identified in this study using SSR data was in good agreement with previous results based on morphological characters (Yahia et al., Reference Yahia, Guetat, Elfalleh, Ferchichi, Yahia and Loumerem2012), in which 1000-seed weight was found to be the most discriminate descriptor, subdividing faba bean populations into three groups (minor, equina and major types). High correlations between molecular markers and morphological traits have been reported in other plant species, such as maize (Karanja et al., Reference Karanja, Amugune, Ininda, Kimatu and Danson2009) and Bromus tectorum (Ramakrishnan et al., Reference Ramakrishnan, Meyer, Waters, Stevens, Coleman and Fairbanks2004). In the present study, the observation that seed weight correlates well with genetic differentiation confirms that seed weight could represent a key morphological trait for the classification of faba bean germplasms. Indeed, previous morphological classifications of faba bean populations have depended mainly on 1000-seed weight, in combination with additional traits such as number of flowers per raceme, number of pods per truss, pod width, number of ovules per pod (including seeds) and stems per plant (Yahia et al., Reference Yahia, Guetat, Elfalleh, Ferchichi, Yahia and Loumerem2012). Similar results correlating genetic variation with seed traits have been reported in other crops. For example, Pradhan et al. (Reference Pradhan, Plummer and Yan2004) showed that genotype was clearly correlated with phenotypic variability of seed traits in radish cultivars. Similarly, Johnson et al. (Reference Johnson, Menendez, Nodari, Koinange, Magnusson, Singh and Gepts1996) reported that the Phs locus in Phaseolus vulgaris accounted for 18–33% of total phenotypic variation in seed weight. Using the AFLP markers, Fatokun et al. (Reference Fatokun, Menancio-Hautea, Danesh and Young1992) showed that two unlinked genomic regions in cowpea contained Quantitative Trait Loci (QTLs) accounting for 52.7% of the variation in seed weight and that four unlinked genomic regions in mung bean accounted for 49.7% of the variation in seed weight.
Understanding genetic relationships among varieties can be particularly useful for planning crosses, defining heterotic pools and assigning lines to specific heterotic groups (Hallauer and Miranda, Reference Hallauer and Miranda1988). Furthermore, knowledge of genetic diversity is of critical importance for plant genetic resource management in gene banks, facilitating reliable classification of accessions, detection of duplicates and identification of useful accessions for specific breeding purposes (Engels et al., Reference Engels, Ramanatha, Brown and Jackson2002; Mohammadi and Prasanna, Reference Mohammadi and Prasanna2003). In general, very few studies have investigated genetic diversity in faba bean populations from Tunisian oasis agroecosystems. For the effective conservation of faba bean germplasms and breeding, as well as for utilization in oasis agroecosystems, analysis and documentation of genetic diversity are essential. This study represents a critical component towards safeguarding Tunisian faba bean germplasms and will help inform the development of new varieties adapted to the environmental conditions of Southern Tunisia.
Supplementary material
To view supplementary material for this article, please visit http://dx.doi.org/10.1017/S1479262114000021
Acknowledgements
The authors thank Professor Francisco Madueno from Instituto de Biología Molecular y Celular de Plantas (IBMCP), Universidad Politécnica de Valencia (UPV)-Consejo Superior de Investigaciones Científicas (CSIC), for providing financial support for this study. The authors also thank Professor Robert L Jarret (Bob) from United States Department of Agriculture (USDA/ARS/PGRU), Griffin, USA, for providing help with the language aspects of the manuscript.


