


1 Introduction
Bubbles are present in many environmental and industrial systems. Their surface in contact with the liquid enables transfers (of heat and mass) with the bulk (Clift, Grace & Weber Reference Clift, Grace and Weber1978), which finds its application in numerous processes (waste water treatment, chemical reactors, etc.). Besides, by their dynamics, they may improve such transfers and mixing in the liquid through various mechanisms (Risso Reference Risso2018). In most situations, bubbles are millimetric (Reynolds number  $Re\geqslant 200$) and the agitation caused by these rising bubbles is to a large extent related to the potential flow disturbance created around the surface and the liquid on average dragged by the wake. Depending on the size, shape and degree of contamination of the bubbles, the wake may be more or less significant and stable, which has an influence on the liquid disturbance generated and the hydrodynamic interactions between bubbles. Knowledge of the behaviour of bubble wakes, more specifically of the near-wake behaviour where most transfers occur (Fan & Tsuchiya Reference Fan and Tsuchiya1990), is therefore of some importance regarding these problems. Also, the development of the far wake is interesting to investigate, since it may affect the bubbles or particles located behind.

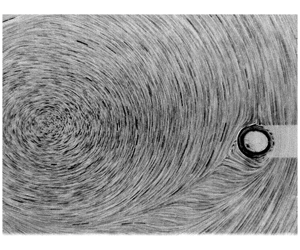
Figure 1. Two examples of wake imaging behind a bubble at equilibrium location (Rastello et al. Reference Rastello, Marié, Grosjean and Lance2009; Rastello, Marié & Lance Reference Rastello, Marié and Lance2017): (a) clean surface (no spinning),  $Re\approx 15$; and (b) contaminated surface (spinning),
  $Re\approx 120$.
We recently performed an experiment on the forces acting on bubbles immersed in a solid-body rotating flow around a horizontal axis (SBRH). In this flow, the bubble comes to an equilibrium location, the coordinates of which can give access to the coefficients of the drag and lift forces experienced by the bubble. Two situations were investigated: the case where the interface is clean (silicone oils (Rastello, Marié & Lance Reference Rastello, Marié and Lance2011)), and the case where the interface is partially or fully covered by impurities (water (Rastello et al. Reference Rastello, Marié, Grosjean and Lance2009, Reference Rastello, Marié and Lance2017)). The fact that the bubble is stationary is convenient to image the flow around it and in particular the wake behind as seen in figure 1. When the surface is contaminated, and only in that case, it was shown to rotate with characteristics that are very similar to those of solid spheres immersed in that kind of flow (Bluemink et al. Reference Bluemink, Lohse, Prosperetti and Van Wijngaarden2008, Reference Bluemink, Lohse, Prosperetti and Van Wijngaarden2010). This results in an extra ‘Magnus’-like lift force and a separated wake behind the bubble, whose separation angle (the angle from the bubble rear at which the wake detaches from the bubble) is higher than that observed at the same Reynolds number on a solid non-rotating sphere in a uniform flow (Johnson and Patel Reference Johnson and Patel1999). In the literature, the effect of a transverse rotation on the wake structure of a sphere was investigated in uniform flow (Giacobello, Ooi & Balanchandar Reference Giacobello, Ooi and Balanchandar2009; Poon et al. Reference Poon, Ooi, Giacobello, Iaccarino and Chung2014) and more scarcely in linear shear flow (Kurose & Komori Reference Kurose and Komori1999; Bagchi & Balachandar Reference Bagchi and Balachandar2002). Information about this question in solid rotating flows is even more scarce. The available data, ours (Rastello et al. Reference Rastello, Marié, Grosjean and Lance2009) and those of Bluemink et al. (Reference Bluemink, Lohse, Prosperetti and Van Wijngaarden2010), give an estimate of the flow region that is affected by the wake and show that it may deflect strongly when the bubble is close to the cylinder axis. However, these results obtained by using particle image velocimetry (PIV) visualization techniques with seeding particles remain limited.
The objective of this paper is thus to provide a more detailed experimental description of the wake characteristics, as a function mainly of the Reynolds number, itself linked to the rotation rate of the tank. This mostly concerns bubbles in water whose surface is partially covered by impurities. A few results on bubbles with ‘fully’ contaminated surface are given for comparison. For an easy reading, we first briefly present the facility, the experimental procedure and the range of parameters investigated. The details can be found in our previous papers. We then define the wake characteristics on which we focus our study and make precise the way they were determined. The results obtained are analysed in terms of the non-dimensional numbers relevant for the effect we look at. The far wake is first addressed followed by the near wake. The paper ends with a conclusion.

Figure 2. Experimental optical set-up. (a) Force measurements. The position, size and shape of the bubble are determined from images recorded with a backlight on a fast camera located in front of the tank. (b) Surrounding flow investigation. The surface spinning and the wake behind the bubble at its equilibrium position are visualized with a laser sheet as shown. With this lighting, a shadow appears behind the bubble on the bubble side that is opposed to the laser source. The fast camera (not visible in the figure) is still positioned in front of the tank.
2 Experimental procedure
2.1 Brief description of the experiment
A more detailed description can be found in our aforementioned papers. Readers who would like further information on the device that is used are invited to refer to appendix A, where two technical schematics showing the mechanical components are given. The experiment is conducted in a Plexiglas cylindrical tank (Ø = 10 cm,  $L=10~\text{cm}$) rotating around a horizontal axis (figure 2a). The tank is mounted in a cylindrical counterbore and the contact is made using ball bearings (appendix A). An 80 W brushless electric motor is coupled to the tank using a toothed belt. The motor is driven through a Labview interface so as to obtain the best torque/speed control. This ensures that the assigned rotation speed is well reproduced and constant. This was checked by an optical tachometer. The facility is fixed on a damped heavy metallic casing so that no perturbing vibration is experienced by the flow. The tank is filled with demineralized water characterized by a resistivity of
  $0.3~\text{M}\unicode[STIX]{x03A9}~\text{cm}$. This resistivity is between that of ultra-purified water,
  $18~\text{M}\unicode[STIX]{x03A9}~\text{cm}$ (Duineveld Reference Duineveld1995), and that of tap water,
  $3~\text{k}\unicode[STIX]{x03A9}~\text{cm}$. Because of operating constraints (bubble injection using a syringe, plunging of a thermometer for temperature measurements), it was extremely difficult to keep this water clean. Practically, it contains contaminants that are mainly solid impurities and/or traces of tensio-actives.
When injecting the bubble with the syringe, a first-order estimate of the volume and diameter of the bubble is obtained. The precise determination will then be achieved through the interface detection on the collected images. When the flow is in solid-body rotation at a constant speed, all the forces acting on the bubble balance and the bubble comes to an equilibrium point (figure 3). For the bubbles considered in this study, which have moderate to large Reynolds numbers, this force balance can be written as
 $$\begin{eqnarray}\boldsymbol{F}_{B}+\boldsymbol{F}_{A}+\boldsymbol{F}_{D}+\boldsymbol{F}_{L}=0.\end{eqnarray}$$
 Here  $\boldsymbol{F}_{B}$ is the buoyancy;
  $\boldsymbol{F}_{A}$ is the sum of the added-mass and the inertial forces, the inertial force corresponding to the pressure gradient in the fluid and also called the pressure gradient force;
  $\boldsymbol{F}_{D}$ is the drag force; and
  $\boldsymbol{F}_{L}$ the lift. As
  $\boldsymbol{F}_{B}$ and
  $\boldsymbol{F}_{A}$ are known analytically, the lift
  $C_{L}$ and drag
  $C_{D}$ coefficients can be readily deduced from the measured polar coordinates (
 $r_{e},\unicode[STIX]{x1D703}_{e}$) of the centre of the bubble at equilibrium, the rotation speed of the tank
  $\unicode[STIX]{x1D714}$ and the equivalent diameter
  $d$ of the bubble. The diameter
  $d$ is directly the diameter of the bubble for a spherical bubble, while for slightly ellipsoidal ones,
  $d$ is the diameter of a sphere of identical volume accounting for their oblate spheroidal shape (Rastello et al. Reference Rastello, Marié and Lance2011). The aspect ratio
  $\unicode[STIX]{x1D712}$ of the deformed bubbles investigated in this paper
  $(Re\leqslant 500)$ never exceeds 1.1 (Rastello et al. Reference Rastello, Marié and Lance2017), making the resulting uncertainty negligible. The bubble centroid is always the barycentric position. The bubble at equilibrium is illuminated from behind and imaged with a Phantom V4.3 high-speed camera positioned in front of the tank (figure 2a).

Figure 3. The forces applied to a bubble at equilibrium at moderate to high Reynolds numbers (Rastello et al. Reference Rastello, Marié, Grosjean and Lance2009). Here  $\boldsymbol{F}_{B}$ is the buoyancy force,
  $\boldsymbol{F}_{D}$ the drag force,
  $\boldsymbol{F}_{L}$ the lift force, and
  $\boldsymbol{F}_{A}$ is the sum of the added-mass and inertial forces. In this diagram, the angular velocity
  $\unicode[STIX]{x1D714}$ and equilibrium angle
  $\unicode[STIX]{x1D703}_{e}$ are negative.
The non-dimensional numbers used to describe the flow are the Reynolds number  $Re=|v-U|d/\unicode[STIX]{x1D708}$ and the Rossby number
  $Ro=|v-U|/\unicode[STIX]{x1D714}d$ (equal to the inverse of the local shear rate
  $S$) for spherical bubbles, plus the Weber number
  $We=\unicode[STIX]{x1D70C}|v-U|^{2}d/\unicode[STIX]{x1D70E}$ for deformed bubbles. The Morton number
  $Mo=g\unicode[STIX]{x1D708}^{4}\unicode[STIX]{x1D70C}^{3}/\unicode[STIX]{x1D70E}^{3}$ for experiments in water is constant, equal to
  $2.5\times 10^{-11}$. When the bubble is at equilibrium, its velocity is
  $v=0$ and the liquid velocity it sees is
  $U=\unicode[STIX]{x1D714}r_{e}$, so that the non-dimensional numbers simplify as
  $Re=\unicode[STIX]{x1D714}r_{e}d/\unicode[STIX]{x1D708}$,
  $Ro=r_{e}/d$ and
  $We=\unicode[STIX]{x1D70C}\unicode[STIX]{x1D714}^{2}r_{e}^{2}d/\unicode[STIX]{x1D70E}$. The ranges of non-dimensional numbers investigated in the two sets of experiments with water are reported in table 1. The rotation rate for the tank is constant, with a value that varies from
  $6~\text{rad}~\text{s}^{-1}$ to
  $21~\text{rad}~\text{s}^{-1}$, while the equivalent bubble diameter ranges from
  $0.5~\text{mm}$ to
  $3.3~\text{mm}$. Rossby numbers
  $Ro\leqslant 5$ were not investigated, because they correspond to situations where bubbles are too close to the centre of rotation (less than five diameters) and destabilize the rotational flow (Rastello et al. Reference Rastello, Marié, Grosjean and Lance2009).
Table 1. Fluid properties – parameter ranges.

a Exp1, Rastello et al. (Reference Rastello, Marié, Grosjean and Lance2009); Exp2, Rastello et al. (Reference Rastello, Marié and Lance2017).
2.2 Wake visualization – determination of boundaries
As described in Rastello et al. (Reference Rastello, Marié, Grosjean and Lance2009, Reference Rastello, Marié and Lance2017), the flow around the bubble has been visualized by seeding the fluid with micrometric fluorescent polymer particles (Duke Scientific Corporation,  $\text{size}=3~\unicode[STIX]{x03BC}\text{m}$,
  $\text{density}=1.05~\text{g}~\text{cm}^{-3}$). Particles are illuminated with a laser sheet and imaged with the high-speed camera (figure 2b). Most of them tag the flow around the surface and the wake, while a small fraction collects at the surface where they materialize the rotation of the surface. The frame rate is selected such as to follow the particles rotating with the surface with a good accuracy, for example so that a minimum of 50 images are acquired per full spin. As a consequence, its precise value (between 100 and 200 frames per second) depends on the rotation rate of the tank. A typical example of instantaneous images thus recorded is shown in figure 1(b). Two regions can be distinguished behind the bubble: the near wake located close to the spinning surface, where particle velocity is low and the streamlines not well visible for that reason; and the far wake, where particles having a higher velocity look like small segments and thus better mark the streamlines. This is precisely the criterion that we use to separate the two regions. The visualization of the streamlines in the near wake was made possible by averaging between five and 10 successive images, depending on the sharpness and the contrast of the sequence processed.

Figure 4. Bubble wake for  $Re=100,~Ro=7.7,~\unicode[STIX]{x1D6FA}^{\ast }=0.09$, equation (3.3): (a) streamlines obtained by averaging 10 successive frames; and (b) streamlines from averaging 20 PIV velocity vector fields.

Figure 5. Schematic of the wake region and its parameters. (a) Far wake (FW):  $l_{FW}$
= chord length,
$l_{FW}$
= chord length,  $s_{FW}$
= curvilinear length,
$s_{FW}$
= curvilinear length,  $\mathscr{S}_{FW}$
= area,
$\mathscr{S}_{FW}$
= area,  $\unicode[STIX]{x1D6FE}_{2}$
= deflection angle,
$\unicode[STIX]{x1D6FE}_{2}$
= deflection angle,  $\unicode[STIX]{x1D6FE}_{1}$
= streamline angle with the same
$\unicode[STIX]{x1D6FE}_{1}$
= streamline angle with the same  $l_{FW}$. (b) Near wake (NW):
  $l_{NW}$
= chord length,
$l_{NW}$
= chord length,  $\mathscr{S}_{NW}$
= area.
$\mathscr{S}_{NW}$
= area.
The result is shown in figure 4(a). The image has been inverted for better visualizing the streamlines. We see that the averaging enables to follow particles along their trajectories a longer time, hence to better visualize the streamlines and the wake boundaries. As a proof, the average image is compared with the streamlines obtained on the same sequence by using a standard LaVision PIV software (figure 4b). Except for the white region, the agreement between the two panels is particularly good. On the right-hand side of the bubble, the white region corresponds to the shadow visible in figure 4(a). This shadow is caused by the light sheet being intercepted by the bubble’s surface (figure 2b). The white region located in the upper right corner is due to a loss in the PIV velocity correlations resulting from the refraction of the laser sheet by the tank’s cylindrical shape. Neither of the two regions intersect the wake, and no specific effort was made to analyse them. Average images were therefore used in addition to instantaneous ones to visualize structures in the wake and identify its boundaries. It was not possible to do the same with PIV, because in many sequences concentration in seeding particles was not sufficient to obtain two-frame correlations of good enough quality for all regions of the flow. For each bubble, five representative instantaneous images are extracted from the full recording. On each image, wake boundaries are determined manually by delimiting both the instantaneous near wake and far wake. An average over the five instantaneous wakes is then performed for both the near and far wakes, giving average boundaries for each wake. The resulting wakes are then superimposed on the average images and PIV when available to confirm the accuracy of the boundaries. The characteristics that we investigated are presented on average images in the schematic in figure 5. They are obviously two-dimensional. No three-dimensional information on the wake structure can be inferred from this kind of visualization. An uncertainty analysis was undertaken to quantify the degree of accuracy of the method. The results are listed in table 2.
Table 2. Statistical uncertainties. Mean standard deviation of the surface of the far wake (column 1) and near wake (column 3) compared with the surface of the bubble. Mean standard deviation of the length of the chord for the far wake (column 2) and near wake (column 4) compared with the diameter of the bubble.
No important bias in the results is to be expected from the procedure of determination of the wake properties. In contrast, we were not able to estimate properly the separation angle at which the wake detaches from the bubble surface. The reason is that, in the range of  $Re$ investigated (mostly
  $Re\geqslant 50$), the points of the surface where it detaches are located very close to the horizontal equatorial plane of the bubble and almost diametrically opposed. The resolution of the visualization is not sufficient to identify their location at the surface precisely. This makes the accurate estimation of the separation angle from the centre of the bubble rather difficult and imprecise. None of the measured wake surfaces suffer from this lack of precision given that only a negligible surface is at stake. The separation angle defined from the rear point where the bubble spinning is maximum (figure 7 in Rastello et al. (Reference Rastello, Marié and Lance2017)) typically ranges between
  $75^{\circ }$ and
  $90^{\circ }$.
3 Results
The spinning of the bubbles partially covered by impurities is non-uniform, with a maximum in the rear region where the wake is separated (Rastello et al. Reference Rastello, Marié and Lance2017). Their mean spinning rate  $\bar{\unicode[STIX]{x1D6FA}}_{b}$ is higher than
  $\unicode[STIX]{x1D714}$ and increases with
  $Re$, without any clear
  $Ro$ dependence being visible over the range investigated. Its
  $Re$ variation is well approximated by
 $$\begin{eqnarray}\frac{\bar{\unicode[STIX]{x1D6FA}}_{b}}{\unicode[STIX]{x1D714}}=1.6-0.6\exp (-0.011Re),\end{eqnarray}$$
while the maximum spinning rate varies as
 $$\begin{eqnarray}\frac{\unicode[STIX]{x1D6FA}_{m}}{\unicode[STIX]{x1D714}}=1+0.15Re^{0.55}\end{eqnarray}$$
 and can be locally much higher than  $\bar{\unicode[STIX]{x1D6FA}}_{b}$. The effect of this spinning on the wake characteristics can be described through the non-dimensional rate
  $\unicode[STIX]{x1D6FA}^{\ast }$, defined as
  $(\bar{\unicode[STIX]{x1D6FA}}_{b}d/2)/U$, with
  $U=\unicode[STIX]{x1D714}r_{e}$. This non-dimensional rate quantifies the importance of the bubble spinning velocity relative to the upstream flow velocity.

Figure 6. Phase diagram ( $Re,Ro$): ▵, partially contaminated bubbles; ▴, fully contaminated bubbles. The dotted lines delimit the range of
  $Ro$ that covers the full
  $Re$ dependence.
The bubble spinning is induced by the vorticity of the flow at the equilibrium distance  $r_{e}$ to which the bubble stabilizes. This distance depends on the rotation rate of the tank
  $\unicode[STIX]{x1D714}$ and the particle diameter
  $d$. As a result,
  $Re$ and
  $Ro$ cannot be vary independently but according to a phase diagram (
 $Re,Ro$) given in figure 6. We see in this figure that the
  $Ro$ range that covers the full
  $Re$ dependence is limited to
  $6\leqslant Ro\leqslant 8.5$. Outside, small
  $Ro$ are mainly associated with large
  $Re$ (large
  $d$), while large
  $Ro$ with small
  $Re$ (small
  $d$). On the other hand, since bubbles are freely rotating,
  $\bar{\unicode[STIX]{x1D6FA}}_{b}$ and
  $U$ cannot be varied independently like in the simulations of Giacobello et al. (Reference Giacobello, Ooi and Balanchandar2009) or Poon et al. (Reference Poon, Ooi, Giacobello, Iaccarino and Chung2014). Our situation resembles the torque-free conditions investigated by Bagchi & Balachandar (Reference Bagchi and Balachandar2002) and Bluemink et al. (Reference Bluemink, Lohse, Prosperetti and Van Wijngaarden2010) and it follows that
  $\unicode[STIX]{x1D6FA}^{\ast }$ varies as
 $$\begin{eqnarray}\unicode[STIX]{x1D6FA}^{\ast }=\frac{1}{2}\frac{\bar{\unicode[STIX]{x1D6FA}}_{b}}{\unicode[STIX]{x1D714}}\frac{1}{Ro}.\end{eqnarray}$$
 As shown in figure 7(a), this non-dimensional spinning rate increases from 0.05 up to 0.15 with  $Re$, a range that is more restricted than the ones ([0–1]) generally covered by simulations. However, replacing
  $\bar{\unicode[STIX]{x1D6FA}}_{b}$ by
  $\unicode[STIX]{x1D6FA}_{m}$ in (3.3) yields an
  $\unicode[STIX]{x1D6FA}^{\ast }$ that may be locally higher: from 0.07 up to 0.55. The mean dependence of
  $\unicode[STIX]{x1D6FA}^{\ast }$ with
  $Re$ resembles that of
  $\bar{\unicode[STIX]{x1D6FA}}_{b}/\unicode[STIX]{x1D714}$, with the existence of a plateau at
  $Re>250$. The smallest values of
  $\unicode[STIX]{x1D6FA}^{\ast }$ are obtained when
  $Ro>8.5$ for the few moderate
  $Re$ numbers with large equilibrium distance
  $r_{e}$ compared to the bubble diameter. Note that it is more difficult to estimate
  $r_{e}$ and
  $d$ from the laser-sheet visualizations than from the shadow technique used for force measurements (§ 2.1). In some cases, the flow centre is not visible and
  $r_{e}$ then must be inferred from the streamlines in this region like in figure 9(a). On the other hand, the bubble surface looks more or less thick (figure 9d), which renders the accurate estimation of
  $d$ difficult. The uncertainty on the interface position is typically
  $\pm 2$ pixels for the small bubbles (
 ${<}1~\text{mm}$) and
  $\pm 6$ pixels for the big ones (
 ${>}1.5~\text{mm}$). This gives an uncertainty for
  $d$ of the order of 5 % for
  $Re\leqslant 100$ and of 10 % for
  $Re>100$.

Figure 7. (a) Non-dimensional rotation rate  $\unicode[STIX]{x1D6FA}^{\ast }$ as a function of
  $Re$. Partially contaminated bubbles:
  $\times$,
  $Ro<6$; ○,
  $6\leqslant Ro\leqslant 8.5$; ▫,
  $Ro>8.5$; solid line,
  $\unicode[STIX]{x1D6FA}^{\ast }=0.12$ (
 $1-\exp (-0.014Re)$). Fully contaminated bubbles, ▴. The dotted lines represent
  $0.05\unicode[STIX]{x1D6FA}^{\ast }$ increments. (b) Pressure gradient at bubble location
  $r_{e}$; same symbols.

Figure 8. The  $Re$ dependence of
  $d$ obtained in two ways. (1) By measuring
  $d$ and
  $r_{e}$ directly from the images taken with the backlight (force measurements): ○,
  $Ro\,<\,10$;
  $\times$,
  $Ro\geqslant 10$. (2) With
  $d$ measured from the laser sheet (bubble rotation and wake measurements) and
  $Re$ estimated by solving (3.5): ▫,
  $Ro<10$;
  $+$,
$+$,  $Ro\geqslant 10$; solid line,
  $0.0006+3.85\times 10^{-6}\,Re$; dotted line,
  $9.5\times 10^{-5}\,Re^{0.5}$.
All these difficulties influence the estimation of  $Re$ and
  $Ro$, which contributes to the spreading of the data. However, we tried to minimize the errors on these non-dimensional numbers by estimating them otherwise. When a bubble is at equilibrium,
 $$\begin{eqnarray}C_{D}=\frac{4}{3}\frac{gd\cos \unicode[STIX]{x1D703}_{e}}{r_{e}^{2}\unicode[STIX]{x1D714}^{2}}\end{eqnarray}$$
 with  $\cos \unicode[STIX]{x1D703}_{e}\approx 1$, and, as a result,
 $$\begin{eqnarray}C_{D}\approx \frac{4gd^{3}}{3Re^{2}\unicode[STIX]{x1D708}^{2}}.\end{eqnarray}$$
 With  $d$ being known from measurement,
  $Re$ can therefore be calculated by solving this equation. This has been done by taking the appropriate drag coefficient law inferred from our previous force measurements (equations (4.2) and (A1)–(A3) in Rastello et al. (Reference Rastello, Marié and Lance2017)) and using a MATLAB solver. With this method, the uncertainty on
  $Re$ can be reduced to
  $10\,\%$ for spherical bubbles and
  $15\,\%$ for deformed ones. Its efficiency is shown in figure 8, where the
  $Re$–
$Re$– $d$ dependence obtained from the images taken with the backlight (force measurements) is compared to that with
  $d$ measured from the laser sheet (bubble rotation and wake measurements) and
  $Re$ estimated by solving (3.5). Then
  $Ro$ can be deduced from
  $d$ and
  $Re$ as
 $$\begin{eqnarray}Ro=\frac{\unicode[STIX]{x1D708}Re}{\unicode[STIX]{x1D714}d^{2}},\end{eqnarray}$$
 yielding an uncertainty of the order of  $20\,\%$ for the spherical bubbles and
  $30\,\%$ for the deformed ones. This explains why the data scattering is more accentuated in
  $Ro$ than in
  $Re$.
$Re$.
Examples of bubble wakes for increasing  $Re$ at two given
  $Ro$ values (
 $Ro\approx 7.3$ and
  $Ro\approx 11$) are displayed in figures 9 and 10, respectively.

Figure 9. Bubble wake for increasing  $Re$ numbers and
  $Ro\approx 7.3$: (a)
  $Re=49,Ro=7.2,\unicode[STIX]{x1D6FA}^{\ast }=0.08$; (b)
  $Re=102,Ro=7.2,\unicode[STIX]{x1D6FA}^{\ast }=0.10$; (c)
  $Re=179,~Ro=7.4,\unicode[STIX]{x1D6FA}^{\ast }=0.11$; (d)
  $Re=313,Ro=7.4,\unicode[STIX]{x1D6FA}^{\ast }=0.11$.

Figure 10. Bubble wake for increasing  $Re$ and
  $Ro\approx 11$: (a)
  $Re=34$,
  $Ro=11.9$,
 $\unicode[STIX]{x1D6FA}^{\ast }=0.05$; (b)
  $Re=47,Ro=10.8,\unicode[STIX]{x1D6FA}^{\ast }=0.07$; (c)
  $Re=68,Ro=10.8,\unicode[STIX]{x1D6FA}^{\ast }=0.06$; (d)
  $Re=109,Ro=10.7,\unicode[STIX]{x1D6FA}^{\ast }=0.07$.
3.1 Wake behaviour – general trends
In a uniform flow, the wake behind a stationary non-rotating sphere separates for  $Re\approx 24$ (Taneda Reference Taneda1956), becomes non-axisymmetric above
  $Re\approx 212$ and unsteady for
  $Re>274$ (Johnson and Patel Reference Johnson and Patel1999). Here separation also occurs at small
  $Re$ (figure 10a), but the near and far wake in the steady regime are not axisymmetric. The high-velocity flow arriving on the right-hand side of the bubble rotates with the spinning surface around the bubble rear and moves upwards on the left side (figure 10d) till it is pushed downwards by the downstream flow on the low-velocity side, there forming a high-shear layer. This causes the stagnation point observed behind the bubbles in the clean situation (figure 1a) to displace upwards on the low-velocity side of the bubble. This trend clearly appears on the PIV data in figure 4(b) and is consistent with those reported in a uniform flow (Giacobello et al. Reference Giacobello, Ooi and Balanchandar2009; Poon et al. Reference Poon, Ooi, Giacobello, Iaccarino and Chung2014). On the other hand, separation angles are much higher than those observed at the same
  $Re$ on solid spheres in uniform flows (Johnson and Patel Reference Johnson and Patel1999). As explained in Rastello et al. (Reference Rastello, Marié and Lance2017), this may result from the fact that bubbles are partially contaminated and spinning. It is worth noting that it is difficult to accurately delimit the regions or recirculation in the near wake, unlike in simulations. Whatever
  $Ro$, we see that the increase of
  $\unicode[STIX]{x1D6FA}^{\ast }$ with
  $Re$ increases the curvature of the streamlines in the near wake. At the same time, the near wake is reduced and even vanishes at high
  $Re$ and
  $\unicode[STIX]{x1D6FA}^{\ast }$.
The far wake, whose length increases with  $Re$, deflects more or less towards the rotation axis. For a given
  $Re$ (compare figure 9(a) with figure 10(b), and figure 9(b) with figure 10(d) or 11 for a direct comparison), the deflection is more pronounced for the small
  $Ro$ (small distances from the centre). This can be attributed to two effects. One is the bubble spinning, since
  $\unicode[STIX]{x1D6FA}^{\ast }$ is then higher (figure 7a). The other is the radial pressure gradient
  $\unicode[STIX]{x2202}P/\unicode[STIX]{x2202}r$, which is also higher at small distances (figure 7b). In a rotating flow,
  $\unicode[STIX]{x2202}P/\unicode[STIX]{x2202}r$ is equal to
  $\unicode[STIX]{x1D70C}u_{\unicode[STIX]{x1D703}_{e}}^{2}/r_{e}$, with
  $u_{\unicode[STIX]{x1D703}_{e}}$ the angular velocity. This means that, for a given pressure gradient, the retarded fluid in the wake adopts a smaller radius (Bluemink et al. Reference Bluemink, Lohse, Prosperetti and Van Wijngaarden2010) and, as a result, the wake may deflect towards the cylinder axis. Our few wake visualizations in silicone oils (non-spinning bubbles (Rastello et al. Reference Rastello, Marié and Lance2011)) show that this effect is indeed visible when a bubble is not spinning. However, deflections in this case remain weak even at small distance from the centre. The reason is that the Reynolds numbers investigated are low (
 $Re\leqslant 20$) and the wakes are thin and purely laminar. From such data, it not easy to estimate the importance of a radial pressure gradient on the wake deflection, when the wake is separated and the bubble is spinning.

Figure 11. Wake deflection as a function of  $Ro$ at comparable
  $Re$: (a)
  $Re=49,Ro\approx 7.3$; (b)
  $Re=47,Ro\approx 11$; (c)
  $Re=102,Ro\approx 7.3$; (d)
  $Re=109,Ro\approx 11$.
The far-wake deflection and the bubble spinning seem to delay the transition at which vortex shedding generally occurs for a stationary sphere in uniform flow ( $Re>274$). This appears in figure 9(d) where
  $\unicode[STIX]{x1D6FA}^{\ast }$ is significant (
 ${\approx}0.11$) and where, for
  $Re\approx 300$ and
  $Ro\approx 7.4$, no clear vortex shedding signature can be detected. This trend is to some extent reminiscent of the findings of Giacobello et al. (Reference Giacobello, Ooi and Balanchandar2009) and Kim (Reference Kim2009), who showed that the rotation of a sphere may trigger or suppress vortex shedding depending on the
  $Re$ and
  $\unicode[STIX]{x1D6FA}^{\ast }$ considered. For large
  $Re$ (figure 12), the low-velocity side of the wake begins to oscillate. This behaviour has some common features with the wake instability of Kelvin–Helmholtz type noted by Giacobello et al. (Reference Giacobello, Ooi and Balanchandar2009) and Poon et al. (Reference Poon, Ooi, Giacobello, Iaccarino and Chung2014) on a rotating sphere at high
  $Re$ and
  $\unicode[STIX]{x1D6FA}^{\ast }$. The maximum rotation rate
  $\unicode[STIX]{x1D6FA}^{\ast }$ being locally very high, the shear in the layer developing on the low-velocity side of the bubble where the surface turns against the flow (the advancing side of the sphere in Giacobello et al. (Reference Giacobello, Ooi and Balanchandar2009) and Poon et al. (Reference Poon, Ooi, Giacobello, Iaccarino and Chung2014)) drastically increases, and we can reasonably think that it destabilizes the layer. In comparison, the high-velocity side where the shear is much smaller, since the surface turns with the flow, looks constantly more steady. These high
  $Re$ numbers correspond to a range where bubbles are slightly deformed (aspect ratio
  ${\approx}1.1{-}1.2$) and undergo small-amplitude circular precession motions around their equilibrium position, due to the wake instability. The near wake is then reducing towards disappearing. As it reduces to a thin layer of fluid behind the bubble, the precession induces a periodic pinching of the near wake that splits it into two rather symmetrical parts attached to each side of the wake. A small recirculation can be observed inside the two regions of the near wake thus formed (figures 9(d) and 12). For this very specific situation, it is not possible to estimate a chord length
  $l_{NW}$. The surface of this split near wake
  $\mathscr{S}_{NW}$ (blue symbols in the near-wake figures) can still be defined but takes on a special meaning.

Figure 12. Large bubble:  $Re=560$. The high-velocity side of the wake remains steady (lower yellow line). The low-velocity side of the wake exhibits an oscillation (upper yellow line). The near-wake layer that is thin for these high
  $Re$ numbers is here pinched due to the precession of bubble motion, leaving only two small recirculation regions (dotted yellow line).
The next subsection presents the characteristics of the far and near wake as a function of  $Re$,
$Re$,  $Ro$ and
  $\unicode[STIX]{x1D6FA}^{\ast }$.
3.2 Far-wake characteristics
3.2.1 Far-wake shape and geometry
The variation of the curvilinear length of the far wake ( $s_{FW}-d/2$) normalized by
  $d$ is given in figure 13 as a function of
  $Re$. As expected, this normalized length increases with
  $Re$, meaning that the region behind the bubble that is affected by the wake is increasing. A least-squares (LS) fit of the data (including all
  $Ro$) yields an increase as
  $Re^{1/4}$. When maximum, the curvilinear length of the far wake is approximately equal to 0.3 times the full rotation distance
  $2\unicode[STIX]{x03C0}r_{e}$ at the bubble equilibrium location. We deduce that the bubbles in these runs never feel their own wake as if it were the wake of an upstream bubble. This is all the more true given that the wake tends to deflect towards the centre. The data scattering in figure 13 is amplified by the difficulty in estimating
  $r_{e}$ accurately, as has already been pointed out. The few data available with fully contaminated bubbles (triangles) has been added for comparison. We see that their far-wake length follows the same general trend as the partially contaminated ones, although their spinning is uniform like spheres (Rastello et al. Reference Rastello, Marié and Lance2017).

Figure 13. Normalized far-wake curvilinear chord length versus  $Re$. Partially contaminated bubbles:
  $\times$,
  $Ro<6$; ○,
  $6\leqslant Ro\leqslant 8.5$; ▫,
  $Ro>8.5$. Fully contaminated bubbles, ▴. Solid line,
  $(s_{FW}-d/2)/d=2Re^{1/4}$.

Figure 14. Non-dimensional curvature of the far wake  $\unicode[STIX]{x1D705}_{FW}^{+}$ and of the streamlines at bubble equilibrium position
  $\unicode[STIX]{x1D705}_{e}^{+}$ versus
  $Re$ number. Far wake:
  $\times$,
  $Ro<6$; ○,
  $6\leqslant Ro\leqslant 8.5$; ▫,
  $Ro>8.5$. Streamlines:
  $+$,
$+$,  $Ro<6$; ●,
  $6\leqslant Ro\leqslant 8.5$; ♢,
  $Ro>8.5$. Solid line,
  $\unicode[STIX]{x1D705}_{e}^{+}=(125/3)Re^{-2/5}$.
The mean radius of curvature of the wake  $r_{FW}$ was estimated by approximating the curvilinear wake length
  $s_{FW}$ by an arc of a circle. Then
  $r_{FW}$ is the solution of
 $$\begin{eqnarray}l_{FW}-2r_{FW}\sin \left(\frac{s_{FW}}{2r_{FW}}\right)=0,\end{eqnarray}$$
 and the reciprocal of the value thus calculated gives the mean far-wake curvature  $\unicode[STIX]{x1D705}_{FW}$. This curvature normalized by the curvature of the tank is denoted by
  $\unicode[STIX]{x1D705}_{FW}^{+}$. Its
  $Ro$ and
  $Re$ dependence is displayed in figure 14, together with the non-dimensional curvature of the flow streamline at the bubble equilibrium position
  $\unicode[STIX]{x1D705}_{e}^{+}$ (
 $\unicode[STIX]{x1D705}_{e}=1/r_{e}$). An LS fit of all the data shows that, on average,
  $\unicode[STIX]{x1D705}_{e}$ decreases as
  $Re^{-2/5}$.
As expected, for a given  $Re$, the curvature
  $\unicode[STIX]{x1D705}_{e}^{+}$ is greater for smaller
  $Ro$, the reason being that bubbles located closer to the centre regarding their diameter see an incoming rotational flow that is more curved. This is particularly visible for
  $Re$ in the range
  $[100,200]$. Whatever
  $Re$ in that range,
  $\unicode[STIX]{x1D705}_{FW}^{+}$ is clearly higher than
  $\unicode[STIX]{x1D705}_{e}^{+}$ when
  $Ro\leqslant 8.5$, the difference increasing as
  $Ro$ decreases. The far wake is therefore more curved than the incoming flow streamline and this trend amplifies as the relative bubble distance from the centre decreases. This is what can be noted when comparing figures 9(b) and 10(d). In contrast, no significant difference in curvature is on average observed for
  $Ro>8.5$. At intermediate distances (
 $6\leqslant Ro\leqslant 8.5$), the two curvatures are very close to each other up to
  $Re=150$, while above,
  $\unicode[STIX]{x1D705}_{FW}^{+}$ is systematically greater than
  $\unicode[STIX]{x1D705}_{e}^{+}$. The data for the fully contaminated bubbles exhibit the same trends and so have not been reported.
The far-wake surface normalized by the bubble surface  $\mathscr{S}_{B}$ is plotted in figure 15(a). An LS fit of all the data shows that it evolves as
  $Re^{0.45}$, thus increasing with
  $Re$. The influence of the curvature on the wake area
  $\mathscr{S}_{FW}$ was investigated by comparing
  $\mathscr{S}_{FW}$ with a reference area
  $\mathscr{S}_{FWref}$ defined as the product of the bubble diameter and the curvilinear length. It corresponds to the surface that would be obtained with an axisymmetric straight far wake. The results are shown in figure 15(b) in non-dimensional form, with all areas normalized by the bubble surface
  $\mathscr{S}_{B}$.

Figure 15. (a) Non-dimensional far-wake area versus  $Re$ number. Partially contaminated bubbles:
  $\times$,
  $Ro<6$; ○,
  $6\leqslant Ro\leqslant 8.5$; ▫,
  $Ro>8.5$. Solid line,
  $\mathscr{S}_{FW}/\mathscr{S}_{B}=1.1Re^{0.45}$. Fully contaminated bubbles, ▴. (b) Non-dimensional far-wake area versus the non-dimensional area that would be obtained with an axisymmetric straight far wake:
  $\times$,
  $Re<150$; ○,
  $150\leqslant Re\leqslant 250$; ▫,
  $Re>250$. Dashed line,
  $y=x$; solid line,
  $0.3x^{1.6}$. Fully contaminated bubbles, ▴.
For  $Re$ up to 150–200, the exact value depending on the
  $Ro$ number,
  $\mathscr{S}_{FW}$ is slightly smaller than
  $\mathscr{S}_{FWref}$, while above it becomes rather rapidly higher. Referring to figure 14, the low-Reynolds-number behaviour corresponds to situations where both curvatures
  $\unicode[STIX]{x1D705}_{FW}^{+}$ and
  $\unicode[STIX]{x1D705}_{e}^{+}$ are important. In that case, the difference of velocity seen by both sides of the bubble together with the curvature of the incoming flow streamlines reduces the area of the far wake, which can explain that
  $\mathscr{S}_{FW}$ is slightly lower than
  $\mathscr{S}_{FWref}$. In contrast, for high
  $Re$ (400–500), the flow and the bubble wake are weakly curved and there is no obvious link between this smaller curvature and the fact that
  $\mathscr{S}_{FW}>\mathscr{S}_{FWref}$. A more plausible explanation in that case seems to be that, as the far wake grows in length (figure 13), its cross-section also thickens (figure 10), making
  $\mathscr{S}_{FW}>\mathscr{S}_{FWref}$. The cross-section growing can be attributed to various conjugated effects. The spinning of the surface is close to its maximum (3.1), the bubble deformation is no longer negligible (aspect ratio 1.2) and, as explained before, small-amplitude circular precessing motions appear. It follows that the wake cross-section is larger than the mean equivalent diameter of the bubble
  $d$ and explains the trends observed.
3.2.2 Far-wake deflection
The wake deflection is quantified by the angle  $\unicode[STIX]{x1D6FE}_{2}$ between the chord
  $l_{FW}$ and the vertical line passing through the centre of the bubble (figure 5a). Clearly, this angle increases with
  $Re$ (figure 16) up to
  $90^{\circ }$ for
  $Re$ numbers of the order of 400–500. This physically occurs when the far wake extends far downstream, until approximately
  $180^{\circ }$ away from the bubble around the axis of rotation, impacting a large region of the tank. The trends are very similar to those exhibited by the curvature. For
  $Re$ in the range
  $[100,200]$, deflection is higher when
  $Ro\leqslant 8.5$, the difference increasing as
  $Ro$ decreases, that is, as the bubble is closer to the centre. At intermediate distances (
 $6\leqslant Ro\leqslant 8.5$), no
  $Ro$ significant effect is observed, the smaller
  $Re$ are less deflected, while the large ones are more deflected (see examples in figure 9a,d). The behaviour of the ‘fully contaminated data’ is rather similar. An LS fit of all the data shows that the deflection angle on average varies as
  $Re^{0.45}$.
To go further in the analysis, figure 17 compares the angle  $\unicode[STIX]{x1D6FE}_{2}$ with the angle
  $\unicode[STIX]{x1D6FE}_{1}$ that would be measured if the wake had followed the incoming flow streamlines at the bubble equilibrium position. The interesting result is that
  $\unicode[STIX]{x1D6FE}_{2}$ is, on a first-order basis, twice the angle
  $\unicode[STIX]{x1D6FE}_{1}$ that would exist in this case. The far wake therefore always deflects from the incoming flow streamlines with a mean ‘deflection angle’
  $\unicode[STIX]{x1D6FE}_{2}-\unicode[STIX]{x1D6FE}_{1}$ that also varies as
  $Re^{0.45}$, but with half the factor of
  $\unicode[STIX]{x1D6FE}_{2}$. This mean angle is represented by the dotted line in figure 16. As discussed in § 3.1, it is difficult to infer from the measurements which effect, between the flow pressure gradient and the bubble spinning, contributes more to the far-wake deflection. We may conjecture that the deflection is driven by both bubble spinning and pressure gradient at small distances behind the bubble and that pressure gradient (centripetal effect) has more influence at larger distance.

Figure 16. Deflection angle  $\unicode[STIX]{x1D6FE}_{2}$ as a function of
  $Re$. Partially contaminated bubbles:
  $\times$,
  $Ro<6$; ○,
  $6\leqslant Ro\leqslant 8.5$; ▫,
  $Ro>8.5$. Fully contaminated bubbles, ▴. Solid line,
  $\unicode[STIX]{x1D6FE}_{2}=5.5Re^{0.45}$; dotted line, ‘mean deflection angle’
  $\unicode[STIX]{x1D6FE}_{2}-\unicode[STIX]{x1D6FE}_{1}$, same equation as
  $\unicode[STIX]{x1D6FE}_{2}$ but with factor
  $5.5/2$.

Figure 17. Deflection angle  $\unicode[STIX]{x1D6FE}_{2}$ in degrees as a function of
  $\unicode[STIX]{x1D6FE}_{1}$ in degrees. Partially contaminated bubbles:
  $\times$,
  $Ro<6$; ○,
  $6\leqslant Ro\leqslant 8.5$; ▫,
  $Ro>8.5$. Fully contaminated bubbles, ▴. Dashed line,
  $y=x$; solid line,
  $y=2x$.
3.3 Near-wake characteristics
We focus in this section on the region located close behind the bubble where the flow structure is directly impacted by the surface spinning. As a rule, knowledge of the near wake is important for the forces acting on the bubble and for other aspects like the heat and mass transfers (Clift et al. Reference Clift, Grace and Weber1978; Fan & Tsuchiya Reference Fan and Tsuchiya1990). For a steady sphere in a uniform flow, this region is well described in the literature. Taneda (Reference Taneda1956) was among the first to visualize and characterize the recirculations that structure this near wake. Later on, Johnson and Patel (Reference Johnson and Patel1999) provided a full description of the structure of this near wake at  $Re$ up to 300, both experimentally and numerically. More recently, Kim (Reference Kim2009), Giacobello et al. (Reference Giacobello, Ooi and Balanchandar2009) and Poon et al. (Reference Poon, Ooi, Giacobello and Cohen2010, Reference Poon, Ooi, Giacobello, Iaccarino and Cohen2013) numerically studied this near wake when the sphere is rotating transversely and identified various behaviours as a function of
  $\unicode[STIX]{x1D6FA}^{\ast }$ and
  $Re$. In our experiment, this near-wake region can be rather well identified on the instantaneous images as a region where the velocity of seeding particles is lower than in the main flow stream (§ 2.2).
3.3.1 Near-wake shape and geometry
The geometrical parameters that characterize the near wake are its chord length ( $l_{NW}-d/2$) and its surface
  $\mathscr{S}_{NW}$ (figure 5b). Figure 18 compares the
  $Re$ dependence of this chord length normalized by the bubble diameter with that of the non-dimensional near-wake length
  $L_{NW(uniform)}$ behind a steady sphere in a uniform flow, as simulated by Giacobello et al. (Reference Giacobello, Ooi and Balanchandar2009) and Tomboulides and Orszag (Reference Tomboulides and Orszag2000), and measured by Nakamura (Reference Nakamura1976). It shows that the dissymmetry and the deflection of the near wake that are induced by the bubble spinning and the flow rotation result in a chord length that increases with
  $Re$, but is systematically larger than
  $L_{NW(uniform)}$. This holds for
  $Re$ up to 150, where both recover the same order of magnitude. This corresponds to the range of
  $Re$ where bubble spinning has reached its maximum. Regarding the surface (figure 19), we see that
  $\mathscr{S}_{NW}$ is smaller than the surface
  $\mathscr{S}_{NWref}$ that would be obtained for the same bubble diameter with an axisymmetric straight near wake. The difference between the two increases with
  $Re$, that is, when bubble spinning and deflection are much more important. By curving the high-velocity-side streamline more or less towards the low-velocity-side streamline, these two effects control the point where they meet and the boundaries of the near wake. This gives this typical shape in figures 5(b) and 10(d) with a sharp tip at the point where they meet and an external streamline more or less curved. The trends are globally the same for a fully contaminated interface.

Figure 18. Non-dimensional near-wake chord length versus  $Re$. Partially contaminated bubbles,
  $\times$,
  $Ro<6$; ○,
  $6\leqslant Ro\leqslant 8.5$; ▫,
  $Ro>8.5$. Fully contaminated bubbles, ▴. Dashed line, Giacobello et al. (Reference Giacobello, Ooi and Balanchandar2009) and Tomboulides and Orszag (Reference Tomboulides and Orszag2000); dash-dotted line, Nakamura (Reference Nakamura1976).

Figure 19. Normalized near-wake area versus the normalized one that would be obtained with an axisymmetric straight near wake. Partially contaminated bubbles:  $\times$,
  $Re<150$; ○,
  $150\leqslant Re\leqslant 250$; ▫,
  $Re>250$. Fully contaminated bubbles, ▴. Dashed line,
  $y=x$; solid line,
  $y=0.7x^{1.35}.$
3.3.2 Near-wake surface dependences
Since the near wake is the region behind the bubble that is a priori the most directly influenced by the surface spinning, we have plotted its surface evolution as a function of  $\unicode[STIX]{x1D6FA}^{\ast }$. This yields figure 20, where two asymptotic behaviours appear. For moderate
  $Re$ in the range
  $[20,140]$, we note that
  $\mathscr{S}_{NW}$ normalized by the average bubble surface
  $\bar{\mathscr{S}_{B}}$ increases quasi-proportionally to the non-dimensional rotation rate as
 $$\begin{eqnarray}\frac{\mathscr{S}_{NW}}{\bar{\mathscr{S}_{B}}}(20\leqslant Re\leqslant 140)=31(\unicode[STIX]{x1D6FA}^{\ast }(Re)-\unicode[STIX]{x1D6FA}^{\ast }(Re=20)),\end{eqnarray}$$
 where  $\unicode[STIX]{x1D6FA}^{\ast }(Re)$ is given by the equation in figure 7(a). This highlights that bubble spinning strongly influences the flow in the near wake for
  $Re\in [20,140]$. When normalized by the bubble surface, this dependence becomes
 $$\begin{eqnarray}\frac{\mathscr{S}_{NW}}{\mathscr{S}_{B}}(20\leqslant Re\leqslant 140)=25(\exp (-0.014\times 20)-\exp (-0.014Re))\left(\frac{Re}{20}\right)^{-1.10}.\end{eqnarray}$$
 In contrast, above  $Re=150$,
  $\mathscr{S}_{NW}/\bar{\mathscr{S}_{B}}$ and
  $\unicode[STIX]{x1D6FA}^{\ast }(Re)$ are uncorrelated. While
  $\unicode[STIX]{x1D6FA}^{\ast }(Re)$ saturates because
  $\bar{\unicode[STIX]{x1D6FA}}_{b}/\unicode[STIX]{x1D714}$ reaches a constant value,
  $\mathscr{S}_{NW}/\bar{\mathscr{S}_{B}}$ still increases before decreasing at high
  $Re$.
$Re$.

Figure 20. Normalized near-wake surface versus non-dimensional rotation rate  $\unicode[STIX]{x1D6FA}^{\ast }$. Partially contaminated bubbles:
  $\times$,
  $Ro<6$; black ○,
  $6\leqslant Ro\leqslant 8.5$; ▫,
  $Ro>8.5$; filled ○, split near wake. Fully contaminated bubbles, ▴. Solid line:
  $(\mathscr{S}_{NW}/\bar{\mathscr{S}_{B}})(20\leqslant Re\leqslant 140)=31(\unicode[STIX]{x1D6FA}^{\ast }(Re)-\unicode[STIX]{x1D6FA}^{\ast }(Re=20))$.
The impact of the bubble interface spinning on the surface  $\mathscr{S}_{NW}$ for
  $Re\in [20,140]$ can explain why
  $\mathscr{S}_{NW}$ is higher than what can be observed for inclusions without an interface rotation for the same
  $Re$ and
  $d$. This is illustrated in figure 21, where
  $\mathscr{S}_{NW}/\mathscr{S}_{B}$ is plotted as a function of
  $Re$, together with the normalized near-wake surface for spheres in a uniform flow. The normalized surface for non-rotating spheres in a uniform flow was estimated in two ways that agree with one another: from the correlation proposed by Fan & Tsuchiya (Reference Fan and Tsuchiya1990), and from the separation angles and the wake length calculated by Giacobello et al. (Reference Giacobello, Ooi and Balanchandar2009). Up to 140,
  $\mathscr{S}_{NW}/\mathscr{S}_{B}$ is clearly higher than the correlations for non-rotating spheres in uniform flows, while it is well reproduced by (3.9). In contrast, from 140 up to 240, the trend changes and
  $\mathscr{S}_{NW}/\mathscr{S}_{B}$ then follows this correlation rather well, even above its limit of validity (
 $Re=200$). The increase of
  $\mathscr{S}_{NW}/\mathscr{S}_{B}$ is no longer linked to the surface spinning, which has reached its maximum, but to the increase of the flow velocity
  $U=\unicode[STIX]{x1D714}r_{e}$ seen by the bubble, with, as a result, a near wake that extends farther downstream (figure 18).

Figure 21. Normalized near-wake surface versus  $Re$. Partially contaminated bubbles:
  $\times$,
  $Ro<6$; black ○,
  $6\leqslant Ro\leqslant 8.5$; ▫,
  $Ro>8.5$; filled ○, split near wake. Fully contaminated bubbles: ▴. Thick line,
  $(\mathscr{S}_{NW}/\mathscr{S}_{B})(20\leqslant Re\leqslant 140)=25(\exp (-0.014\times 20)-\exp (-0.014Re))(Re/20)^{-1.10}$; solid line,
  $(\mathscr{S}_{NW}/\mathscr{S}_{B})(Re\geqslant 240)=2(Re/240)^{-5/2}$; dashed line, surface variation for a bubble in a uniform flow
  $(Re-20)^{1.12}/200~(20\leqslant Re\leqslant 200)$, Fan & Tsuchiya (Reference Fan and Tsuchiya1990), extrapolated up to
  $Re=250$; dash-dotted line, Giacobello et al. (Reference Giacobello, Ooi and Balanchandar2009) and Tomboulides and Orszag (Reference Tomboulides and Orszag2000).
The behaviour at high  $Re$ (
 $Re\geqslant 240$), where
  $\mathscr{S}_{NW}/\mathscr{S}_{B}$ suddenly decreases and saturates, corresponds to situations where the wake is unstable. As pointed out in § 3.1, this instability manifests by the occurrence of a small-amplitude circular precessing bubble motion that induces a periodic pinching of the near wake. The pinching splits the near wake into two almost symmetrical parts and contributes to decrease its area. Also, the far wake extends far downstream and is strongly deflected. The angle
  $\unicode[STIX]{x1D6FE}_{2}-\unicode[STIX]{x1D6FE}_{1}$ is typically of the order of
  $30^{\circ }$ to
  $45^{\circ }$ (figure 16) and the high-velocity-side streamline is deflected inwards so much (figure 9d) that it prevents the downstream development of the near wake. These two effects (instability plus deflection) explain why the near wake then reduces to a very thin layer of fluid behind the bubble that progressively vanishes at
  $Re$ above 300. The surface of this layer normalized by the bubble surface clearly decreases with
  $Re$ as (figure 21)
 $$\begin{eqnarray}\frac{\mathscr{S}_{NW}}{\mathscr{S}_{B}}(Re\geqslant 240)=2\left(\frac{Re}{240}\right)^{-5/2}.\end{eqnarray}$$
 These changes in the behaviour of the near wake coincide with the changes in the lift coefficients noted by Rastello et al. (Reference Rastello, Marié, Grosjean and Lance2009, Reference Rastello, Marié and Lance2017) between  $Re<200$ and
  $Re>250$. It was shown that the total lift coefficient
  $C_{L}$ was the sum of the lift coefficient
  $C_{L_{(SBRH)}}$ induced by the solid-body rotating flow and an excess lift
  $C_{L_{(BS)}}$ induced by the bubble spinning. Subtracting the excess lift from the total lift yields the lift contribution of the solid-body rotation flow (see figure 20 in Rastello et al. (Reference Rastello, Marié and Lance2017)). This lift contribution is close to that obtained by Bluemink et al. (Reference Bluemink, Lohse, Prosperetti and Van Wijngaarden2008, Reference Bluemink, Lohse, Prosperetti and Van Wijngaarden2010) for non-spinning spheres and behaves differently depending on
  $Re$. It increases for
  $Re$ up to approximately
  $150$ while it decreases with
  $Re$ above
  $250$. According to the latter authors, these different regimes can be attributed to changes in the structure of the wake behind the sphere. The data presented here bring experimental evidence of these changes through the near-wake surface evolution and confirm this statement. They suggest that vorticity around the bubble is changing with
  $Re$ and so is the lift. Coefficient
  $C_{L_{(SBRH)}}$ was also found to increase with
  $Ro$, but this effect is more difficult to identify. The only visible trend in figure 21 is that, for
  $150\leqslant Re\leqslant 200$, the near-wake surface is on average smaller for
  $Ro<6~(\times )$ than for large
  $Ro$. This is precisely the
  $Re$ range where the flow-induced lift is most influenced by
  $Ro$.
$Ro$.
4 Conclusion
This work provides new results that complete our previous studies on the drag and lift forces on a bubble immersed in a solid-body rotating flow around a horizontal axis (Rastello et al. Reference Rastello, Marié, Grosjean and Lance2009, Reference Rastello, Marié and Lance2011, Reference Rastello, Marié and Lance2017). We focus on the situation where the bubble surface is contaminated and the bubble is freely spinning, thus creating an excess lift force in comparison with a clean surface. The objective was to describe the complex separated wake that forms behind the bubble in that case. The two-dimensional geometry and behaviour of this wake have been inferred from laser-sheet visualizations with fluorescent seeding microparticles. They have been analysed as a function of the local parameters that characterize the rotational flow at the point where the bubble is at equilibrium ( $Re$ and
  $Ro$ numbers), and the non-dimensional spinning rate
  $\unicode[STIX]{x1D6FA}^{\ast }$ that quantifies the importance of the bubble spinning velocity relative to the upstream flow velocity.
We find that the flow rotation and the bubble spinning cause a significant dissymmetry of the wake. Under the influence of the surface spinning, the high-velocity flow arriving on one side of the bubble turns around the bubble rear and moves upwards on the other side till it meets the downward low-velocity flow, forming there a high-shear layer. This causes the stagnation point observed behind the bubbles in the clean situation to displace upwards on the low-velocity side of the bubble. This effect increases as  $Re$ and thus
  $\unicode[STIX]{x1D6FA}^{\ast }$ increase.
With increasing  $Re$, the wake extends farther downstream and deflects towards the flow rotation axis. The angle of deflection relative to the incoming streamline at the bubble equilibrium position increases with
  $Re$ concomitantly with the length of the far wake. It is typically of the order of
  $50^{\circ }$ at
  $Re=450$. For a given
  $Re$, this angle is larger for bubbles located close to the centre of the flow (small
  $Ro$) reflecting a stronger deviation. The far wake for these bubbles is also more curved than the incoming streamlines. The wake deflection can be attributed to two main effects: the bubble spinning, which generates the wake dissymmetry close to the surface, and the centripetal action of the pressure gradient. However, it is difficult to evaluate which of these effects contributes more to the deflection.

Figure 22. Three-dimensional general view of the device.

Figure 23. Lateral view of the device.
The study of the near wake has yielded the following conclusions.
(i) For
 $Re\leqslant 140$, the surface spinning strongly influences the structure of the near wake, so that its size increases faster with $Re$ than for a stationary sphere in a uniform flow. An expression giving the normalized surface of the near wake as a function of $\unicode[STIX]{x1D6FA}^{\ast }$ and $Re$ has been proposed.
(ii) For
$140<Re\leqslant 240$, the influence of the bubble spinning reaches its maximum and is no longer dominant. The size of the near wake is then linked to the increase of the free-stream velocity $U=\unicode[STIX]{x1D714}r_{e}$ with $Re$ and comparable with that of a stationary sphere in a uniform flow.(iii) For
$Re>240$, the near wake decreases rapidly with $Re$ until it disappears for higher $Re$. This decrease is caused by the wake instability and the small circular precession motions of the bubble that result. The precession contributes to cyclically split the near wake whose area vanishes at high $Re$ into two small recirculating zones.


The intermediate  $Re$ range (
 $140<Re\leqslant 240$) turns to be the range where the coefficient of the lift induced on the bubble by the solid-body rotation flow (Rastello et al. Reference Rastello, Marié, Grosjean and Lance2009, Reference Rastello, Marié and Lance2017) stops increasing with
  $Re$ and reaches a maximum before decreasing at higher
  $Re$ values. We can therefore reasonably conclude that the changes of this lift coefficient with
  $Re$ are closely linked to the changes in the near-wake development around the spinning bubbles and thus to the changes in vorticity near the surface that its implies.
Acknowledgements
The authors would like to thank Nathalie Grosjean for her technical assistance in the attempt to process the visualizations using the LaVision PIV software.
Appendix. Technical description of the device
A general three-dimensional view and a side view of the device used for the experiments are given in figures 22 and 23, respectively. The device comprises a cylindrical tank (1) (Ø = 10 cm,  $L=10~\text{cm}$), mounted in a cylindrical counterbore (2) that can rotate around a horizontal axis thanks to ball bearings (3). The ball bearings are installed in two stainless-steel rigid disks (4), fixed together by three rods (5) to ensure a good rigidity of the system. The cylindrical counterbore is entrained in rotation by a toothed belt (6) fixed at its back and coupled to an 80 W Crouzey brushless electric motor (7), through a transmission system (8). The ensemble of the device is screwed onto a thick iron casing (9), equipped with four adjustable legs (10), whose tips are in a damping material to remove vibrations.


