Introduction
Attention problems, impulsiveness and hyperactivity are the defining symptoms of attention deficit hyperactivity disorder (ADHD; APA, 2013). However, the way these symptoms are expressed and experienced in everyday life varies widely between children, resulting in a highly diverse clinical group. This diversity is also reflected in the neuropsychology of ADHD, where neuropsychological impairments vary greatly between affected individuals. It is this neuropsychological heterogeneity that has led a number of authors to suggest a paradigm shift from hypothesizing one core dysfunction in ADHD, to describing multiple neuropsychological domains that may be independently affected (Castellanos & Tannock, Reference Castellanos and Tannock2002; Sonuga-Barke, Reference Sonuga-Barke2002; Nigg & Casey, Reference Nigg and Casey2005). These domains may even reflect separable aetiological pathways at the neurobiological level, where changes in separable brain systems may independently give rise to the behavioural phenotype (Nigg & Casey, Reference Nigg and Casey2005; Sonuga-Barke, Reference Sonuga-Barke2005; Durston et al. Reference Durston, van Belle and de Zeeuw2011). This ties in with a recent meta-analysis of 55 fMRI studies (Cortese et al. Reference Cortese, Kelly, Chabernaud, Proal, Di Martino, Milham and Castellanos2012) that found a wide variety of brain systems to be involved in ADHD.
Two neuropsychological domains studied extensively in ADHD are cognitive control (Barkley, Reference Barkley1997; Alderson et al. Reference Alderson, Rapport and Kofler2007), which can be defined as ‘the ability to override an inappropriate response in favour of another’ (Casey et al. Reference Casey, Tottenham, Liston and Durston2005, p. 106); and sensitivity to reward. Here, we define reward sensitivity within the framework of the ‘dopamine transfer deficit’ theory, which focuses on the anticipatory firing of dopamine cells (Tripp & Wickens, Reference Tripp and Wickens2009). We therefore focus on the anticipation of reward, as opposed to the evaluation of reward outcome (for an comprehensive review see Luman et al. Reference Luman, Tripp and Scheres2010).
At the group level, deficits in both domains have been found in children with ADHD. Nonetheless, a substantial proportion of children with ADHD performs within the normal range on such tasks (Nigg et al. Reference Nigg, Willcutt, Doyle and Sonuga-Barke2005). This underlines the notion that no single neuropsychological deficit can explain the behavioural phenotype. Building on a multiple-pathway hypothesis, recent studies have found several subgroups with varying neuropsychological profiles in ADHD (Sonuga-Barke et al. Reference Sonuga-Barke, Bitsakou and Thompson2010; de Zeeuw et al. Reference de Zeeuw, Weusten, van Dijk, van Belle and Durston2012; Fair et al. Reference Fair, Bathula, Nikolas and Nigg2012). In addition to deficits in cognitive control and reward sensitivity, deficits in motor and perceptual timing have been reported (Toplak et al. Reference Toplak, Dockstader and Tannock2006; Noreika et al. Reference Noreika, Falter and Rubia2013).
In this study, we aimed to analyse heterogeneity in task performance across a battery of neuropsychological tasks in ADHD. Rather than averaging out inter-individual differences in performance, we used latent class analysis (LCA), a statistical method that classifies individuals into subgroups (latent classes) based on their task performance. This technique models the variance within ADHD by constructing subgroups of children who show a similar pattern of performance. Note that this approach differs from more widely used factor analytical techniques, which classify variables as opposed to individuals. In order to compare the resulting classification of ADHD patients with typically developing controls, we performed two separate analyses: One on a sample of 96 subjects with ADHD and one on a sample of 121 typically developing control subjects.
We used two neuropsychological tasks to test for differences in cognitive control, timing and reward sensitivity. The first task was an adaptation of a go-nogo paradigm where the timing of events was manipulated to create expected and unexpected events (Durston et al. Reference Durston, Davidson, Mulder, Spicer, Galvan, Tottenham, Scheres, Xavier Castellanos, van Engeland and Casey2007). This manipulation was chosen as we hypothesized that timing deficits in ADHD are a consequence of an attenuated build-up and monitoring of temporal expectations (Nigg & Casey, Reference Nigg and Casey2005). In previous work, we have shown that the manipulation of stimuli in this paradigm is associated with frontostriatal hypoactivation in ADHD (Durston et al. Reference Durston, Davidson, Mulder, Spicer, Galvan, Tottenham, Scheres, Xavier Castellanos, van Engeland and Casey2007; Mulder et al. Reference Mulder, Baeyens, Davidson, Casey, van den Ban, van Engeland and Durston2008), whereas the manipulation of timing is associated with cortico-cerebellar hypoactivation in ADHD (Durston et al. Reference Durston, Davidson, Mulder, Spicer, Galvan, Tottenham, Scheres, Xavier Castellanos, van Engeland and Casey2007; Mulder et al. Reference Mulder, Baeyens, Davidson, Casey, van den Ban, van Engeland and Durston2008, Reference Mulder, van Belle, van Engeland and Durston2011). The second task was a reward anticipation paradigm, adapted from the monetary incentive delay task (MID; Knutson et al. Reference Knutson, Adams, Fong and Hommer2001) to be suitable for children (De Zeeuw et al. Reference de Zeeuw, Weusten, van Dijk, van Belle and Durston2012). Previous studies using a MID paradigm (Scheres et al. Reference Scheres, Milham, Knutson and Castellanos2007; Ströhle et al. Reference Ströhle, Stoy, Wrase, Schwarzer, Schlagenhauf, Huss, Hein, Nedderhut, Neumann, Gregor, Juckel, Knutson, Lehmkuhl, Bauer and Heinz2008) have shown hypoactivation of the ventral striatum in ADHD during reward anticipation. We hypothesized that we would be able to identify three separate subgroups among individuals with ADHD, each with a deficit in one of the three domains of cognitive control, timing and reward sensitivity.
Method
Participants
The institutional review board of the University Medical Center Utrecht approved the study and its procedures. Participants with ADHD were recruited from our outpatient clinic for developmental disorders. All subjects with ADHD were diagnosed by an expert child and adolescent psychiatrist according to DSM-IV TR criteria (APA, 2000). Typically developing controls were recruited through schools in the wider Utrecht area. The groups were matched for age and gender at the group level. A total of 217 subjects aged 6–25 years were included in this study: 96 subjects with ADHD and 121 typically developing controls. Only subjects with ADHD using no medication or on short-working medication were included (e.g. methylphenidate). Seventy-three participants (76%) with ADHD were using some form of methylphenidate at the time of inclusion. All participants were requested not to take any medication on the day of testing. Table 1 gives demographic information.
Table 1. Demographic characteristics

ADHD, Attention deficit hyperactivity disorder; s.d., standard deviation.
* Significant group difference.
Written informed consent was obtained from both parents for subjects aged <18 years. Children provided verbal assent. Participants aged ⩾18 years signed for their own informed consent. The Diagnostic Interview Schedule for Children (DISC-IV, parent version; Shaffer et al. Reference Shaffer, Fisher, Lucas, Dulcan and Schwab-Stone2000) was administered to parents of subjects aged 6–18 years. Participants aged ⩾18 years participated in the MINI-plus abbreviated psychiatric interview (Sheehan et al. Reference Sheehan, Lecrubier, Sheehan, Amorim, Janavs, Weiller, Hergueta, Baker and Dunbar1998). Results from these two interviews were used to exclude psychiatric co-morbidity in typically developing controls. Furthermore, the DISC-IV was used to specify the subtype of ADHD according to DSM-IV criteria. As the MINI-plus interview does not provide subtype specification, we only have subtype information on 89/96 participants with ADHD. Of these participants 49% met criteria for the ADHD combined subtype, 10% met criteria for the predominantly hyperactive-impulsive subtype, 29% met criteria for the predominantly inattentive subtype and 11% did not meet DISC-IV criteria for current ADHD. These 10 children did not meet criteria as a direct consequence of successful symptomatic control using ADHD medication (e.g. methylphenidate), according to their parents. Participants with ADHD were excluded from the study if they met diagnostic criteria for a co-morbid psychiatric disorder other than oppositional defiant disorder/conduct disorder (ODD/CD), based on the diagnostic interview. Exclusion criteria for all participants were major physical or neurological illness. Parents completed the Swanson, Nolan and Pelham-IV (SNAP-IV) rating scale, a 26-item questionnaire assessing all symptoms of ADHD listed in the DSM-IV-TR definition (Swanson, Reference Swanson1992), and the Child Behavior Checklist (CBCL), a 120-item questionnaire assessing behavioural and emotional problems (Verhulst et al. Reference Verhulst, Van Der Ende and Koot1996). Subjects participated in two computerized neuropsychological tasks and a four-subtest shortened WISC-III or WAIS-III, as age-appropriate, in order to estimate full-scale IQ.
Ethical standards
The authors assert that all procedures contributing to this work comply with the ethical standards of the relevant national and institutional committees on human experimentation and with the Helsinki Declaration of 1975, as revised in 2008.
Cognitive control/timing task
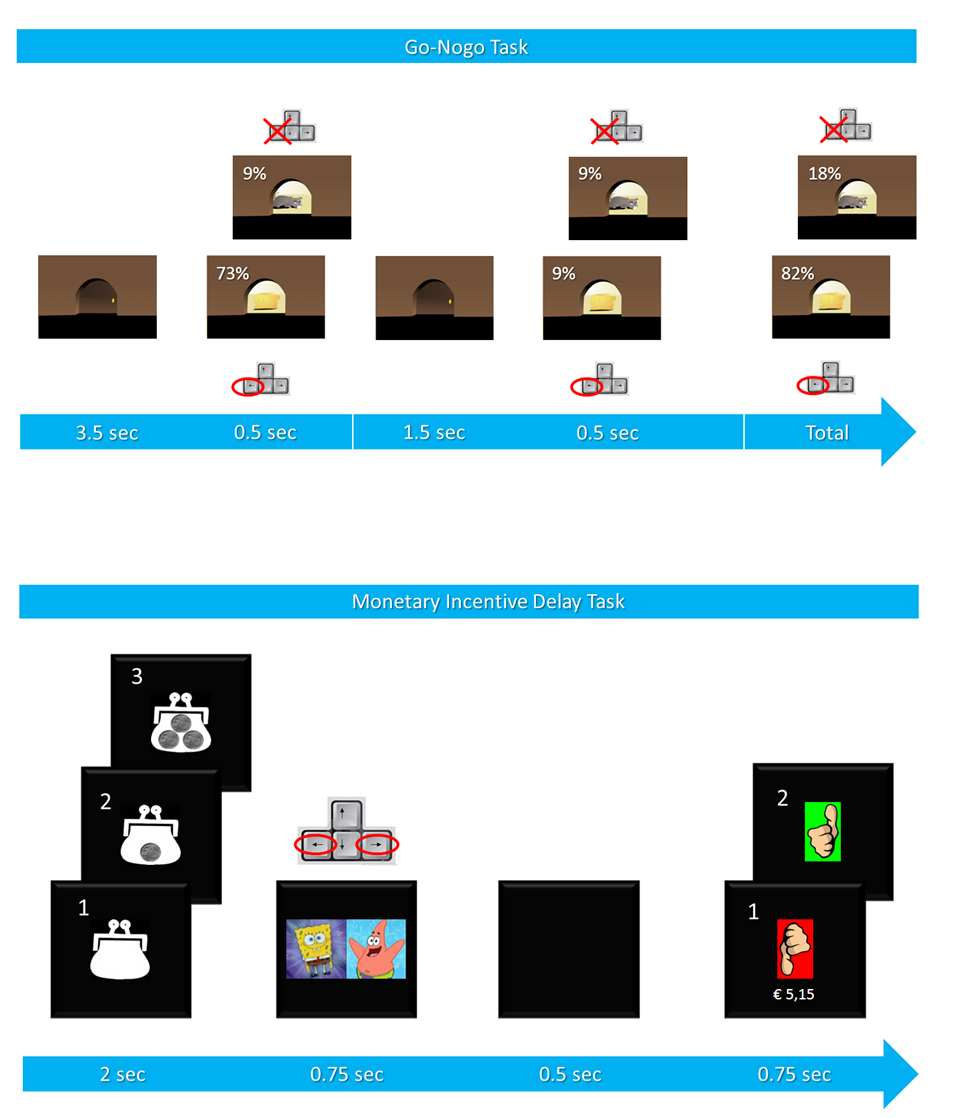
The first task was a timing-manipulated go-nogo task (Durston et al. Reference Durston, Davidson, Mulder, Spicer, Galvan, Tottenham, Scheres, Xavier Castellanos, van Engeland and Casey2007). Participants were instructed to aid a mouse in its search for cheese. A little door was shown that opened regularly. Behind it was either a piece of cheese (go; 82% of 264 trials) or a cat (nogo; 18% of 264 trials). The subjects were asked to press a button as fast as possible when a piece of cheese was shown and to withhold their response when a cat was shown. Timing of trials was manipulated, with the majority of trials presented with an interstimulus interval (ISI) of 4 s (expected timing), and a minority (18%) with a 2 s ISI (unexpected timing). This created four types of trials: go trials with expected timing, go trials with unexpected timing, nogo trials with expected timing and nogo trials with unexpected timing. There were eight outcome measures for this task: percentage of correct nogo trials (both expected and unexpected: accuracyexp-nogo and accuracyunexp-nogo), reaction time benefit (RTbenefit, explained below), mean reaction time (MRT) on the go trials (i.e. MRTexp-go and MRTunexp-go), intra-individual coefficient of variation (ICV) on expected go trials (ICVexp-go), and the percentage of correct go trials (both expected and unexpected: accuracyexp-go and accuracyunexp-go). RTbenefit denotes the difference in MRT between the expected and unexpected go trials. In other words, how much faster subjects respond on expected v. unexpected go trials. This difference is expressed in the number of standard deviations (s.d.) of MRTexp-go (MRTexp-go − MRTunexp-go)/s.d.RTexp-go.
Reward sensitivity task
The second task we used was a modified version of the MID task (Knutson et al. Reference Knutson, Adams, Fong and Hommer2001), composed of four blocks of 60 trials, with an intertrial interval of 4 s (De Zeeuw et al. Reference de Zeeuw, Weusten, van Dijk, van Belle and Durston2012). Participants were asked to guess which of two cartoon figures (SpongeBob and Patrick Star) was hiding a wallet. First, a picture of a wallet (cue) with 0, 5 or 15 cents was presented. The participant was told that this was the amount of money that could be won during the upcoming trial. Second, a screen appeared where a picture of SpongeBob (always on the left) and Patrick (always on the right) was shown, and the subject was asked to guess who was hiding the wallet by pressing the appropriate key as quickly as possible (the left arrow key for SpongeBob and the right arrow key for Patrick). The task was rigged so that the result was unrelated to the participant's response. On 50% of all trials, participants were shown a screen showing a thumbs-up picture, stating a ‘correct guess’ and the cued reward amount was added to their total. On the other half of the trials, a thumbs-down picture was shown, denoting an ‘incorrect guess’ with no reward added to their total. The primary outcome measure of this task is the shift in reaction time distribution between rewarded and unrewarded trials. This was quantified using linear regression of the rank-ordered reaction times of the rewarded condition on the rank-ordered reaction times of the non-rewarded condition, as described previously (De Zeeuw et al. Reference de Zeeuw, Weusten, van Dijk, van Belle and Durston2012). Any regression coefficient below 1 represents a faster response time on rewarded than on unrewarded trials. Other variables used in the LCA were MRT on the non-rewarded trials and the ICV (s.d. of RTs divided by MRT) on the non-rewarded trials. In total, we had 12 outcome variables from these tasks, eight derived from the go-nogo task and four from the MID task (see Table 2). We tested for the effect of IQ on all variables.
Table 2. Task performance: timing-manipulated go-nogo task and monetary incentive delay task

MRT, Mean reaction time; ICV, intra-individual coefficient of variation; RT, reaction time; ADHD, attention deficit hyperactivity disorder; s.d., standard deviation; df, degrees of freedom.
a Equal variances not assumed.
* Significant group difference.
Statistical analyses
Basic analyses on demographic data and (sub)group comparisons were conducted in SPSS version 20.0 (SPSS Inc., USA). In order to ensure data quality across ADHD and control groups, the data were screened for signs of off-task behaviour. We only excluded subjects for off-task behaviour based on go accuracy in the go-nogo task or the percentage of trials without a response in the MID task. Participants who scored more than three interquartile ranges above the third quartile (data from both groups combined) were considered extreme outliers and excluded from further analyses. Four subjects with ADHD and one typically developing control were excluded on the basis of this criterion. Group differences in baseline demographics between children with ADHD and typically developing controls were tested using independent-sample t test or χ 2 test as appropriate (see Table 1).
The LCA was performed in Latent Gold (Vermunt & Magidson, Reference Vermunt and Magidson2005). A latent class model refers to any statistical model where unobserved subgroups are identified based on their scores on observed (task) measures (Magidson & Vermunt, Reference Magidson, Vermunt and Kaplan2004). As such, the analysis uses quantified data (measures of task performance in this case) to assess the presence of qualitatively different subgroups across these variables. This contrasts with factor analytical approaches that do not directly classify individuals into subgroups, but first classify variables into factors. Factor analytical approaches assume that the correlation between variables is equal for the entire group, whereas LCA makes no such assumption. As we reasoned that ADHD subgroups may differ from subgroups in typically developing controls in both qualitative and quantitative ways, we conducted two separate analyses: the primary analysis was based on data from participants with ADHD only. A second LCA used the data from typically developing controls.
Twelve variables (Table 2) were entered into a latent class model. As latent class models need a fixed number of classes to determine the best model fit, eight preliminary models were constructed, with between one and eight latent classes, allowing us to compare model fit across the range of estimated classes. For each model, an estimation of fit was calculated to convey the likelihood that the model was an accurate reflection of the performance differences. For this particular analysis, Bayesian Information Criterion (BIC) was used, which takes parsimony of the model (i.e. the simplest possible model) into account by penalizing additional parameters. From the eight preliminary models, the model with the lowest BIC was chosen for further analysis (Vermunt & Magidson, Reference Vermunt and Magidson2005).
Basic latent class modelling relies on the assumption that within one latent class, all variables are independent of one another. To allow for association between pairs of variables within latent classes, direct effects can be added. First, we tested for direct effects of age on all included variables using Wald's statistic. Any significant age effects were included in the analysis. Second, we added a direct effect for the pair of variables with the highest within-subgroup correlation. This step was then repeated adding one pair of variables at a time, as described by Magidson & Vermunt (Reference Magidson, Vermunt and Kaplan2004). After every step, the model fit was evaluated using the BIC value. At the point where adding one more direct effect did not lead to a lower BIC value, we concluded the current model was the best fit. We visualized the results by plotting the performance profiles for the subgroups. Performance was expressed in Z values, reflecting the number of standard deviations a value was above or below the mean of the group. The subgroups derived from the separate analyses (on ADHD subjects and on control subjects) were compared in both a quantitative and a qualitative manner, similar to the approach of Fair and colleagues (2012). To facilitate a visual, qualitative comparison of the shapes of the profiles between the ADHD and control groups, we adjusted the Z scores for baseline between-group differences. The Z scores used in this comparison were calculated on the performance data for the whole group (ADHD and control combined). Second, a between-subjects MANOVA was conducted to compare the ADHD and control subgroups on all performance measures for any pair of subgroups that showed similarity on visual inspection.
Exploratory analyses
In a final step, we tested for behavioural differences between the ADHD subgroups found in the LCA. Exploratory analyses were performed using data from behavioural rating scales. For this purpose, we used the Internalizing and Externalizing Problems subscales of the CBCL, and the Inattentive, Hyperactive/Impulsive and ODD subscales of the SNAP-IV (parent version). A one-way, between-subjects ANOVA was conducted to test for the effect of LCA subgroup on CBCL scores. As the SNAP-IV data were not normally distributed, we used the non-parametric Kruskal–Wallis test to test for differences between subgroups on these data. Due to considerable floor effects in the control data, any analysis of between-group behavioural differences in controls would have been uninformative.
Results
Task performance
Descriptive statistics of task performance for both groups are shown in Table 2. Performance on the go-nogo task differed between groups for all outcome measures, except for accuracy on unexpected go trials (p = 0.052). On the MID task, there was a between-group difference in the shift of the reaction time distribution between high and non-rewarded conditions: both controls and subjects with ADHD showed faster reaction times when they anticipated high reward, but controls showed a bigger difference. None of the task variables correlated with IQ.
Latent class model construction
In the ADHD group, a five-class solution (of the eight preliminary models) provided the best fit for the data, as indicated by the lowest BIC value (BIC = 2467, LL = −1060, number of parameters = 76). This model was carried forward. Age contributed significantly to 7/12 indicators of the model (see online Supplementary Table S1). Accordingly, we added direct effects between these indicators and age to the model. Next, we added any bivariate interactions that were not accounted for by the model so far (see Method section), by adding additional direct effects. After the addition of four direct effects (between RTbenefit and MRTunexp-go, between MRTexp-go and MRTunexp-go, between ICVexp-go and MRTunexp-go and between RegB_5ct and RegB_15ct; see online Supplementary Table S1), an optimal model fit was achieved. We constructed a model for controls, using an analogous procedure. Again, a model with five latent classes provided the best fit (BIC = 2831, LL=−1233, npar = 76). Direct effects for this model are shown in online Supplementary Table S2.
Latent classes
ADHD
As indicated above, a five-class solution gave the best fit for the ADHD group. This can be conceptualized as five subgroups of participants with ADHD, with similar performance within each subgroup across all tasks and measures. In the ADHD group, three larger and two smaller subgroups were found (consisting of 36.7, 30.6, 19.7, 9.6 and 3.3% of the participants). The subgroups were numbered 1–5 according to their size, where subgroup 1 was the largest and subgroup 5 the smallest. Mean age within the subgroups ranged between 9.9 and 13.6 years (13.3, 13.6, 11.8, 12.4 and 9.9 years, respectively). Out of all participants with ADHD, 87% fit one of the three larger neuropsychological profiles. The latter two subgroups were too small (n < 10) to interpret the performance profiles. The performance profiles of the three largest subgroups are shown in Fig. 1. Subgroup 1 showed a profile with short reaction times and above average go and nogo accuracy, and was named the ‘quick and accurate’ subgroup. Subgroup 2 had poor nogo accuracy (for both expected and unexpected nogo trials) and hence was named the ‘poor cognitive control’ subgroup. Subgroup 3 showed slow and variable reaction times, and a low benefit in reaction time to predictable trials (RTbenefit), and was thus named the ‘slow and variable timing’ subgroup. Note that these names serve merely as a label, and represent our subjective interpretation of the data.

Fig. 1. Subgroups of individuals with attention deficit hyperactivity disorder (ADHD), based on latent class analysis of their individual performance profiles. MRT, Mean reaction time; ICV, intra-individual coefficient of variation; RT, reaction time; Regr Coeff, regression coefficient. Note: the figure shows the average Z values for the 12 input variables, per latent subgroup within the ADHD group. Only the three largest latent subgroups are displayed.
Controls
For the typically developing controls, a five-class solution also fit the data best. Two larger and three smaller subgroups were found (consisting of 62.1, 23.5, 5.9, 5.8 and 2.6% of participants). The mean age of these subgroups varied between 9.0 and 15.8 years (13.2, 15.8, 11.3, 12.3 and 9.0 years). Eighty-six percent of control subjects fit one of the two larger neuropsychological profiles. The latter three subgroups were too small (n < 10) to interpret the performance profiles. The performance profiles of the two largest subgroups are shown in Fig. 2. The first subgroup had fast reaction times with limited variability and high go accuracy, and was named the ‘quick and accurate’ control subgroup. The second subgroup had slow and variable reaction times and a low benefit in reaction time to predictable trials (RTbenefit), and was named the ‘slow and variable timing’ control subgroup.

Fig. 2. Subgroups of typically developing controls, based on latent class analysis of their individual performance profiles. MRT, Mean reaction time; ICV, intra-individual coefficient of variation; RT, reaction time; Regr Coeff, regression coefficient. Note: The figure shows the average Z values for the 12 input variables, per latent subgroup within typically developing controls. Only the two largest subgroups are displayed.
Comparison of latent class profiles between ADHD and controls
Figure 3a, b shows the profiles of two ADHD and control subgroups in a single graph. Upon visual inspection it is clear that the profile of the ‘quick and accurate’ subgroup in ADHD strongly resembles the first subgroup in controls (see Fig. 3b). The ‘slow and variable timing’ subgroup in ADHD resembles the second subgroup in controls. Therefore, these ADHD subgroups have performance patterns that are qualitatively similar to control subgroups. However, it should be borne in mind that these figures display the adjusted Z scores and as such disregard any quantitative differences. To address this, we investigated whether the subgroups showing similar profiles differed quantitatively. We found an effect of diagnosis on performance measures for the two ‘slow and variable timing’ subgroups (ADHD and control; F 12,33 = 5.39, p < 0.001). By contrast, we found no performance differences between the two ‘quick and accurate’ subgroups (ADHD and control; F 12,100 = 1.29, p = 0.237). For the third ADHD subgroup with poor cognitive control, there was no equivalent subgroup among controls.

Fig. 3. The ‘slow and variable timing’ and the ‘quick and accurate’ subgroups of individuals with attention deficit hyperactivity disorder (ADHD) show a similar pattern of performance to comparable subgroups among control subjects. MRT, Mean reaction time; ICV, intra-individual coefficient of variation; RT, reaction time; Regr Coeff, regression coefficient. Note: the figure shows the average Z values per latent subgroup for the 12 input variables. Z values of the ADHD group are adjusted to correct for baseline group differences.
Questionnaire data
Exploratory analyses were performed to test for differences between the three ADHD subgroups in parent-rated SNAP-IV (n = 71) and CBCL (n = 63) measures of behavioural problems. There was a significant effect of LCA subgroup on the internalizing problems subscale of the CBCL (F 2,52 = 3.72, p = 0.031). Subjects from the ADHD subgroup with poor cognitive control showed the most internalizing problems. Post-hoc comparisons (Bonferroni-corrected) indicated that the mean score of the subgroup with poor cognitive control (mean = 11.58, s.d. = 6.69) differed from the ‘slow and variable timing’ subgroup (mean = 6.80, s.d. = 4.65), but not from the ‘quick and accurate’ subgroup (mean = 8.29, s.d. = 4.23). For the SNAP-IV data, there were no effects of subgroup on any of the subscales.
Discussion
Building on multiple pathway models of ADHD, we aimed to investigate heterogeneity in neuropsychological task performance. We used LCA to classify individuals into subgroups based on their overall task performance. This type of analysis differs from traditional analyses of performance, where mean values are compared between groups, as it specifically addresses within-group heterogeneity in performance. Moreover, LCA uses a more direct approach than factor analytical techniques, as they first reduce variables into factors and then classify individuals using a performance cut-off, and as such make the assumption that the translation from variables to factors is homogeneous across the whole group (Sonuga-Barke et al. Reference Sonuga-Barke, Bitsakou and Thompson2010; de Zeeuw et al. Reference de Zeeuw, Weusten, van Dijk, van Belle and Durston2012). Previous studies have used LCA to define subgroups of individuals with ADHD at the symptom level, and have subsequently analysed between-subgroup differences in neuropsychological performance (van der Meer et al. Reference van der Meer, Oerlemans, van Steijn, Lappenschaar, de Sonneville, Buitelaar and Rommelse2012) or genotype (Li & Lee, Reference Li and Lee2012). We built more directly on multiple pathway models of ADHD (Nigg et al. Reference Nigg, Willcutt, Doyle and Sonuga-Barke2005; Sonuga-Barke, Reference Sonuga-Barke2005; Durston et al. Reference Durston, van Belle and de Zeeuw2011), as we applied an inter-individual approach to analysing neuropsychological performance data: we defined subgroups at the neuropsychological level and carried these groups forward to study differences at the symptom level.
Dividing subjects with ADHD into subgroups based solely on their neuropsychological performance, resulted in five subgroups, two of which were too small to investigate further. We had hypothesized that we would find subgroups with poor cognitive control, poor sensitivity to reward and poor temporal processing in ADHD. We found evidence of a subgroup with poor cognitive control (the ‘poor cognitive control’ subgroup) and poor temporal processing (the ‘slow and variable timing’ subgroup), but not of a group with poor sensitivity to reward. Although there was an overall group difference in sensitivity to reward between ADHD and control subjects, we did not find a subgroup related to reward sensitivity. This might reflect a lack of inter-individual variance in reward sensitivity within ADHD, but could also be an effect of the emphasis on parsimony in the model we used.
The ‘poor cognitive control’ subgroup had a profile that distinguished itself by low accuracy on the nogo trials (Fig. 1). The performance of this subgroup is in keeping with models that place poor cognitive control at the core of neuropsychological dysfunction in ADHD (e.g. Barkley, Reference Barkley1997). However, this subgroup represented only 31% of the subjects with ADHD in our sample. The ‘slow and variable timing’ subgroup represented 20% of all participants with ADHD and had a profile with slow and variable reaction times, and a low benefit in reaction time on predictable trials. This reduced benefit of trials being predictable in time, suggests there may be a role for deficient motor or perceptual timing in this subgroup of subjects with ADHD. However, slow and variable reaction times may also reflect fluctuations in sustained attention and/or concurrent attentional lapses. This particular performance profile is in keeping with models that emphasize bottom-up intrusions of the default mode network into task-specific processing in ADHD (Sonuga-Barke & Castellanos, Reference Sonuga-Barke and Castellanos2007) and with models of top-down deficits in state-regulation in ADHD (Sergeant, Reference Sergeant2005). Finally, the last subgroup, which represented 37% of all participants with ADHD, was characterized by quick and accurate performance.
There were clear similarities between two of the ADHD subgroups and subgroups from the control analysis: the ‘quick and accurate’ ADHD subgroup and the ‘slow and variable timing’ ADHD subgroup both had counterparts among controls. However, when analysed in a traditional way, the ‘slow and variable timing’ subgroup in ADHD had poorer task performance than its counterpart subgroup in controls. This is in line with findings by Fair and colleagues (2012), who concluded that some of the heterogeneity in ADHD might be ‘nested’ in the normal variation. By contrast, there were no performance differences between the two ‘quick and accurate’ subgroups, indicating that a fairly large proportion of participants with ADHD performed as well as the best performing subgroup of control participants. We did not find a control counterpart for our ADHD subgroup with poorer cognitive control. This could be taken to suggest that this pattern of performance in ADHD is qualitatively different from the distribution of performance in controls. Such dissociation between extremes of normal variation on one side and categorical differences on the other is particularly interesting in the light of the ongoing debate about dimensionalizing psychiatric disorders. Our results support the notion that both categorical and dimensional approaches are valuable in child and adolescent psychology, as was stressed in a recent review by Coghill & Sonuga-Barke (Reference Coghill and Sonuga-Barke2012).
Classifying individuals with ADHD into neuropsychologically defined subgroups is one way to address the heterogeneity in ADHD. Additional insights at the neuropsychological level may then be used to inform us on heterogeneity at the behavioural (symptom) level or even, in longitudinal studies, on outcome. In order to test the principle of studying behavioural heterogeneity from a neuropsychologically informed perspective, this study tested for cross-sectional associations between ADHD neuropsychological subgroup and symptoms. Parents of participants in the ‘poor cognitive control’ subgroup reported more internalizing problems than the other groups. Various studies have described elevated levels of internalizing problems in ADHD (Faraone et al. Reference Faraone, Biederman, Weber and Russell1998; Daviss, Reference Daviss2008; Williams et al. Reference Williams, Hermens, Palmer, Kohn, Clarke, Keage, Clark and Gordon2008; Franke et al. Reference Franke, Faraone, Asherson, Buitelaar, Bau, Ramos-Quiroga, Mick, Grevet, Johansson, Haavik, Lesch, Cormand and Reif2011). However, in our data, internalizing problems were more prevalent in one particular subgroup. This could signal that this subgroup distinguished itself not only in neuropsychological performance, but also in terms of behaviour. As this was an exploratory part of our study and we had limited power to investigate subgroup differences in behaviour, this finding could also represent a more general increase in behaviour problems that only reached significance for the internalizing subscale. It could also represent a chance finding altogether.
This study illustrates how using a data-driven approach in the context of a theoretical framework can be applied to neuropsychological heterogeneity in ADHD to parse affected individuals into more homogeneous subgroups, defined by similar neuropsychological profiles. This represents an operationalization of the traditional endophenotype approach (Gottesman & Gould, Reference Gottesman and Gould2003), where defining subgroups – particularly on a neurobiologically plausible basis – can be used to investigate other levels, either behavioural (as was done here), or neurobiological (Durston, Reference Durston2010).
In sum, we used an alternative approach to data reduction to define subgroups of individuals with ADHD with different patterns of neuropsychological task performance, in keeping with predictions from multiple-pathway hypotheses of ADHD. Of three identified subgroups, two had patterns of task performance with separable deficits in domains predicted by such models: cognitive control and timing. Two of the subgroups of individuals with ADHD had performance patterns that were similar to subgroups of typically developing controls: in both ADHD and controls, we found a subgroup with good task performance, and a subgroup with variable timing. A third subgroup of individuals with poor cognitive control was identified among subjects with ADHD, with no equivalent among controls. This combination of quantitative and qualitative differences in performance patterns between subjects with ADHD and controls suggests that there may be both categorical and dimensional differences that distinguish subjects with ADHD from typically developing individuals; and that for some subjects categorical differences may be more relevant than dimensional ones. This is relevant to ongoing discussions on dimensionalizing psychiatric disorders. Finally, perhaps the most important contribution of this study is that it demonstrates the added value of investigating within-group differences in ADHD. We have shown that by formally addressing neuropsychological heterogeneity in ADHD, more homogeneous subsets of individuals can be identified. Analyses based on differences between neurobiologically defined subgroups have great potential for studying biological heterogeneity in psychiatric disorders.
Limitations
This study used only two tasks. As a result, the neuropsychological constructs addressed here relied on one task per construct. We recommend that future studies use multiple tasks per neuropsychological domain. Furthermore, we included a broad age range (6–25 years). We took this into account in the modelling of latent classes. In addition, there were no significant age differences between the LCA subgroups. However, given the considerable, nonlinear neurodevelopmental changes in ADHD, future studies are recommended to investigate to what extent these results are generalizable in an equivalent way for all age groups.
Supplementary material
For supplementary material accompanying this paper visit http://dx.doi.org/10.1017/S0033291714001792.
Acknowledgements
This work was supported by a grant from the Netherlands Organization for Scientific Research (Nederlandse Organisatie voor Wetenschappelijk Onderzoek, NWO) (S.D., grant number Vici-453-10-005). We thank all the participants, parents and teachers who participated in this study. We also thank the research assistants and interns, and all the members of our team that contributed to data collection.
Declaration of Interest
None.