


INTRODUCTION
The beginning of the last deglaciation in interior North America was marked by a separation of the Cordilleran and Laurentide Ice Sheets (CIS, LIS) and the formation of an ice-free corridor (IFC used through this paper) as the LIS retreated eastward from the eastern foot of the Rocky Mountains. The IFC has long been a subject of discussion because of its importance as a biogeographic connection between non-glaciated Beringia and the rest of the Americas south of the ice sheets (Johnston, Reference Johnston and Jenness1933; Antevs, Reference Antevs1935; Mandryk et al., Reference Mandryk, Josenhans, Fedje and Mathewes2001; Goebel et al., Reference Goebel, Waters and O'Rourke2008; Ives et al., Reference Ives, Froese, Supernant, Yanicki, Graf, Ketron and Waters2014; Heintzman et al., Reference Heintzman, Froese, Ives, Soares, Zazula, Letts and Andrews2016; Pedersen et al., Reference Pedersen, Ruter, Schweger, Friebe, Staff, Kjeldsen and Mendoza2016; Potter et al., Reference Potter, Reuther, Holliday, Holmes, Miller and Schmuck2017). Migration of animal species has been documented through the corridor (Shapiro et al., Reference Shapiro, Drummond, Rambaut, Wilson, Matheus, Sher and Pybus2004; Heintzman et al., Reference Heintzman, Froese, Ives, Soares, Zazula, Letts and Andrews2016) and, importantly, it has been suggested as one of the routes that humans might have taken when settling the Americas in the late Pleistocene (Johnston, Reference Johnston and Jenness1933; Antevs, Reference Antevs1935; Haynes, Reference Haynes2002; Potter et al., Reference Potter, Reuther, Holliday, Holmes, Miller and Schmuck2017). Despite its importance for testing evolutionary models and the rates and nature of human migration in North America, relatively little information exists about the precise age of the initial opening of the IFC (Dyke et al., Reference Dyke, Moore and Robertson2003; Dyke, Reference Dyke, Ehlers and Gibbard2004; Ives et al., Reference Ives, Froese, Supernant, Yanicki, Graf, Ketron and Waters2014; Potter et al., Reference Potter, Reuther, Holliday, Holmes, Miller and Schmuck2017). The minimum limiting radiocarbon dates available are subject to a lag, of unknown duration, between the ice retreat and the deposition of the recovered organic material.
The IFC represents the land area formed as the LIS and CIS separated during deglaciation. The IFC measured more than 2000 km in length from north to south, and the last portion to open is suggested to have been between 62 and 65°N at 13–12.5 14C ka (15.6–14.8 cal ka; Dyke et al., Reference Dyke, Moore and Robertson2003), in an area formerly occupied by the northern slopes of the Cordilleran–Laurentide ice saddle (Dyke and Prest, Reference Dyke and Prest1987; Tarasov et al., Reference Tarasov, Dyke, Neal and Peltier2012; Peltier et al., Reference Peltier, Argus and Drummond2015; Lambeck et al., Reference Lambeck, Purcell and Zhao2017). However, the opening of the corridor started in the south, with a wedge of unglaciated terrain growing between the eastern front of the Rocky Mountains and the retreating ice margin of the southwestern LIS (Dyke et al., Reference Dyke, Moore and Robertson2003; Dyke, Reference Dyke, Ehlers and Gibbard2004). To establish a more precise age on the opening, it is desirable to use methods that directly date the initial ice retreat. Cosmogenic nuclide exposure dating of erratic boulders can provide such ages. Here we use 10Be in quartz to determine the age of the Foothills Erratics Train (FET) in order to establish the timing of the separation of the southwestern LIS from the eastern front of the Rocky Mountains.
THE FOOTHILLS ERRATICS TRAIN
The FET consists of large quartzite blocks scattered in a linear pattern along the eastern foothills of the Rocky Mountains in southern Alberta. The FET stretches between ~53.5 and 49°N over a distance of almost 600 km (Stalker, Reference Stalker1956; Jackson et al., Reference Jackson, Phillips, Shimamura and Little1997; Jackson, Reference Jackson and Slaymaker2017; Fig. 1), and its distribution documents the interaction between the local montane, Cordilleran, and Laurentide ice masses during the last glacial maximum (LGM; Fig. 1). The quartzite blocks of the FET originate from the Lower Cambrian Gog Group of the Canadian Rocky Mountains, likely largely but not exclusively, from the Mount Edith Cavell area of Jasper National Park (Mountjoy, Reference Mountjoy1958; Roed et al., Reference Roed, Mountjoy and Rutter1967; Fig. 1). It has been speculated that the blocks were part of a rock fall from Mount Edith Cavell onto the surface of the Athabasca Valley glacier that brought them onto the foothills (Stalker, Reference Stalker1956; Jackson et al., Reference Jackson, Phillips, Shimamura and Little1997).
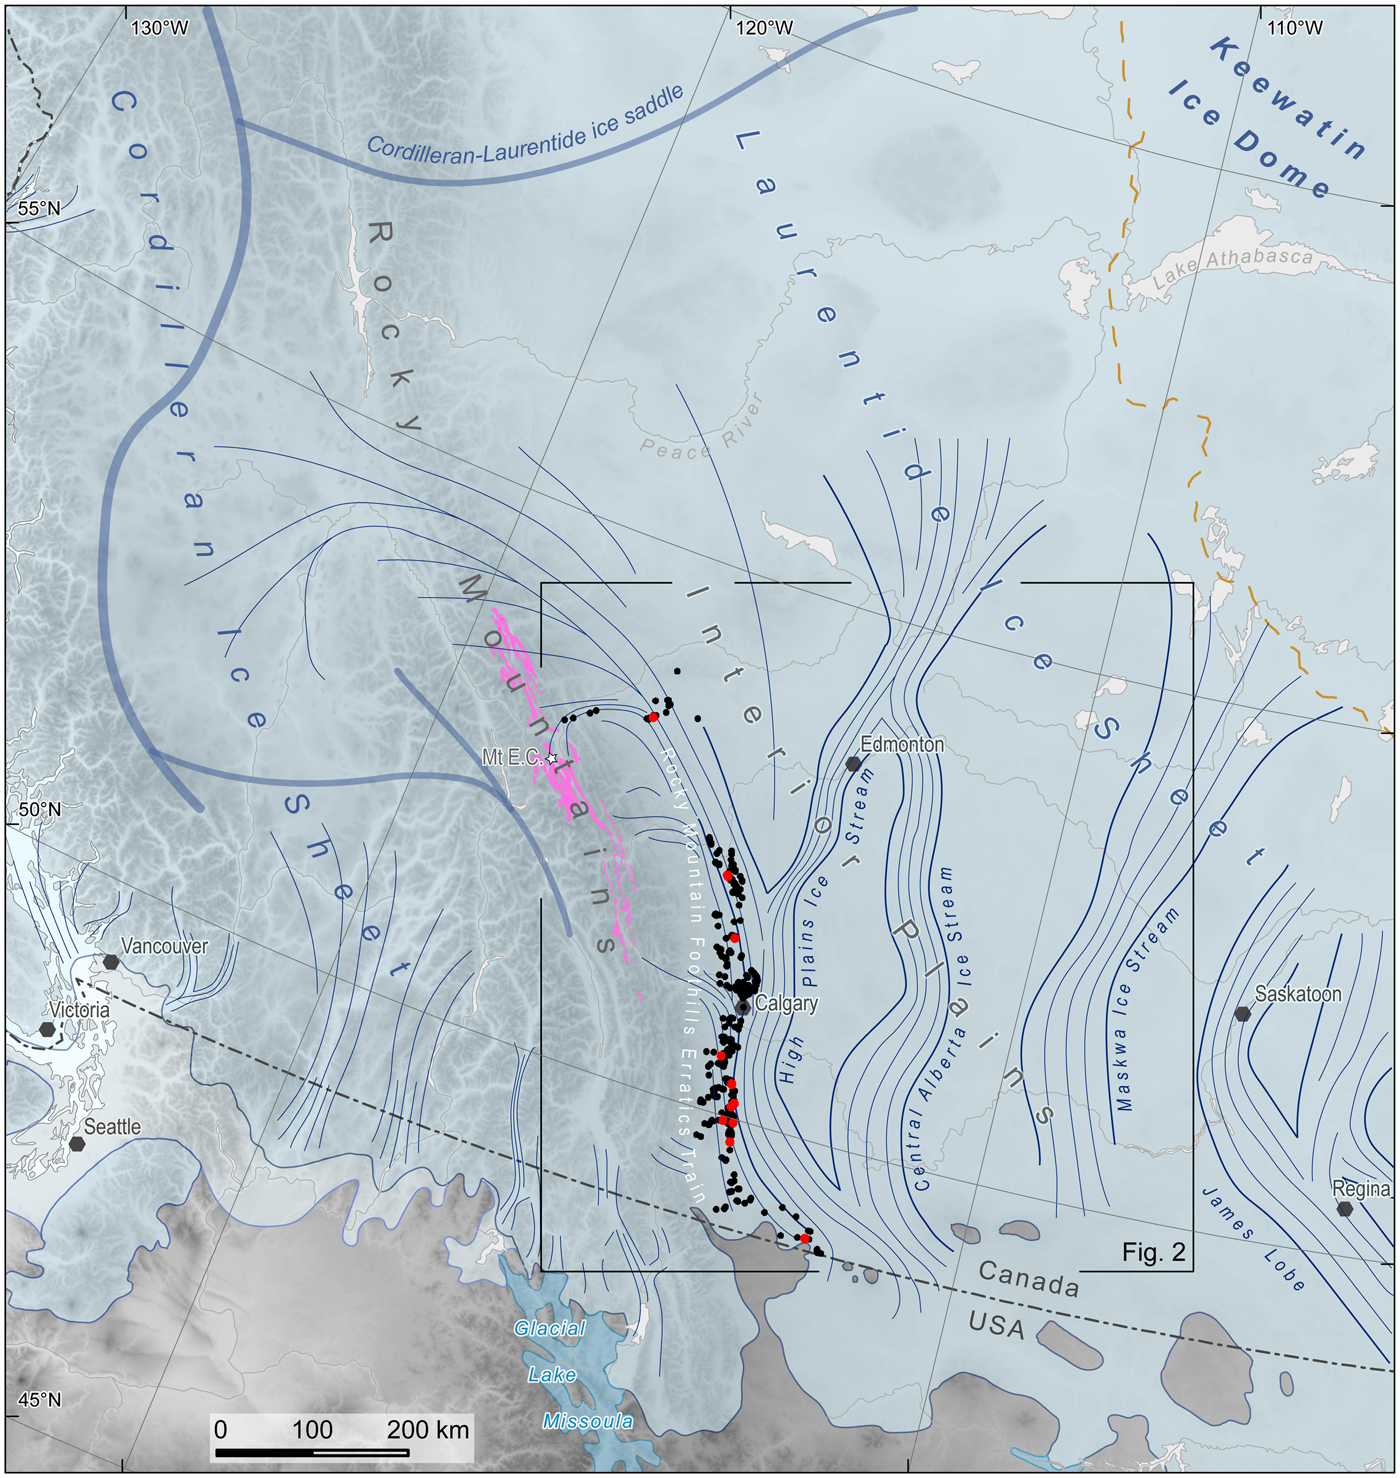
Figure 1. Regional ice sheet configuration at ~19 ka (16 14C ka) based on Dyke et al. (Reference Dyke, Moore and Robertson2003) and Margold et al. (Reference Margold, Jansson, Kleman, Stroeven and Clague2013, Reference Margold, Stokes and Clark2018) with time-transgressive maximum Wisconsinan/Fraser ice extent in lighter blue. Ice-flow direction is indicated by thin blue lines with lateral margins of major ice streams demarcated by bolder lines. Ice divides are drawn in blue-gray; note that the position of the ice divides in the Cordilleran Ice Sheet is little understood (cf. Margold et al., Reference Margold, Jansson, Kleman, Stroeven and Clague2013; Seguinot et al., Reference Seguinot, Rogozhina, Stroeven, Margold and Kleman2016). The Lower Cambrian Gog Group of the Canadian Rocky Mountains, the source of quartzite erratics, is drawn in pink, and the blocks of the FET mapped by Stalker (Reference Stalker1956) are drawn in black. The localities of our samples are drawn in red. The location of Fig. 2 is indicated by a black rectangle. (For interpretation of the references to color in this figure legend, the reader is referred to the web version of this article.)
The highest portions of the Rocky Mountains hosted local ice-dispersal centres at the LGM, while at the regional scale, Cordilleran ice was drained from the Interior Plateau in British Columbia across the Continental Divide in the Rocky Mountains to the Interior Plains (Fig. 1). South of the Peace River, Cordilleran ice was deflected by Laurentide ice to flow in a southeasterly direction along the Rocky Mountain Foothills, forming a tributary of the High Plains Ice Stream, itself a branch of an ice-stream system draining the saddle between the CIS and the Keewatin Ice Dome of the LIS (Margold et al., Reference Margold, Stokes and Clark2018; Fig. 1). Local montane ice emanating from the eastern outlets of the Rocky Mountains was captured by this ice-stream system and flowed along the right lateral margin of the High Plains Ice Stream (Fig. 1). This configuration of ice masses is well documented by the dispersal pattern of the FET and the glacial geomorphological record of the Interior Plains (Ross et al., Reference Ross, Campbell, Parent and Adams2009; Margold et al., Reference Margold, Stokes and Clark2015, Reference Margold, Stokes and Clark2018).
The deposition of the FET marked the separation of the Laurentide and local montane ice masses and the initial deglaciation of the eastern slopes of the Rocky Mountains. A wedge of ice-free terrain formed between the Rocky Mountains and the Laurentide ice front retreating towards the northeast (White et al., Reference White, Mathewes and Mathews1985; Dyke and Prest, Reference Dyke and Prest1987; Dyke, Reference Dyke, Ehlers and Gibbard2004; Fig. 2).

Figure 2. (a) Available chronological data in the region of the Foothills Erratics Train (FET). The Gog Group and the FET erratics are drawn in light pink. Available quantitative ages are drawn; see the legend for symbology, Table 1 for 36Cl ages reported in Jackson et al. (Reference Jackson, Phillips, Shimamura and Little1997, Reference Jackson, Phillips and Little1999, Reference Jackson, Andriashek, Phillips, Ehlers, Gibbard and Hughes2011), Table 2 for ages from this study, and Table 3 for available 14C ages. Ice margin isochrones of Dyke et al. (Reference Dyke, Moore and Robertson2003) are drawn in shades of blue. (b) Close-up for the area of the Porcupine Hills. See panel a for location. (For interpretation of the references to color in this figure legend, the reader is referred to the web version of this article.)
The FET was a target of one of the early studies that employed cosmogenic nuclide exposure dating to reconstruct deglaciation ages. Jackson et al. (Reference Jackson, Phillips, Shimamura and Little1997) dated eight samples from the FET by measuring whole-rock cosmogenic 36Cl. The ages obtained ranged from 19.9 ± 2.5 to 10.8 ± 1.6 ka (excluding an outlier of 48.2 ± 6.5 ka; all ages are recalculated using an up-to-date production rate and scaling, and assume zero erosion; Fig. 2, Table 1, Supplementary Data) and they were, in combination with the study of Young et al. (Reference Young, Burns, Smith, Arnold and Rains1994), key to the argument that broad coalescence of the Laurentide, Cordilleran, and local montane ice masses in central and southern Alberta only happened in the Late Wisconsinan (Oxygen Isotope Stage 2). However, the relatively large spread of the 36Cl ages prevented the authors from making inferences on the timing of the ice retreat. We have elected to resample some of the FET boulders dated by Jackson et al. (Reference Jackson, Phillips, Shimamura and Little1997) along with others that were not previously dated. The 36Cl chronometer has, in this case, two disadvantages. First, when whole-rock samples are used (as was common at the time of Jackson et al. [1997]), there is a variable but often significant component of 36Cl that is produced when slow (thermal) cosmogenic or radiogenic neutrons are captured by native 35Cl (the most abundant isotope of natural chlorine in rock minerals such as hornblende, biotite, and quartz fluid inclusions). The disadvantage therefore relates to the contribution to age uncertainty owing to (1) the difficulty of precisely measuring the 35Cl concentration and (2) the inability to know the history of moisture contents and snow cover over millennial time scales, factors that moderate the thermal neutron flux in complex ways (Dunai et al., Reference Dunai, Stuart, Pik, Burnard and Gayer2007; Zweck et al., Reference Zweck, Zreda and Desilets2013; Delunel et al., Reference Delunel, Bourles, van der Beek, Schlunegger, Leya, Masarik and Paquet2014). Second, the production rate of 36Cl is more poorly defined than that of 10Be (Phillips et al., Reference Phillips, Argento, Balco, Caffee, Clem, Dunai and Finkel2016a, Reference Phillips, Argento, Bourlès, Caffee, Dunai, Goehring and Gosse2016b). We have therefore chosen to measure the ages using 10Be, and we do so for 16 boulders that span the length of the FET.
Table 1. 36Cl ages available for the region from the studies of Jackson et al. (Reference Jackson, Phillips, Shimamura and Little1997, Reference Jackson, Phillips and Little1999, Reference Jackson, Andriashek, Phillips, Ehlers, Gibbard and Hughes2011).

a See Supplementary Data for the methodology of the age recalculation.
b Jackson et al. (Reference Jackson, Phillips, Shimamura and Little1997).
c Jackson et al. (Reference Jackson, Phillips and Little1999).
d Jackson et al. (Reference Jackson, Andriashek, Phillips, Ehlers, Gibbard and Hughes2011).
e Metadata indicated extremely high topographic shielding factors—possibly erroneous.
METHODS
Samples for cosmogenic nuclide exposure dating were collected with a diamond-blade cutoff saw and a hammer and chisel. Samples ALT-MM-15-10 and ALT-MM-15-11 were collected with a hammer and chisel only to minimize the visible traces of the sampling on the erratic blocks in publicly sensitive areas. Because large erratic blocks can be objects of significance for the Canadian First Nations (Brink, Reference Brink and Moore1981), we collaborated with the Alberta Archaeological Survey and inspected each sampled block closely to rule out the occurrence of artifacts or cultural modification.
The samples were prepared as BeO targets at CRISDal Lab, Dalhousie University, Halifax, Nova Scotia, Canada. To concentrate sufficient quartz (20 g) from each sample, the following procedure was used. The samples were cleaned, crushed, and ground, and the 250–355 mm fraction was rinsed, leached in aqua regia (2 hours), and etched in hydrofluoric (HF) before mineral separation using combinations of froth flotation, Frantz magnetic separation, air abrasion, heavy liquids, and controlled digestions of non-quartz phases using HF or hexafluorosilicic acids. When the quartz concentration was sufficiently pure (as determined optically and with <100 ppm Al and Ti as determined on a 1 g aliquot with the lab's Teledyne-Leeman Prodigy Inductively Coupled Plasma-Optical Emission Spectrometer), approximately 35 wt% of the dried quartz concentrate was removed in an ultrasonic bath with dilute HF as per Kohl and Nishiizumi (Reference Kohl and Nishiizumi1992). The samples were spiked with approximately 240 μg Be of the lab's BeCl2 carrier (‘Be-Carrier-31-28Sept2012’; prepared from a deeply mined Ural Mountain phenacite with 10Be/9Be below 1 × 10⁻¹⁶) and were digested in a HF-HNO3 mixture, evaporated twice in perchloric acid, and treated with anion and cation column chemistry to isolate the Be2+. After acidifying the samples with perchloric and nitric acid to remove residual B, Be(OH)2 was precipitated using ultrapure ammonia gas, transferred to a cleaned boron-free quartz vial, and carefully calcined in a Bunsen burner flame to a white oxide for over 3 minutes. The BeO was powdered, mixed 2:3 by volume with high-purity niobium powder (325 mesh), and packed into stainless-steel cathodes for 10Be/9Be measurement at the Centre for Accelerator Mass Spectrometry, Lawrence Livermore National Lab, Livermore, California, USA. These measurements were made against the 07KNSTD3110 standard with a known ratio of 10Be/9Be = 2850 × 10−15 (Nishiizumi et al., Reference Nishiizumi, Imamura, Caffee, Southon, Finkel and McAninch2007). Process blanks were also analyzed and used to subtract 10Be introduced during target preparation and analysis. For all samples, this correction was less than 1% of the adjusted 10Be values.
Exposure ages were calculated using the online calculator by Balco et al. (Reference Balco, Stone, Lifton and Dunai2008; version 3.0, constants 3.0.3) and are reported here using the time-dependent CRONUS LSDn production rate scaling of Lal (Reference Lal1991) and Stone (Reference Stone2000), using the ‘primary’ calibration set of Borchers et al. (Reference Borchers, Marrero, Balco, Caffee, Goehring, Lifton, Nishiizumi, Phillips, Schaefer and Stone2016). Individual ages are reported with external error.
We report the exposure ages without a correction for snow shielding. The region has dry cold winters, resulting in a thin, low-density snowpack, and most of the sampled blocks were in the open and had substantial relief above the ground. It can thus be assumed that the top surfaces of the sampled blocks accumulate little to no snow in winter. Quartzite is a highly resistant lithology, and the surfaces of the sampled blocks were free of moss cover or other vegetation. Considering the aridity, hardness of the quartzite boulders, and a sampling strategy designed to target boulder surfaces with no evidence of erosion, we report the exposure ages without a correction for surface erosion. This is supported by the conclusions of Jackson et al. (Reference Jackson, Phillips, Shimamura and Little1997, p. 197), who also suggested that erosion was negligible. However, because the erosion rates of our sampled surfaces remain unconstrained, we also provide a maximum age using the long-term quartzite bedrock erosion rates determined via 10Be cosmogenic nuclides for the Shenandoah National Park, Virginia, USA (1.78 ± 0.2 mm ka−1; Duxbury et al., Reference Duxbury, Bierman, Portenga, Pavich, Southworth and Freeman2015; Table 2).
Table 2. Cosmogenic 10Be sample data and modeled surface exposure ages.

a The tops of all samples were exposed at the surface.
b Shielding factor is 1 for all samples.
c A density of 2.65 g/cm3 was used based on the quartzite composition of the samples, with the exception of sample ALT-MM-15-01, for which a density of 2.7 g/cm3 was used based on its granitic composition.
d All uncertainties are reported at the 1-sigma level. Blank corrected 10/9 ratios. See text for details on level of blanks.
e Exposure ages were calculated with the online calculator formerly known as CRONUS (Balco et al., Reference Balco, Stone, Lifton and Dunai2008), version 3.0, constants 3.0.3 (http://hess.ess.washington.edu). Full details of the cosmogenic 10Be analyses and exposure age calculations are provided in Methods Section.
f Jackson et al. (Reference Jackson, Phillips, Shimamura and Little1997), sample H; see Fig. 2b, Table 1.
g Jackson et al. (Reference Jackson, Phillips, Shimamura and Little1997), sample F; see Fig. 2b, Table 1.
h Jackson et al. (Reference Jackson, Phillips, Shimamura and Little1997), samples D and E; see Fig. 2b, Table 1.
FIELD SITES
Our data set stretches over the length of the FET in Canada (Figs. 1 and 2) between 49.1 and 53.8°N and is confined to elevations between 990 and 1230 m above sea level (m asl). The southernmost sample, ALT-MM-15-01, from the Del Bonita area (Figs. 2 and 3a), is of Shield origin (given its granite lithology) and thus does not belong to the FET, even though it is situated within the southeastern limit of the FET. Samples ALT-MM-15-02 to ALT-MM-15-11, all large quartzite blocks and thus members of the FET, were collected in the eastern slopes of the Porcupine Hills, a portion of the Southern Alberta Uplands that reaches up to ~1650 m asl (Fig. 2). Blocks from which samples ALT-MM-15-02 and ALT-MM-15-03 were taken were a part of a group of large quartzite blocks on a broad ledge at 1120 m asl, ~100 m above the foot of the slope where the Porcupine Hills rise from the plains (Figs. 2 and 3b and c). Sample ALT-MM-15-04 was collected from a block in the plain at 1006 m asl, 20 km N of ALT-MM-15-02 and ALT-MM-15-03 (Figs. 2 and 3d). Ten km to the west, samples ALT-MM-15-05 to ALT-MM-15-07 were collected from three large blocks perched on a slope of ~15° (Figs. 2 and 3e–g). The relatively steep slope would normally render them unsuitable for cosmogenic nuclide exposure dating (owing to concerns about their postdeposition stability); however, they were sampled by Jackson et al. (Reference Jackson, Phillips, Shimamura and Little1997; Fig. 2), returning ages close to the mean of their data set, and we thus resampled these blocks. Samples ALT-MM-15-08 and ALT-MM-15-09 were collected from blocks located on the opposite sides of a west–east-oriented valley mouth, several tens of metres above the plain to the east (Figs. 2 and 3h and i). The samples lie in between two generations of large ice-marginal meltwater channels oriented in a north–south direction (Jackson et al., Reference Jackson, Leboe, Little, Holme, Hicock, Shimamura and Nelson2008; Atkinson et al., Reference Atkinson, Utting and Pawley2014a; note that Rains et al. [Reference Rains, Shaw, Sjogren, Munro-Stasiuk, Robert Skoye, Young and Thompson2002] interpreted these channels as subglacial tunnel channels; Fig. 2b). Samples ALT-MM-15-10 and ALT-MM-15-11 were collected from a broad ledge in the eastern slope of the Porcupine Hills at a locality near the Nanton Erratic that is of cultural significance for its rock art (Fig. 2; Brink, Reference Brink and Moore1981). The blocks we sampled were ~100 m from the main erratic, and we inspected them closely to rule out the occurrence of cultural modification.

Figure 3. (color online) Photographs of selected sampled blocks (see Fig. 2 for locations). (a) Sample ALT-MM-15-01 in the Del Bonita area. Note the chisel for scale. (b) A view in an eastern direction of the group of large blocks from which samples ALT-MM-15-02 and ALT-MM-15-03 were collected, with the Plains in the background. (c) Sample ALT-MM-15-02; see the person to the right of the block for scale. Sample ALT-MM-15-03 is visible in the background. (d) Sample ALT-MM-15-04. (e) View upslope of the group of large blocks from which samples ALT-MM-15-05 to ALT-MM-15-07 were collected. Sample ALT-MM-15-07 in the foreground (sample F of Jackson et al., Reference Jackson, Phillips, Shimamura and Little1997); note people for scale. Sample ALT-MM-15-05 is on the horizon (sample H of Jackson et al., Reference Jackson, Phillips, Shimamura and Little1997). (f) Sample ALT-MM-15-06, the young outlier. Note the split fragment on the right: the splitting could have affected the position of the rest of the block. (g) A view of the slope in which samples ALT-MM-15-05 to ALT-MM-15-07 are situated (their position is marked by white arrows). (h) Sample ALT-MM-15-08. (i) Sample ALT-MM-15-09, which returned an age of 169.5 ± 11.2 ka, a clear outlier. Concrete saw on the top of the block for scale. (j) Sample ALT-MM-15-12 (Jackson et al. [1997] sampled the two halves of the split block as their samples D and E). (k) Sample ALT-MM-15-14, which yielded an age of 22.4 ± 1.6 ka, an outlier. Person next to the block for scale. (l) Sample ALT-MM-15-16. Person next to the block for scale.
Sample ALT-MM-15-12 was collected from a block located in the broad valley of the Highwood River where it passes through the Okotoks Upland (Figs. 2 and 3j). The same block was sampled by Jackson et al. (Reference Jackson, Phillips, Shimamura and Little1997; see Fig. 2b). The location of sample ALT-MM-15-13 was ~120 km NNW of sample ALT-MM-15-12, in the Western Benchlands ~20 km east of the foot of the Central Foothills (Fig. 2). Samples ALT-MM-15-14 and ALT-MM-15-15 were collected from two blocks at the transition from the plains into the Western Benchlands (Figs. 2 and 3k). North of here, the plains and the foothills become forested, and identification of erratics in the field becomes much more difficult than on the prairies. We only collected one more sample, ALT-MM-15-16, in an area east of Hinton (Figs. 2 and 3l).
With the exception of ALT-MM-15-01, all of the targeted blocks were large, with a height of 1.2 to 3.5 m above the ground. The sampled surfaces were devoid of weathering rinds, but some of the blocks have undergone splitting into several fragments. We attempted to avoid surfaces that could have originated from a fragmentation of the original block.
RESULTS
The 10Be analytical data and exposure ages are presented in Table 2. Out of the 16 samples, three are clear outliers with ages that are incompatible with the regional glacial history: samples ALT-MM-15-09 and ALT-MM-15-14, which returned ages of 169.5 ± 11.2 and 22.4 ± 1.6 ka, respectively, and sample ALT-MM-15-06, which yielded an age of 8.2 ± 0.5 ka (the uncertainty stated for individual samples is their external error; i.e., uncertainty resulting from both the accelerator mass spectrometry (AMS) measurement and the adopted production rate). The remaining samples cluster between 17.7 ± 1.2 and 14.2 ± 0.9 ka (Figs. 2 and 4, Table 2). Even tighter clustering is reached when the only sample of Shield origin, ALT-MM-15-01 (17.7 ± 1.2 ka), is considered separately (Fig. 4). The remaining 12 samples fall into the period of ~2000 years between 16.3 ± 1.1 and 14.2 ± 0.9 ka. The weighted mean age of this group of 12 samples is 14.9 ka with a weighted standard deviation of 0.6 ka. This deviation is slightly larger than the mean internal uncertainty based solely on the AMS measurements (0.4 ka). Thus, to incorporate the more conservative internal error into the weighted mean age of the 12-sample data set, we combine in quadrature the weighted standard deviation (normalized by  $\sqrt n $) with the mean systematic error (obtained by deconvolving the AMS-based internal errors from the total errors, which are output as external errors in the online calculator). The representative combined age for the FET data set is then 14.9 ± 0.2(0.9) ka (error format = internal (total or ‘external’)).

Figure 4. (Colour online) (a) Cosmogenic 10Be apparent exposure ages plotted against the latitude at which the samples were collected. Note the lack of a clear trend (a decreasing age with increasing latitude would indicate a gradual unzipping of the Laurentide and local mountain ice masses). Outliers ALT-MM-15-06, ALT-MM-15-09, and ALT-MM-15-14 are not shown. The black horizontal line and the grey bar show the weighted mean age for the 12 displayed Foothills Erratics Train samples with its total (‘external’) uncertainty. (b) Probability distributions for the calculated ages (excluding the outliers ALT-MM-15-06, ALT-MM-15-09, and ALT-MM-15-14).
Within the individual sampling sites, the site where samples ALT-MM-15-02 and ALT-MM-15-03 were collected returned identical ages at three significant digits (Table 2). The remaining sites, where more than one sample was taken, display either a spread of ages above the weighted standard deviation of the 12-sample data set (15.0 ± 1.0 and 14.3 ± 0.9 ka, i.e., 0.7 ka for samples ALT-MM-15-05 and ALT-MM-15-07; and 15.6 ± 1.0 and 14.2 ± 0.9 ka, i.e., 1.4 ka for samples ALT-MM-15-10 and ALT-MM-15-11) or one of the ages is an outlier (Figs. 2 and 4).
All the collected samples are within a narrow elevation band, and therefore no correlation can be discerned between the measured age and elevation. Additionally, while the data set covers a considerable latitudinal distance (4.3° across the whole data set, 3.6° when only true FET samples are considered) and thus spans a significant stretch of the Laurentide–Cordilleran coalescence zone oriented in a NNW–SSE direction, no trends are observed between the deglaciation ages and latitude.
DISCUSSION
Interpreting 10Be concentrations
The issues of incomplete exposure and nuclide inheritance affecting the measured 10Be concentrations are commonly the main concerns when reconstructing deglaciation history with cosmogenic nuclide exposure dating (Heyman et al., Reference Heyman, Stroeven, Harbor and Caffee2011). However, in the case of the FET, the large size of the sampled blocks suggests that they have not emerged gradually from sediment matrix during the postdeposition period. The issue of incomplete exposure due to the degradation of landforms, on or within which the blocks were emplaced, can thus be ruled out. In contrast, nuclide inheritance most likely affected at least the oldest measured sample (ALT-MM-15-09; 169.5 ± 11.2 ka). We infer that the sampled surface was exposed in a cliff face for tens of thousands of years before its transport by ice and deposition at its current location. The age of the other old outlier (ALT-MM-15-14; 22.4 ± 1.6 ka) likely also results from nuclide inheritance, because the mid-LGM age cannot be a true deglaciation age, as all available records indicate that the region remained glaciated from about 25 ka (Young et al., Reference Young, Burns, Smith, Arnold and Rains1994) until the late glacial (Jackson et al., Reference Jackson, Phillips, Shimamura and Little1997, Reference Jackson, Phillips and Little1999; Dyke et al., Reference Dyke, Moore and Robertson2003; Dyke, Reference Dyke, Ehlers and Gibbard2004).
The only sample yielding an anomalously young age is ALT-MM-15-06, at 8.2 ± 0.5 ka. This is from a site where two other samples were measured at 15.0 ± 1.0 (ALT-MM-15-05) and 14.3 ± 0.9 ka (ALT-MM-15-07), and the measured age is thus a clear outlier. Samples ALT-MM-15-05 to ALT-MM-15-07 were collected from the group of three large blocks targeted by Jackson et al. (Reference Jackson, Phillips, Shimamura and Little1997; Fig. 3e–g), who report ages for their samples F (15.1 ± 2.3 ka) and H (14 ± 1.5) from that site (recalculated ages; Fig. 2, Table 1). The block sampled for ALT-MM-15-06, not sampled by Jackson et al. (Reference Jackson, Phillips, Shimamura and Little1997), appeared to have split, and we assumed that the half we sampled was left in the original position (Fig. 3f). However, it is possible that the block turned during the splitting, and the sampled surface has thus only been in its present, unshielded position since then.
The remaining 13 ages fall within the post-LGM time. The oldest of these ages is the southernmost sample, ALT-MM-15-01, at 17.7 ± 1.2 ka, which is of Shield origin. The remaining 12 ages are well clustered, with the northernmost sample (ALT-MM-15-16) somewhat older that the remaining 11 samples south of it (Fig. 4), and we thus suggest that the age of deglaciation of the area in which the samples are located is within the time envelope they encompass (ca. 16.3 to 14.2 ka). These 12 samples stretch almost 500 km along the length of the foothills and, as noted, no trend is apparent in the ages with regard to the latitude of the samples (Fig. 4). Comparing the mean internal uncertainty (438 yr; including AMS measurement, carrier concentration uncertainty, and blank subtraction) with the weighted standard deviation (575 yr), we find the data scatter ~2.5% more than what would be expected from the internal uncertainties. This additional scatter may have several causes. First, nuclide inheritance may have been contributed when the rock was exposed in the mountains or during supraglacial transport (Stalker, Reference Stalker1956; Jackson et al., Reference Jackson, Phillips, Shimamura and Little1997). Even if the blocks only melted to the ice sheet surface in the later stages of their journey—they would have been rapidly covered by snow after falling onto the surface of the ice sheet in its accumulation area and would thus have been transported englacially for most of their journey (e.g., Dunning et al., Reference Dunning, Rosser, McColl and Reznichenko2015)—the blocks could still have seen centuries of exposure during their transport before being deposited at their current sites. This was noted by Jackson et al. (Reference Jackson, Phillips, Shimamura and Little1997, p. 198), who stated that ‘it is not known how long the erratics were situated on melting ice before they came to rest in their present positions. It is possible that they radically changed surface orientation or rolled one or more times over a period of hundreds or perhaps a thousand years before being let down on terra firma.’
Second, the glacial isostatic adjustment (GIA) of the landscape affects the measured nuclide concentrations; the weight of the continental ice sheets caused subsidence of the land surface, and our sampling sites were therefore at a lower elevation at the time when the FET blocks were emplaced and the sampled surfaces started accumulating 10Be. However, most of the land surface rebound had already occurred during the thinning of the ice cover over the sampling sites and shortly after deglaciation, and the majority of the surface exposure history has therefore been at an elevation close to the modern (Lambeck et al., Reference Lambeck, Purcell and Zhao2017). While some other studies employing the cosmogenic nuclide chronometer, especially those from the former ice dome areas (e.g., Ullman et al., Reference Ullman, Carlson, Hostetler, Clark, Cuzzone, Milne, Winsor and Caffee2016), apply a correction for the GIA based on the published GIA reconstructions, we chose not to do so. This is because: (1) most of our sampling sites were located relatively close to the southern margin of the LIS at the LGM and were thus likely only slightly affected by glacioisostasy; (2) the available GIA reconstructions display large differences for the region of the CIS–LIS ice saddle (cf. Peltier, Reference Peltier2004; Peltier et al., Reference Peltier, Argus and Drummond2015; Lambeck et al., Reference Lambeck, Purcell and Zhao2017), which broadens the uncertainty of the GIA correction; and (3) most of the GIA studies employ the ice sheet chronology of Dyke et al. (Reference Dyke, Moore and Robertson2003) in their reconstructions, while our aim is to produce independent deglaciation ages against which the existing 14C chronology can be tested. The more northerly samples in our data set are more affected by the GIA than the southerly ones, and their real age is therefore somewhat older. This further weakens any age–latitude relationship (Fig. 4) and goes against the original hypothesis that the northerly samples should display younger ages, as would be expected for a gradual expansion of the IFC from the south.
Comparison of apparent 10Be exposure ages from this study with other data on regional deglaciation
Available quantitative ages for the time of deglaciation of the eastern foot of the Rocky Mountains and the western part of the Interior Plains consist of radiocarbon, 36Cl exposure dating, and optically stimulated luminescence (OSL) data. Radiocarbon dates on organic material provide minimum limiting ages on the timing of deglaciation. Consequently, only a few 14C ages in western Alberta are older than 12 14C ka (14.1 cal ka; Table 3). OSL ages from dune fields along the Athabasca River north of Edmonton indicate deglaciation 1000 to 2000 years earlier compared with Dyke et al.’s (Reference Dyke, Moore and Robertson2003) 14C-based ice-retreat reconstruction (Wolfe et al., Reference Wolfe, Huntley and Ollerhead2004; Munyikwa et al., Reference Munyikwa, Feathers, Rittenour and Shrimpton2011, Reference Munyikwa, Rittenour and Feathers2017; Fig. 2). Previous studies employing cosmogenic nuclide exposure dating in the Rocky Mountain Foothills and on the western Interior Plains have used 36Cl (Jackson et al., Reference Jackson, Phillips, Shimamura and Little1997, Reference Jackson, Phillips and Little1999, Reference Jackson, Andriashek, Phillips, Ehlers, Gibbard and Hughes2011). The large spread of 36Cl ages limits the interpretation of their spatial significance (Fig. 2, Table 1).
Table 3. Selected radiocarbon ages pertaining to the deglaciation of the southern Rocky Mountains and the western Interior Plains.a

a The ages were calibrated using Oxcal 4.3 (Bronk Ramsey, Reference Bronk Ramsey2009) with IntCal13 calibration curve (Reimer et al., Reference Reimer, Bard, Bayliss, Beck, Blackwell, Ramsey and Buck2013).
b Comments in Dyke et al. (Reference Dyke, Moore and Robertson2003): Possible hard-water error.
c Comments in Dyke et al. (Reference Dyke, Moore and Robertson2003): Questioned by Clayton et al. (Reference Clayton, Moran and Bluemle1980) but not problematic for deglaciation; bone dates generally too young rather than too old.
d Comments in Dyke et al. (Reference Dyke, Moore and Robertson2003): Collector regards date as anomalously old for enclosing sediment; however, not improbable for this location (kettle lake).
The age of our Shield sample (ALT-MM-15-01; Fig. 2, Table 2) at 17.7 ± 1.2 ka is consistent with the timing of ice retreat from the Del Bonita area reconstructed by Dyke et al. (Reference Dyke, Moore and Robertson2003), which they suggest occurred between 17.4 and 16.8 cal ka. To date the FET, we focus on a tightly clustered group of 12 ages between 16.3 ± 1.1 and 14.2 ± 0.9 ka, 8 of which are from the eastern slopes of the Porcupine Hills. We assume that the age of deglaciation is best approximated by the weighted mean age of the tightly clustered group of ages, which is 14.9 ± 0.9 ka. Our data thus indicate a later deglaciation of the southern foothills of the Rocky Mountains than suggested by Dyke et al. (Reference Dyke, Moore and Robertson2003). By ~14.8 ka (12.5 14C ka), Dyke et al. (Reference Dyke, Moore and Robertson2003) estimate the Laurentide ice front was ~200 km northeast from the foot of the Porcupine Hills (Fig. 2a), and they initiate the separation of the Laurentide and montane ice masses in the area of the Porcupine Hills already at ~19 ka to accommodate the 15.7 14C ka (21.8–16.9 cal ka) date of Beierle and Smith (Reference Beierle and Smith1998; Fig. 2, Table 3). Instead, the 10Be data indicate the separation of the western Laurentide margin from the Rocky Mountain Foothills at ~15 ka. We dismiss the Beierle and Smith (Reference Beierle and Smith1998) date as erroneous, in that it has never been reproduced and is in conflict with several lines of regional evidence (cf. Ives et al., Reference Ives, Froese, Supernant, Yanicki, Graf, Ketron and Waters2014).
The separation of the local montane and south-flowing Cordilleran and Laurentide ice happened at about or before the onset of the Bølling warming (which started abruptly at 14.6 ka; Rasmussen et al., Reference Rasmussen, Bigler, Blockley, Blunier, Buchardt, Clausen and Cvijanovic2014) and possibly resulted from the gradual increase in the boreal summer insolation and the warming of climate over western North America after 16 ka, indicated by increasing water temperature in the Gulf of Alaska (Praetorius and Mix, Reference Praetorius and Mix2014). It is also possible that the CIS, which reached its maximum extent at ~17 ka (Porter and Swanson, Reference Porter and Swanson1998; Margold et al., Reference Margold, Stroeven, Clague and Heyman2014; Stroeven et al., Reference Stroeven, Fabel, Margold, Clague and Xu2014) and likely had a dome over the Interior Plateau (Stumpf et al., Reference Stumpf, Broster and Levson2000; Margold et al., Reference Margold, Jansson, Kleman, Stroeven and Clague2013; Seguinot et al., Reference Seguinot, Rogozhina, Stroeven, Margold and Kleman2016), blocked transport of precipitation farther east, decreasing precipitation over the CIS–LIS saddle and on the northwestern and southwestern slopes of the Keewatin Ice Dome (Dyke et al., Reference Dyke, Andrews, Clark, England, Miller, Shaw and Veillette2002). By the time the ice masses separated, the LIS surface had already dropped considerably at the eastern Rocky Mountain front. The erratics we dated to ~15 ka are between 1000 and 1230 m asl, while the ice sheet surface had earlier covered the highest parts of the Porcupine Hills at >1600 m asl (Jackson et al., Reference Jackson, Phillips and Little1999). We do not distinguish any latitudinal trend in the separation of the Laurentide–Cordilleran and montane ice masses. A rapid opening of a long ice-free wedge along the southern Rocky Mountain front between 17 and 16 ka was suggested by Dyke et al. (Reference Dyke, Moore and Robertson2003). Based on the cosmogenic nuclide ages, the separation of the ice masses happened at least a millennium later than suggested by Dyke et al. (Reference Dyke, Moore and Robertson2003), but the spatial pattern of ice retreat they reported is supported by our results. The simultaneous detachment of the southwestern LIS margin from the mountain front might indicate a rapid weakening of the CIS–LIS saddle, and this inference is supported by the rapid succession of ice stream orientations on the Interior Plains (Margold et al., Reference Margold, Stokes and Clark2015, Reference Margold, Stokes and Clark2018).
Our ages indicate that the LIS margin retreated from the mountain front later than previously suggested, and if the Younger Dryas position of the LIS ice margin close to the boundary of the Canadian Shield in the ice margin chronology of Dyke et al. (Reference Dyke, Moore and Robertson2003) is correct, the ice-retreat rates over the Interior Plains must have been much higher than previously thought. The rapid ice retreat over the western Interior Plains coincided with the peak phase of the Bølling warming (Praetorius and Mix, Reference Praetorius and Mix2014; Rasmussen et al., Reference Rasmussen, Bigler, Blockley, Blunier, Buchardt, Clausen and Cvijanovic2014, Menounos et al., Reference Menounos, Goehring, Osborn, Margold, Ward, Bond and Clarke2017). Indeed, large ice-marginal meltwater channels in Alberta (Evans, Reference Evans2000; Atkinson et al., Reference Atkinson, Utting and Pawley2014a, Reference Atkinson, Utting and Pawley2014b) bear witness to the significant meltwater produced during this period of rapid retreat.
Relations between FET and the IFC
The ages for the FET have a bearing on the initial opening of the IFC in western Canada. Our data indicate that the southern portion of the corridor, up to 53.5°N, opened at about 14.9 ± 0.2(0.9) ka. To trace the opening of the IFC farther north, more data are needed from the region that was located directly beneath the CIS–LIS saddle during the LGM and the early late glacial. Such data would help to constrain the IFC chronology, which has been a subject of a lively debate (Ives et al., Reference Ives, Froese, Supernant, Yanicki, Graf, Ketron and Waters2014; Pedersen et al., Reference Pedersen, Ruter, Schweger, Friebe, Staff, Kjeldsen and Mendoza2016; Braje et al., Reference Braje, Dillehay, Erlandson, Klein and Rick2017; Potter et al., Reference Potter, Reuther, Holliday, Holmes, Miller and Schmuck2017, Reference Potter, Baichtal, Beaudoin, Fehren-Schmitz, Haynes, Holliday, Holmes and Ives2018a, Reference Potter, Beaudoin, Haynes, Holliday, Holmes, Ives and Kelly2018b; Darvill et al., Reference Darvill, Menounos, Goehring, Lian and Caffee2018) and for which a consensus has not yet been reached.
CONCLUSIONS
We applied 10Be exposure dating to reduce the uncertainty in the age of the FET. The oldest sample in our data set after exclusion of outliers is the only sample of Shield origin, collected in the Del Bonita area, which dates to 17.6 ka. This age conforms well with the existing ice margin chronology of Dyke et al. (Reference Dyke, Moore and Robertson2003). We further focus on the well-clustered group of 12 samples, 8 of which are from the Porcupine Hills, for our inferences on the regional deglaciation history. The weighted mean age of the well-clustered group is 14.9 ± 0.9 ka. This overlaps with the onset of the Bølling warming, but the ice sheet surface must have already dropped considerably, as it had earlier covered the summit areas of the Porcupine Hills. Our results indicate that the detachment of the south-flowing Cordilleran and Laurentide ice from the local ice masses emanating from the Rocky Mountains occurred at least 1 ka later than previously reported. However, the lack of a latitudinal trend in the obtained ages is consistent with the rapid opening of an IFC reconstructed in the ice margin chronology of Dyke et al. (Reference Dyke, Moore and Robertson2003). A later separation of the LIS ice margin from the mountain front implies higher ice margin–retreat rates on the Interior Plains in order to meet the Younger Dryas ice margin position near the boundary of the Canadian Shield. To trace the separation of the Laurentide and Cordilleran ice masses farther north and to better constrain the timing of the final opening of the IFC as a passable route from north to south or vice versa, more data are needed from the region that was located directly underneath the CIS–LIS ice saddle during the LGM and the early late glacial.
SUPPLEMENTARY MATERIAL
The supplementary material for this article can be found at https://doi.org/10.1017/qua.2019.10.
ACKNOWLEDGMENTS
MM was supported by International Postdoctoral Fellowship no. 637-2014-483 from the Swedish Research Council. DF and JCG acknowledge funding from Natural Science and Engineering Research Council Discovery grants, and DF acknowledges funding from the Canada Research Chairs program. We thank Fred Phillips for providing data for the published 36Cl ages and Richard Jones for discussing the effects of GIA on our samples. We are grateful for the mineral separation and BeO target chemistry by G. Yang and J. McKenna at Dalhousie University. This work was performed in part under the auspices of the U.S. Department of Energy by Lawrence Livermore National Laboratory under Contract DE-AC52- 07NA27344. This is LLNL-JRNL-735369. We thank the associate editor Tom Lowell and two anonymous reviewers for their insightful comments, which helped us to improve the article.


