INTRODUCTION
Plant parasitism is a plant trophic strategy that has evolved at least a dozen times in multiple phylogenetic lineages, and although parasitic taxa constitute at most 1% of the global flora, they are widely distributed across terrestrial ecosystems (Westwood et al. Reference Westwood, Yoder, Timko and dePamphilis2010). Parasitic plants have traditionally been divided by two criteria: facultative versus obligate with regard to the necessity of a direct connection to a host, and holoparasitic (those lacking photosynthetic capability) versus hemiparasitic (taxa that can fix their own CO2) with regard to carbon (C) status. However, there is increasing awareness that these categorical distinctions do not adequately portray the complexity of a trophic strategy that is in fact mixotrophic (neither completely heterotrophic nor autotrophic). In particular, recent reviews, empirical evidence, and theoretical advances now suggest that many plants (and indeed, other eukaryotes) described as “hemiparasites” are mixotrophic, e.g., plants that simultaneously fix CO2 and acquire fixed C from hosts—which include both plants and fungi (Selosse and Roy Reference Selosse and Roy2009; Selosse et al. Reference Selosse, Charpin and Not2017). These advances aside, several observations remain clear regarding parasitic plants. First, while parasitic plant taxa are best known and most widely studied because of their major economic impacts in agronomic systems, they have a very wide range of hosts, life history strategies, and impacts on ecosystem structure and function. Hemiparasitic plants in particular have impacts on biogeochemical cycling, plant demography and diversity that are disproportionately large relative to their abundance and biomass (Stewart and Press Reference Stewart and Press1990; Quested et al. Reference Quested, Cornelissen, Press, Callaghan, Aerts, Trosien, Riemann, Gwynn-Jones, Kondratchuk and Jonasson2003; Press and Phoenix Reference Press and Phoenix2005; Bell and Adams Reference Bell and Adams2011), but many of the general patterns have emerged from studies of crop pests and Eurasian taxa, especially Orobanche spp. (L.), Striga spp. (Lour.), and Rhinanthus minor (L.). Such studies have identified compounds—including fixed C—that hemiparasitic plants derive from their hosts, established mechanisms for their impacts on plant demography and diversity, and quantified rates of hemiparasitic plants’ physiological processes as a function of host identity (Pennings and Callaway Reference Pennings and Callaway2002; Press and Phoenix Reference Press and Phoenix2005). In light of the refined view of hemiparasitic plants as mixotrophs that closely modulate their heterotrophic-autotrophic balance, there is a clear need for experimental approaches that place hemiparasite physiology in an ecological context (Hattenschwiler and Korner Reference Hattenschwiler and Korner1997; Těšitel et al. Reference Těšitel, Placvová and Cameron2010). In particular, creative combinations of experimental treatments and elemental/isotopic analyses in field settings can reveal material transfers between hosts and parasites, and provide ecological context for the physiological dynamics that underlie them.
Root hemiparasites, including forest-dwelling annuals such as Melampyrum sylvaticum L., generally obtain xylem water and mineral nutrients through their haustoria, which penetrate into host root steles (Seel and Press Reference Seel and Press1993). Root hemiparasites may obtain fixed C from their hosts, but are capable of photosynthesis at rates that usually increase upon attachment to a host due to increased water supply via host roots (Seel and Press Reference Seel and Press1994; Press et al. Reference Press, Shah, Tuohy and Stewart1987). Research with several subarctic hemiparasitic taxa in Eurasia has demonstrated that interspecific variation in host (legume versus grass) tissue chemistry and water use influences hemiparasite physiology (Seel and Press Reference Seel and Press1993, Reference Seel and Press1994; Seel et al. Reference Seel, Cooper and Press1993). This poses the question of whether disturbance-induced changes in the tissue chemistry and water relations of potential host trees can influence hemiparasite physiology in temperate forests.
Melampyrum lineare Desr. (Orobanchaceae) is a facultative, root hemiparasitic annual widely distributed across North America, where it forms haustorial connections with many different host species (Cantlon et al. Reference Cantlon, Curtis and Malcolm1963; Bennet and Matthews Reference Bennet and Matthews2006). M. lineare is myrmecochorous, leading to nonrandom seed dispersal along travel routes favored by ants, who collect and discard the seeds after extracting their nourishing elaiasomes (Gibson Reference Gibson1993). Following germination, preparasitic M. lineare seedlings infect nearby host roots with their haustoria. The full suite of compounds obtained through haustoria is not known for M. lineare, but includes water and phosphorous (Cantlon et al. Reference Cantlon, Curtis and Malcolm1963). Based on work with Eurasian Melampyrum spp. and other taxa in the Orobanchaceae, it is probable that M. lineare also acquires nitrogen (N), and possibly carbohydrates through its hemiparasitic habit (Gauslaa Reference Gauslaa1990; Lechowski Reference Lechowski1996; Hattenschwiler and Korner Reference Hattenschwiler and Korner1997; Tesitel et al. Reference Těšitel, Tesitelova, Fisher, Leps and Cameron2015). In the Great Lakes region of North America, M. lineare is an abundant species in forests dominated by Populus spp., Pinus spp., and Quercus spp., all of which can act as hosts (Cantlon et al. Reference Cantlon, Curtis and Malcolm1963). In maturing forests throughout the region, age-related mortality of clonal, early-successional Populus spp. is allowing replacement by longer-lived taxa and changing the biogeochemical cycling of C and N (Gough et al. Reference Gough, Vogel, Harrold, George and Curtis2007, Reference Gough, Vogel, Hardiman and Curtis2010, Reference Gough, Hardiman, Nave, Bohrer, Maurer, Vogel, Nadelhoffer and Curtis2013; Nave et al. Reference Nave, Gough, Maurer, Bohrer, Hardiman, Le Moine, Muñoz, Nadelhoffer, Sparks, Strahm, Vogel and Curtis2011, Reference Nave, Nadelhoffer, Le Moine, van Diepen, Cooch and van Dyke2013, Reference Nave, Sparks, Le Moine, Hardiman, Nadelhoffer, Tallant, Vogel, Strahm and Curtis2014). With ecological succession and its biogeochemical impact as context, we took advantage of an experimental treatment to accelerate the dieback of canopy-dominant Populus spp., using this as an opportunity to investigate the effects of plot-level changes in biogeochemistry and potential host condition on M. lineare physiology. Based on biogeochemical changes detailed in the references above, including greatly accelerated fine root turnover, increased soil NH4 + and NO3 − availability, decreased ectomycorrhizal N uptake and transfer to ectomycorrhizal host trees (dominantly Populus spp.), elevated δ15N in foliage of all tree species, and increased N concentrations in the foliage of non-girdled trees, we hypothesized that the herbaceous annual M. lineare would act as a short-term sink for elevated soil N, producing foliage with higher N concentrations and thus achieving greater photosynthetic rates if N was the most limiting factor. Upon completing the initial study and finding statistically significantly lower photosynthesis rates and higher foliar C concentrations in M. lineare in the girdled plot (but no statistically significant differences in any of the typical hydraulic or %N drivers of leaf-level photosynthesis), we saw an opportunity to use measurements of M. lineare foliar Δ14C in a post hoc analysis. Based on literature showing that the movement of photosynthetic end products (fixed C) from hosts into hemiparasite foliage can cause photosynthetic downregulation (Goldschmidt and Huber Reference Goldschmidt and Huber1992; Paul and Foyer Reference Paul and Foyer2001), we realized that 14C signatures might reveal whether an influx of isotopically old, host-derived C accompanied the decreased photosynthetic rates of this annual plant within the girdled plot. In addition to being widely applied to “date” environmental samples from centuries or millennia past, based upon radioactive decay, 14C can also be used to constrain the ages of C in modern samples. This application is possible due to what is essentially a nonintentional, global tracer study: specifically, atmospheric nuclear weapons testing beginning in the 1950s, which enriched the global atmosphere in 14CO2, ending with an atmospheric nuclear test ban treaty in 1963. As the 14C content of the atmosphere has declined following this “bomb pulse” during subsequent decades, due to uptake of atmospheric CO2 by the biosphere, C sources from multiple (even subsequent) years can be recognized according to their distinct 14C signatures (Hua and Barbetti Reference Hua and Barbetti2004). This paper is therefore an example of how radiocarbon (14C) provides additional information, which although not conclusive, can be interpreted in the context of relevant literature, physiology and tissue chemistry data to investigate plant hemiparasitism in an experimental field setting.
METHODS
Study Site
We conducted this study at the University of Michigan Biological Station (UMBS) in northern Lower Michigan, USA (45º35.5′N 84º43′W), which has a temperate continental climate with a strong Great Lakes influence (MAT=5.5°C, MAP=817 mm including 294 cm snowfall). The study site is on a 10,500-yr-old glacial outwash plain where soils are excessively well drained, weakly developed Spodosols. These coarse-textured soils (>95% sand) have acidic pH, low organic matter and N availability (Nave et al. Reference Nave, Gough, Maurer, Bohrer, Hardiman, Le Moine, Muñoz, Nadelhoffer, Sparks, Strahm, Vogel and Curtis2011). The second-growth forestland occupying the site is ~95 yr old, has a stem density of 700–800 mature trees per hectare, and a leaf area index (LAI) of 3–5 m2m–2. The dominant tree species at the site, and across most upland forests in the area, is Populus grandidentata Michx., with co-dominant and sub-dominant taxa including Acer rubrum L., Quercus rubra L., Betula papyrifera Marsh., and Pinus strobus L. The understory is dominated by A. rubrum, Q. rubra, P. strobus, and Amelanchier spp., while Pteridium aquilinum L. and Vaccinium angustifolium Aiton are the most abundant ground taxa. Forest composition and disturbance history are similar to many upland forests throughout the upper Great Lakes region, where Populus-dominated mixed deciduous/conifer forests replaced old-growth Pinus-Tsuga forests following clearcutting and wildfires in the late 19th and early 20th centuries (Gough et al. Reference Gough, Vogel, Harrold, George and Curtis2007).
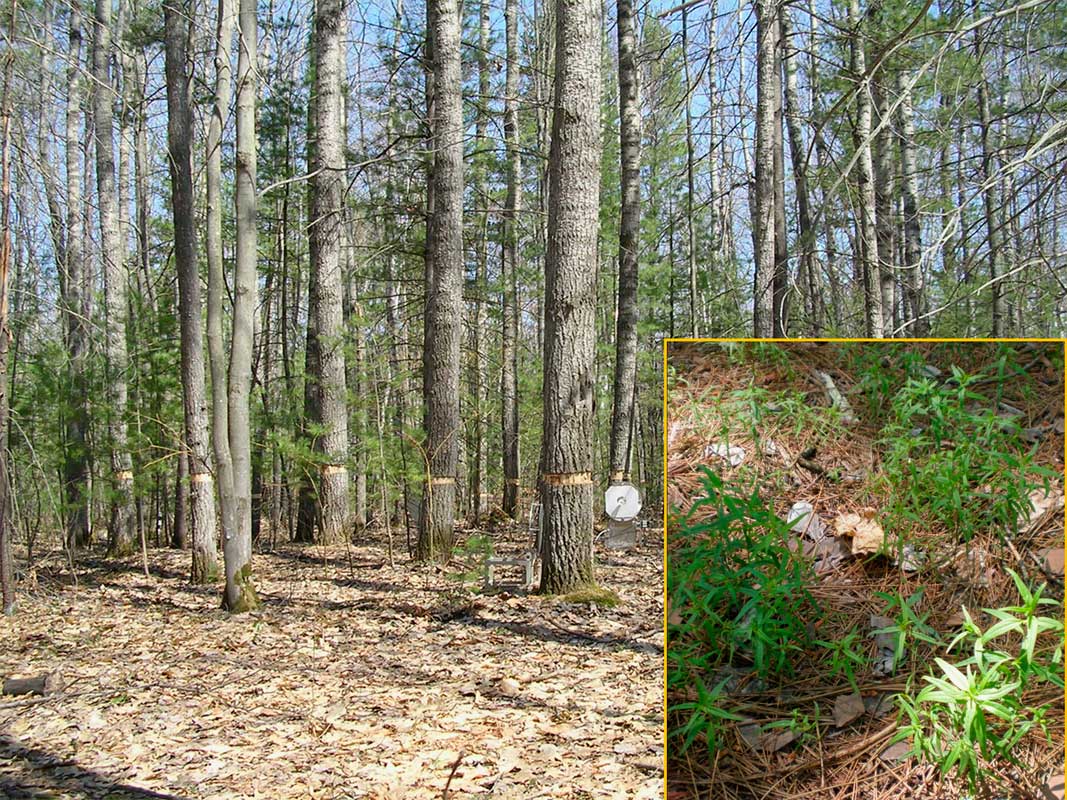
We performed sampling for this study in two large (1.1 ha), intensively measured permanent plots located 2 km apart in forest stands of similar soil type, fertility, aboveground biomass, and species composition (see Nave et al. Reference Nave, Nadelhoffer, Le Moine, van Diepen, Cooch and van Dyke2013 for plot-level information). One plot is situated within a 30-ha area in which all Populus spp. and B. papyrifera stems (collectively, ~35% of canopy trees) were girdled in April–May of 2008 as part of the Forest Accelerated Succession ExperimenT (FASET; Figure 1). In these plots, B. papyrifera represents <5% of the girdled trees; it is more abundant in other areas of the control and experimental footprints and like Populus spp. was girdled because it is a short-lived, early-successional species in the midst of age-related mortality. FASET tracks changes in ecosystem function as this widespread forest type transitions from dominance by early to later successional tree taxa; vegetation characteristics, including pretreatment similarity and biogeochemical changes occurring in response to the manipulation at the time of this study are described in Gough et al. (Reference Gough, Vogel, Hardiman and Curtis2010, Reference Gough, Hardiman, Nave, Bohrer, Maurer, Vogel, Nadelhoffer and Curtis2013) and Nave et al. (Reference Nave, Gough, Maurer, Bohrer, Hardiman, Le Moine, Muñoz, Nadelhoffer, Sparks, Strahm, Vogel and Curtis2011, Reference Nave, Nadelhoffer, Le Moine, van Diepen, Cooch and van Dyke2013, Reference Nave, Sparks, Le Moine, Hardiman, Nadelhoffer, Tallant, Vogel, Strahm and Curtis2014). In this study, we utilized the FASET treatment and the two large intensive plots as an opportunity to compare physiological processes, C and N concentrations and isotope signatures of hemiparasitic plants in undisturbed (control) and stressed tree (stem girdled potential hosts) conditions. Importantly, because of this design, this study cannot address wider implications of disturbance impacts on dominant trees nor hemiparasitic plant physiology; rather it sets intensive data collection in the context of an experiment where knowledge of ecosystem processes informs our data interpretation and inferences.

Figure 1 Photograph from the intensively sampled plot (1.1 ha) within the center of the 32-ha treatment area in which all Populus and Betula spp. were stem-girdled to accelerate their ongoing mortality and accelerate succession to dominance by longer-lived tree taxa. Inset: a cluster of M. lineare individuals within the treatment plot.
Selection of Hemiparasitic Plants for Sampling
We randomly established 24 sampling locations within each plot, and at each location we located and flagged the 3 nearest M. lineare plants (=72 total plants per plot). Plant selection was random with regard to size, except in infrequent cases when leaves were less than 2 cm in length, making them too small to reach across the length of a standard 2×3 cm leaf gas exchange cuvette. In such cases, we located the next-closest plant with sufficiently large leaves.
Hemiparasite Leaf-Level Physiology
To quantify leaf-level physiological processes of the hemiparasite, we conducted measurements of the maximum light-saturated photosynthetic rate, stomatal conductance, and transpiration on a random subset (18) of the 72 M. lineare plants in each plot using a LI-COR 6400 Portable Photosynthesis System (LI-COR, Lincoln, NE, USA). We made these measurements on 7 July 2009, visiting 9 of the plants in each plot during two time blocks (12:00–14:00, 18:00–21:00 GMT). We distributed measurements between these two time periods to control for potential time-of-day effects through a randomized, balanced design blocked by time. On each M. lineare individual, we measured gas exchange parameters of the youngest fully expanded leaf long enough to fit perpendicularly across the 2×3 cm cuvette. After the 30–90-s interval required to obtain stable readings, we removed the leaf from the plant, calculated its area from Vernier caliper measurements, and scaled all gas exchange measurements to the full area of the cuvette. Cuvette conditions were held at 1500 µmol m–2 s–1 photosynthetic photon flux density, 385 µmol mol–1 [CO2], 25°C temperature, and >65% humidity.
Hemiparasite C and N Concentrations and Isotopic Abundances
On 9 July 2009, we harvested the aboveground portions of all 72 M. lineare plants from each plot. We made these collections during a brief time period (17:00–20:00 GMT) to minimize the possibility of diurnal variation in tissue chemistry. At each of the 24 sampling points from which we collected these plants, we pooled the aboveground portions of all 3 individuals into one sample and oven-dried all such samples at 60°C. Next, we removed the leaves from the stems, ground the leaves in a ball mill and weighed them into tin capsules for %C, %N, δ13C, and δ15N analysis on a Costech Analytical CHN analyzer (Costech Analytical, Valencia, CA, USA) coupled to a Finnegan Delta Plus XL isotope ratio mass spectrometer (Thermo Scientific, West Palm Beach, FL, USA) in the UMBS analytical lab. Instrument error as checked by internal standards was 0.1‰ for δ15N and δ13C, 0.1% for %N, and 0.6% for %C (analytical standard deviations). We retained the oven-dried, milled samples in archive for 2 yr before realizing that Δ14C values could be used to indicate whether the bulk C contained in M. lineare foliar tissues differed between control versus treatment plots. In preparation for 14C analysis, samples were graphitized at the Carbon, Water & Soils Research Lab in Houghton, Michigan, by the following process. Samples were dried, weighed into quartz tubes and sealed under vacuum, and then combusted at 900°C for 6 hr with cupric oxide (CuO) and silver (Ag) in sealed quartz test tubes to form CO2 gas. The CO2 was then reduced to graphite through heating at 570°C in the presence of hydrogen (H2) gas and an iron (Fe) catalyst (Vogel et al. Reference Vogel, Southon and Nelson1987). Graphite targets were measured for 14C abundance using a tandem HVEC FN Van De Graaf accelerator at the Center for Accelerator Mass Spectrometry, Lawrence Livermore National Laboratory (Davis et al. Reference Davis, Proctor, Southon, Caffee, Heikkinen, Roberts, Moore, Turteltaub, Nelson, Loyd and Vogel1990) in 2012. Data were normalized to the oxalic acid I 14C standard, followed by a background subtraction determined from 14C-free coal and a δ13C correction to account for isotopic fractionation. Here, we report 14C abundance in units of Δ14C, as defined by Stuiver and Polach (Reference Stuiver and Polach1977):
 $$\Delta ^{{{\rm 14}}} {\rm C}{\equals}\left[ {{{\left[ ^{{{\rm 14}}} {C} \over ^{{{\rm 12}}} {C} \right]_{{sample{\rm }}} {\times}exp^{{\left( {{\raise0.7ex\hbox{${1950{\minus}x}$} \!\mathord{\left/ {\vphantom {{1950{\minus}x} {8267}}}\right.\kern-\nulldelimiterspace}\!\lower0.7ex\hbox{${8267}$}}} \right)}} } \over {0.95{\times}\left[ ^{{{\rm 14}}} {C} \over ^{{{\rm 12}}} {C} \right]_{{OX1}} }}{\minus}1} \right]{\times}{\rm }1000$$
where
 $\left[ ^{{{\rm 14}}} {C} } \over ^{{{\rm 12}}} {C} \right]_{{sample }} $
represents the ratio of 14C to 12C in the sample after δ13C correction to account for isotopic fractionation,
$\left[ ^{{{\rm 14}}} {C} } \over ^{{{\rm 12}}} {C} \right]_{{sample }} $
represents the ratio of 14C to 12C in the sample after δ13C correction to account for isotopic fractionation,
 $\left[ ^{{{\rm 14}}} {C} \over ^{{{\rm 12}}} {C} \right]_{{OX1 }} $
represents the ratio of 14C to 12C in the oxalic acid I standard after δ13C correction to account for isotopic fractionation, and x is the year of 14C abundance measurement. Analytical error on average was ±3 ‰ (absolute).
$\left[ ^{{{\rm 14}}} {C} \over ^{{{\rm 12}}} {C} \right]_{{OX1 }} $
represents the ratio of 14C to 12C in the oxalic acid I standard after δ13C correction to account for isotopic fractionation, and x is the year of 14C abundance measurement. Analytical error on average was ±3 ‰ (absolute).
Bulk Fine Root Nonstructural Carbohydrates
We collected bulk forest floor fine roots to assess the effects of stem girdling (35% of canopy trees) on the fine root network that hosts the generalist hemiparasite M. lineare. We used a 7-cm-diameter corer to obtain a forest floor monolith from beneath each harvested M. lineare plant immediately following M. lineare aboveground biomass collection, and pooled the individual monoliths into composite samples (similar to the aboveground biomass samples). We removed mineral particles from the forest floor samples by rinsing over a 1mm mesh screen, then floated each forest floor sample in water and removed all roots 0.5–2.0 mm in diameter, which were lyophilized and ground with a ball mill. Powdered fine root samples were stored at –80°C until beginning nonstructural carbohydrate analysis following the methods of Curtis (Reference Curtis, Vogel, Wang, Pregitzer, Zak, Lussenhop, Kubiske and Teeri2000), which involved extracting soluble sugars with ethanol, digesting residual starch, and assaying the concentrations of both carbohydrate fractions on a Spectronic Genesys 2 spectrophotometer (Spectronic Analytical Instruments, Leeds, UK). Both carbohydrate pools were converted to a % of fine root dry mass basis for data analysis.
Data Analysis and Interpretation
It is important to be clear that in this case study, statistical analysis of the data we collected comprises only one part our interpretation. In the statistical portion of our analysis and interpretation, we used t-tests to compare means (control versus treatment plot) of response parameters including M. lineare foliar C and N concentrations and isotope signatures, and bulk forest floor fine root carbohydrate concentrations. We tested whether M. lineare leaf gas exchange parameters differed in control versus treatment plots using ANOVA (blocked by time). We conducted these categorical analyses using SPSS (IBM Corp., Armonk, NY, USA), and assessed continuous relationships between M. lineare foliar C concentrations and isotopic signatures using simple linear regression with SigmaPlot (SYSTAT Software, San Jose, CA, USA). For all statistical tests, we chose at the time of initial study design to accept results as significant if P<0.10.
The interpretation of our data is constrained by the experimental and sampling designs of this study, in ways that necessitate caveats here. In the two intensively sampled plots (control and treatment), we sampled M. lineare plants on an individual basis for leaf gas exchange, as co-located triplicate composites for foliar C and N concentrations and isotope signatures, and forest floor fine roots as bulk samples. None of these samples are independent replicates, e.g., as would have been the case had the experimental treatment been imposed on multiple locations across the landscape, and sampling effort allocated among replicated treatment and control units. Furthermore, our statistical analyses assume that the lack of significant differences between control and treatment plots referenced earlier in the Methods section establishes their similarity. Thus, significant differences between control and treatment plots and correlations between parameters within them are constrained in their inferential scope, and in our data interpretation and tentative broader inferences we rely upon parsimonious explanations that draw upon published literature.
RESULTS
In the second growing season following stem girdling of early-successional Populus and Betula trees, which comprised 35% of the canopy, bulk forest floor fine roots had statistically significantly lower soluble sugar (df=41, t=–2.052, P=0.047), and starch (df=41, t=–2.150, P=0.037) concentrations in the girdled plot than the control plot (Table 1).
Table 1 Soluble sugar and starch concentrations of bulk forest floor fine roots from control and treatment (girdled) plots. Data are means ± standard deviations. For each response parameter, asterisks denote the level of statistical significance for the difference between means (**P<0.05).
Concurrently, maximum light-saturated photosynthetic rates for M. lineare were statistically significantly lower among individuals in the girdled plot than in the control plot (Table 2; 5.0 versus 6.2 µmol CO2 m–2 s–1), although none of the typical leaf-level constraints on photosynthesis rates had statistically significant differences between control and treatment plots. Specifically, there were no statistically significant differences in M. lineare transpiration rates, stomatal conductances (Table 3), nor foliar N concentrations (Table 4; df=46, t=.110, P=0.913) in treatment versus control plots.
Table 2 Output for ANOVA statistical significance testing of maximum light-saturated photosynthesis rates for M. lineare individuals in control versus treatment plots, blocked by time of day.
Table 3 Output for ANOVA statistical significance testing of transpiration (3A) and stomatal conductance (3B) rates for M. lineare individuals in control versus treatment plots, blocked by time of day.
Table 4 Foliar C and N concentrations, δ15N, δ13C, and Δ14C of M. lineare from control and treatment plots. Values are means±standard deviations. For each response parameter, asterisks denote the level of statistical significance for the difference between means (**P<0.05; ***P <0.01).
However, M. lineare foliar C concentrations (df=46, t=.892, P=.027), δ15N (df=46, t=8.298, P<.001), and Δ14C (df=46, t=2.080, P=0.043) were statistically significantly higher in the treatment plot (Table 4), where foliar C concentrations were positively correlated with δ15N and Δ14C (Figure 2).
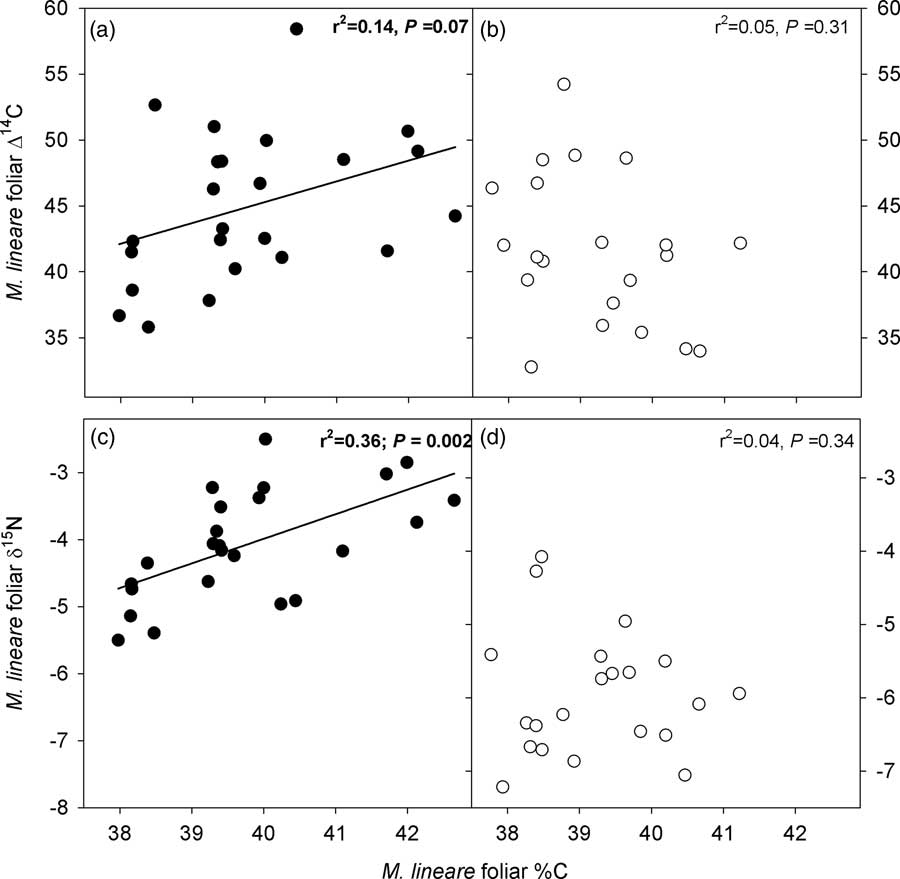
Figure 2 Relationships between C concentrations, δ15N and Δ14C in M. lineare foliage. Panels with filled symbols (a, c) present data for M. lineare foliage from the treatment plot; panels with open symbols (b, d) present data for M. lineare foliage from the control plot. Best-fit lines, r 2 and P values are from regressions for M. lineare foliage from the treatment plot (control plot M. lineare regressions were not statistically significant).
DISCUSSION
The lower photosynthetic rates of M. lineare individuals in the plot where 35% of the canopy trees were girdled was contrary to our initial hypothesis, and not related to any of the typical factors that regulate leaf-level photosynthesis, i.e., stomatal, hydraulic or N-limitation (Reich et al. Reference Reich, Walters and Ellsworth1997; Sparks and Ehleringer Reference Sparks and Ehleringer1997). However, in the context of M. lineare’s statistically significantly higher foliar C concentrations in the girdled plot, lower photosynthetic rates are consistent with sink-induced photosynthetic downregulation, driven by accumulation of photosynthetic end products such as soluble carbohydrates (Goldschmidt and Huber Reference Goldschmidt and Huber1992; Paul and Foyer Reference Paul and Foyer2001). This interpretation is supported by literature on plant mixotrophy, which demonstrates that a range of other hemiparasitic plants regulate photosynthesis according to C supply by hosts (Těšitel et al. Reference Těšitel, Placvová and Cameron2010; Selosse et al. Reference Selosse, Charpin and Not2017). This interpretation would be stronger if we had been able to analyze M. lineare foliar tissues for their nonstructural carbohydrate concentrations rather than relying on the rather coarse difference indicated by total C concentrations. Nonetheless, given that nonstructural carbohydrate concentrations are typically in the range of 8–15% of dry mass for herbaceous plants (Below 1993; Fisher et al. Reference Fisher, Mayland and Burns1999; Mumera and Wyka Reference Wyka1999; Barbehenn et al. Reference Barbehenn, Chen, Karowe and Spickard2004), variation in this range could easily account for the statistically significant 1.1% difference in mean total C concentration in the leaves of M. lineare between control and treatment plots.
Stem girdling induced major changes to the carbon balance of the tree root network in the treatment plot, and these changes offer context for our interpretation of C concentration and isotope data in M. lineare foliage. Because girdled trees comprised 35% of the stems and leaf area in both plots (control and treatment, at least before stem girdling), the lower sugar and starch concentrations in bulk forest floor fine roots in the treatment plot likely reflect the physical disruption of belowground photosynthate allocation by that share of the canopy. As reported in Nave et al. (Reference Nave, Gough, Maurer, Bohrer, Hardiman, Le Moine, Muñoz, Nadelhoffer, Sparks, Strahm, Vogel and Curtis2011), this disruption corresponded to a 38% decline in total nonstructural carbohydrate content (starch + sugar) in bulk fine roots from the treatment relative to the control plot. Taking a more detailed look for the present study, the reduction in root starch concentration (4.1 versus 7.3% of dry mass, a 44% relative decline) was larger than the relative reduction in soluble sugar (1.4 versus 1.8% of dry mass, a 22% relative decline). This is consistent with what is known of carbohydrate mobilization and metabolism in Populus, which involves breakdown of starch reserves to maintain a pool of soluble sugars that is then transported throughout the root network to sustain metabolic requirements (Ländhausser and Lieffers Reference Ländhausser and Lieffers2012; Regier et al. Reference Regier, Streb, Zeeman and Frey2010). The large decrease in root starch concentrations in the stem-girdled plot indicate that this mobilization process was ongoing and had depleted almost half of stored reserves at the time of sampling, one year following treatment, while the smaller but still statistically significant decrease in soluble sugars indicates that even sugars were being consumed by sinks faster than they could be mobilized from starch reserves. Most likely, metabolic sinks for root sugars were dominated by root processes, including cellular respiration, tissue turnover, and nitrogen uptake (Rothstein et al. Reference Rothstein, Zak, Pregitzer and Curtis2000; Gough et al. Reference Gough, Flower, Vogel, Dragoni and Curtis2009; Nave et al. Reference Nave, Gough, Maurer, Bohrer, Hardiman, Le Moine, Muñoz, Nadelhoffer, Sparks, Strahm, Vogel and Curtis2011), but parasitic C drain by mixotrophic M. lineare may exacerbate this carbohydrate deficit. Because nonstructural carbohydrates in temperate tree taxa are mostly in the range of 1–10 yr old (Richardson et al. Reference Richardson, Carbone, Keenan, Czimczik, Hollinger, Murakami, Schaberg and Xu2013, and reviewed therein) and atmospheric Δ14C is still decreasing annually, host-derived C taken up by M. lineare would logically produce a distinct signal in the Δ14C signature of the mixotroph. Because we did not investigate whether M. lineare roots were directly attached to the roots of girdled trees, indirect evidence provided by 14C becomes all the more important as an inferential tool.
The statistically significant difference in Δ14C between M. lineare foliage from treatment versus control plots, and the positive correlation between foliar %C and Δ14C in M. lineare in the treatment plot support the inference that stored carbohydrates being remobilized within the roots of girdled host trees were a detectable source of C to M. lineare. This stored C that was transferred to M. lineare possesses higher 14C values, reflecting the elevated Δ14C of atmospheric CO2 fixed in previous years (Hua and Barbetti Reference Hua and Barbetti2004; Hua et al. Reference Hua, Barbetti and Rakowski2013). Because atmospheric 14C has been declining since the mid-1960s, photosynthates fixed in previous years contain more 14C (i.e. have a larger Δ14C value) than more recently fixed photosynthates, with annual declines of 2–5‰ in the years since 2005. In this case, the 3.3‰ enrichment of M. lineare leaf C in the treatment plot relative to the control plot suggests that the hemiparasitic annual contained C that was, in bulk, approximately a year older than the C contained in the leaves of control plot M. lineare. Given that the nonstructural carbohydrate pool is only a fraction of the total C content of foliar tissues, it is possible that stored C moving from host roots into M. lineare leaf tissues was older than the one-year age separation indicated by bulk leaf tissues. Regardless of its age, an influx of stored host C into M. lineare and concurrent down-regulation of photosynthesis are congruent with observations of other taxa from natural and agricultural ecosystems. Namely, photosynthesis, growth and the internal C sink strength of hemiparasitic plants are responsive to C supply by host roots (Fer et al. Reference Fer, Simier, Arnaud, Rey and Renaudin1993; Salonen et al. Reference Salonen, Setala and Puustinen2000; Těšitel et al. Reference Těšitel, Placvová and Cameron2010, Reference Těšitel, Tesitelova, Fisher, Leps and Cameron2015; Wickett et al. Reference Wickett, Honaas, Wafula, Das, Huang, Wu, Landherr, Timko, Yoder, Westwood and dePamphilis2011; Selosse et al. Reference Selosse, Charpin and Not2017).
The statistically significant differences in treatment versus control plot M. lineare %C, Δ14C and δ15N, and the correlations between %C, Δ14C, and δ15N in the treatment plot are best interpreted in the context of the experimental disturbance and its impacts on forest biogeochemistry. At the time of this experiment, normal functioning of the tree root network in the control plot was maintained by belowground allocation of current photosynthate. But, after stem girdling decreased belowground C allocation in the treatment plot, initiating metabolic demand for stored carbohydrates within the root network of potential host trees, M. lineare was in a position to act as a passive sink for soluble C. In this context, the positive relationship between M. lineare foliar C concentration and δ15N in the treatment plot has at least two possible interpretations, which are not mutually exclusive. First, it is possible that stored N pools with relatively higher δ15N (e.g., proteins and amino acids) were being remobilized along with stored carbon in the roots of girdled hosts, and that M. lineare was receiving some of its N from these sources (Hobbie and Hogberg Reference Hobbie and Hogberg2012). The second potential explanation pertains to fractionating N losses. Soil biogeochemical N transformations that discriminate against 15N, such as nitrification and denitrification, produce products that are isotopically depleted and readily exported from soil in soluble or gaseous forms, respectively (Högberg Reference Högberg1990; Craine et al. Reference Craine, Brookshire, Cramer, Hasselquist, Koba, Marin-Spiotta and Wang2015a). As a result, the δ15N of residual reactant pools becomes increasingly higher as these fractionating losses proceed, and organisms that obtain N from these residual reactant pools exhibit higher δ15N. This process and the patterns that provide evidence for it have been widely reported in the literature, including our study site (Nave et al. Reference Nave, Gough, Maurer, Bohrer, Hardiman, Le Moine, Muñoz, Nadelhoffer, Sparks, Strahm, Vogel and Curtis2011, Reference Nave, Sparks, Le Moine, Hardiman, Nadelhoffer, Tallant, Vogel, Strahm and Curtis2014), and synthesized globally (Craine et al. Reference Craine, Elmore, Wang, Augusto, Baisden, Brookshire, Cramer, Hasselquist, Hobbie, Kahmen, Koba, Kranabetter, Mack, Marin-Spiotta, Mayor, McLauchlan, Michelsen, Nardoto, Oliveira, Perakis, Peri, Quesada, Richter, Schipper, Stevenson, Turner, Viani, Wanek and Zeller2015b). In our study, decreased belowground C allocation increased rates of NO3 − leaching and gaseous efflux (N2O) during this experiment, leading to higher δ15N values in the foliage of all canopy tree species. In this context, M. lineare in the treatment plot was probably also sampling isotopically enriched soil N, regardless of its host identity or attachment.
This study represents a novel intersection between field experimentation and 14C analysis, which afforded the opportunity to investigate physiology and C relations in potential host and mixotrophic plants. Often, the expense of 14C analysis severely constrains researchers’ ability to measure enough samples to test for continuous relationships (e.g., correlations) between 14C and other parameters. However, the opportunity presented here highlights both the differences and similarities between our approach and others that have used 14C to identify C sources and movements in plants, soils and ecosystems. First, the high precision of sample preparation and the sensitivity of the bomb curve method for constraining C sources allowed us to detect a very small change in M. lineare Δ14C as a statistically significant difference between large treatment and control plots. This statistical significance in turn provided inference into the impact of disturbance and host stress on the physiology of a mixotrophic plant within a single intensively studied plot. Second, while deliberately enriched 14C tracers have long been used to trace C movement within plant tissues (Calvin Reference Calvin1948; Gordon and Larson Reference Gordon and Larson1966; Hansen and Beck Reference Hansen and Beck1994), these have typically been limited to young, small-stature plants under controlled conditions. In this study, we used the globally distributed bomb pulse as an isotopic tracer to connect changes in the condition of mature forest trees with the physiology of co-occurring mixotrophs, while relying on non-isotopic data and literature to support our inferences. Third, isotopically enriched (Swanston et al. Reference Swanston, Torn, Hanson, Southon, Garten, Hanlon and Ganio2003; Treseder et al. Reference Treseder, Torn and Masiello2006) or depleted (e.g., Leavitt et al. Reference Leavitt, Paul, Kimball, Hendrey, Mauney, Rauschkolb, Rogers, Lewin, Nagy, Pinter and Johnson1994) 14C tracers have occasionally been used as serendipitous opportunities to identify pathways of C movement in soils and ecosystems. It is in the context of these creative uses of 14C that ours shows the potential for spatially intensive data collection and the bomb-curve approach to study relationships between disturbances, tree stress, and the physiology of mixotrophic herbaceous plants.
CONCLUSION
We used a large field experiment to study physiology and C acquisition in the generalist hemiparasite M. lineare. By interrupting belowground C allocation in the dominant canopy tree species (P. grandidentata; 35% the canopy), experimental stem girdling induced stored carbohydrate mobilization within the fine root network of clonal P. grandidentata. In the plot where the experimental treatment was performed, M. lineare had statistically significantly lower photosynthesis rates, but higher foliar C concentrations, Δ14C and δ15N than in the control plot, where no trees were girdled. Based on these results and support from literature on plant mixotrophy, we suggest that photosynthetic downregulation (not previously documented in this species) occurred in M. lineare due to an input of soluble, stored C from the root networks of stressed P. grandidentata. If this photosynthetic downregulation does operate in M. lineare, it is likely to occur only when hosts are stressed and their physiological function is impaired.
ACKNOWLEDGMENTS
The USDA-Forest Service, Northern Research Station (Agreement No. 13-CR11242306-077), the International Soil Carbon Network, and the Radiocarbon Collaborative made this work possible, and feedback from two anonymous reviewers and an associate editor improved it. The authors also acknowledge support from the National Science Foundation (Award Nos. DEB-0947329 and DGE-0504552) and the U.S. Department of Energy’s Office of Science (BER) through the Midwestern Regional Center of the National Institute for Climatic Change Research at Michigan Technological University (award DE‐FC02‐06ER64158). We are grateful to Kellen Calinger, Jasmine Crumsey, Peter Curtis, Chris Gough, Mike Grant, James Greenebaum, Brady Hardiman, Dave Karowe, Jim Le Moine, Jennifer Nietz, Karena Schmidt, Chris Swanston, Kat Williams, and Chris Vogel for assistance in the field and laboratory.
Supplementary materials
To view supplementary material for this article, please visit https://doi.org/10.1017/RDC.2017.97