


1. Introduction
Cavitation inception typically occurs when the local pressure in a liquid drops below the vapour pressure, causing explosive growth and collapse of bubbles in microsecond time scales. This condition is characterized using the cavitation index,  $\sigma =(P_{in}-P_{v})/0.5\rho V_{in}^2$, where
  $P_{in}$,
  $P_v$,
  $\rho$ and
  $V_{in}$ are reference pressure, vapour pressure, water density and a reference speed, respectively (e.g. Arndt Reference Arndt2002; Brennen Reference Brennen2013). Previous laboratory studies involving cavitation attached to surfaces have shown that, just below the inception pressure, the cavitation appears as a thin glossy sheet with either a sharp- or blunt-shaped leading edge, depending on the surface roughness (Arakeri & Acosta Reference Arakeri and Acosta1973; Gates & Acosta Reference Gates and Acosta1979; Katz Reference Katz1984; Gopalan & Katz Reference Gopalan and Katz2000). Parkin & Kermeen (Reference Parkin and Kermeen1953) were the first to report the application of high-speed imaging to observe the inception process on a hemispherical headform. They showed that stationary thin cavitation patches form past the minimum pressure point. Subsequent studies have demonstrated that inception involves intermittent and short-lived attachment of travelling bubble cavitation to the surface near the minimum pressure point (Blake, Wolpert & Geib Reference Blake, Wolpert and Geib1977; Ceccio & Brennen Reference Ceccio and Brennen1991; De Chizelle, Ceccio & Brennen Reference De Chizelle, Ceccio and Brennen1995; Li & Ceccio Reference Li and Ceccio1996; Laberteaux et al. Reference Laberteaux, Ceccio, Mastrocola and Lowrance1998; George, Iyer & Ceccio Reference George, Iyer and Ceccio2000). The important role of boundary layers was discussed first by Arakeri & Acosta (Reference Arakeri and Acosta1973). They and subsequently Gates & Acosta (Reference Gates and Acosta1979) and Katz (Reference Katz1984) showed that laminar boundary layer separation occurs on the hemispherical headforms, and, under such conditions, the onset of cavitation involves entrainment of free-stream nuclei into the relatively quiescent separated region, followed by cavity growth.
These observations raise questions on how stable attached cavitation occurs for cases without laminar separation. However, until recently, technical limitations have prevented quantitative assessment of the interaction between bubbles and the flow in the inner part of boundary layers. It is also unclear why some forms of cavitation, such as travelling bubble cavitation and the associated transient attachment to the surface, are very sensitive to the concentration of free-stream (or surface) nuclei, whereas the onset of sheet cavitation is relatively insensitive (Gates & Acosta Reference Gates and Acosta1979), and sustains itself once it starts.
In their experiments, Parkin & Kermeen (Reference Parkin and Kermeen1953) noticed isolated stationary microbubbles growing on the surface in the vicinity of the attached cavity and then get swept by the free-stream flow after a few milliseconds. They assumed that these bubbles grow by diffusion of non-condensable gas. To model this process, Van Wijngaarden (Reference Van Wijngaarden1967) calculated the time required for a spherical bubble to grow by advective gas diffusion, assuming that this bubble is subjected to the free-stream flow. Most of the subsequent studies have concluded or assumed that gas diffusion is not a significant contributor to the cavitation inception owing to the long time scales involved (Plesset & Prosperetti Reference Plesset and Prosperetti1977; Brennen Reference Brennen2013).
The present combination of high-speed imaging and velocity measurements that resolve the boundary layer in the vicinity of the minimum pressure point on a curved surface addresses the questions raised above. We show that the mechanism sustaining attached cavitation involves upstream migration of numerous microbubbles originating from a previous collapse of attached cavities. In the case where the boundary layer separates, these bubbles are trapped in the low-momentum recirculating flow. In a non-separated flow, the bubbles are driven upstream by the large adverse gradients downstream of the minimum pressure point after being trapped in the low-speed region where the boundary layer is thickened. Hence, in both cases the process becomes insensitive to free-stream nuclei. In cases where the boundary layer remains thin, there is no upstream migration, and the attached cavitation is intermittent and initiated primarily by travelling bubble cavitation. Furthermore, as the microbubbles migrate upstream for a few milliseconds, they grow significantly by gas diffusion in the supersaturated low-pressure region. When they reach a size comparable to that of the low-momentum zone, either they are swept by the external flow or they initiate a new cavitation event. Hence, gas diffusion plays an important role in the process sustaining attached cavitation. The experimental set-up and procedures are summarized in the next section. Results are presented in § 3, followed by conclusions in § 4.
2. Experimental set-up
The experiments have been performed in a small high-speed water tunnel, as described in Gopalan & Katz (Reference Gopalan and Katz2000). The flow is driven by two 15 HP centrifugal pumps located 5 m below the test section to minimize the pump cavitation, and passes through a 1000 litre buffer tank, where free-stream bubbles are removed. The test section dimensions are  $63.5\ \textrm {mm}\times 50.8\ \textrm {mm}\times 350\ \textrm {mm}$ and have windows on all sides. This facility is equipped with pressure transducers and means to control the mean pressure. The bottom window of the test section has been replaced by three different transparent contoured nozzles, all with a maximum height of 30 mm, thus reducing the cross-section by
  $50\,\%$. The geometry of these nozzles, which are shown in figure 1(a), has been designed to mimic the suction side of lifting surfaces, which typically have distinct local pressure minima. The shape of their forward-facing side is defined using fifth-order polynomials with beginning and ending tangent to the horizontal direction, where the curvature also diminishes. The variations in minimum pressure are generated by varying the length of the curved fronts. The corresponding distributions of pressure coefficient along the bottom wall,
  $Cp=(P-P_{in})/0.5\rho V_{in}^2$ , where
  $P_{in}$ and
  $V_{in}$ are the pressure and velocity at the inlet to the test section, respectively, and
  $P$ is the local pressure, are presented in figure 1(b). They have been determined using inviscid simulations of the flow in the resulting two-dimensional (2-D) nozzles using Ansys Fluent.

Figure 1.  $(a)$ The contoured nozzles’ geometry, and
  $(b)$ computed pressure coefficient along their surface.
These simplified simulations have only been used as guidance during the design phase. Model I has the mildest negative pressure peak and adverse pressure gradients around it, and model III has the steepest gradients and lowest pressure peak. As shown by the experimental data, the boundary layers for models I and II remain attached, but the latter already has an inflection point with a thin low-momentum zone under it. In contrast, the boundary layer separates for model III, giving us three distinctly different flow conditions. These models have been machined and polished to establish a smooth surface, allowing the boundary layer to remain laminar, at least until the minimum pressure point, and, as the observations indicate, surface nuclei are not a significant contributor to the onset of cavitation. In all cases, the test conditions focus on the behaviour of cavitation slightly below the inception level of patchy attached cavitation. Consequently, the local pressures or cavitation indices, namely the local values of  $\sigma +Cp$, are similar. Specific information is provided in the next section.
The velocity distribution around the minimum pressure point has been measured using high-resolution 2-D particle image velocimetry (PIV), where the boundary layer thickness is of the order of  $100\ \mathrm {\mu }\textrm {m}$. The images are recorded using a charge-coupled device (CCD) camera with a resolution of
  $6600\times 4400$ pixels (Imperx 29 MP) fitted with a Nikon-Micro 105 mm lens and a Nikon
  $2\times$ teleconverter to achieve a spatial resolution of
  $2.77\ \mathrm {\mu }\textrm {m}\,\textrm {pixel}^{-1}$. The laser sheet illuminating the central plane of the test section is generated by a Quantel EverGreen 200 laser. The flow is seeded with
  $2\ \mathrm {\mu }\textrm {m}$ silver-coated glass spheres. All the velocity measurements are performed at pressures that are substantially higher than the cavitation inception level. The mean velocity is determined using the sum of correlation technique (Meinhart, Wereley & Santiago Reference Meinhart, Wereley and Santiago2000), which determines the displacement from an ensemble-averaged cross-correlation over small interrogation windows with sizes varying between
  $3\times 1$ and
  $6\times 3$ pixels in the horizontal and vertical directions, respectively. As many as 20 000 image pairs are required to obtain converged results for such small areas. There is no overlap between windows. The interrogation windows are specified next to their respective velocity map in figure 2. Silhouette imaging, where the camera faces a 100 W diffused mercury arc lamp, is used for recording the cavitation events. A high-speed camera (Phantom V2640) fitted with a 105 mm lens, a 100 mm extension ring and a
  $2{\times }$ teleconverter is used for acquiring
  $1024\times 512$ pixel images at 44 000 frames per second and a resolution of
  $5.48\ \mathrm {\mu }\textrm {m}\,\textrm {pixel}^{-1}$. Lower-magnification (
 $34\ \mathrm {\mu }\textrm {m}\,\textrm {pixel}^{-1}$) data at the same frame rate and image size are also recorded to obtain broader views.

Figure 2. (a–c) Snapshots of incipient attached cavitation for models I, II and III, respectively, with insets showing  $3{\times }$ magnified sections. (d–f) Corresponding contours of measured mean velocity magnitude.
3. Results
3.1. The mechanism that sustains the attached cavitation
Figure 2 presents characteristic snapshots of early phases of attached cavitation for models I, II and III, when the pressure in the facility is reduced slightly below the level where attached cavitation inception occurs. The corresponding movies showing magnified views of the cavitation are provided as supplementary movies 1–3 available at https://doi.org/10.1017/jfm.2020.646. The respective measured mean velocity maps are presented to the right of each image, with insets highlighting the regions where attached cavitation inception occurs downstream of the minimum pressure point. In each plot, the origin of the coordinate system is located at the estimated point of minimum radius of surface curvature based on the intersection of the light sheet with the surface. Related variables are listed in table 1, including: (i)  $P_{in}$ and
  $V_{in}$, the pressure and velocity, respectively, at the entrance to the test section,which are used as the reference values in the definition of
  $Cp$; (ii)
  $V_{s,max}$, the maximum velocity along a streamline,
  $V_s$, located just outside of the boundary layer; (iii)
  $Cp^B_{min}$, the minimum pressure coefficient calculated using Bernoulli's equation; (iv)
  $Cp^I_{min}$, the estimated pressure coefficient from the inviscid simulations (figure 1b); (v)
  $\sigma$, the cavitation index during the cavitation tests; and (vi)
  $Cp^B_{min}+\sigma$, the cavitation index based on the local pressure. The differences between
  $Cp^B_{min}$ and
  $Cp^I_{min}$ increase from
  $1.9\,\%$ to
  $6\,\%$ and to
  $11.5\,\%$ as the surface radius of curvature decreases, an expected trend owing to the increase in boundary layer thickness. Note also that the cavitation indices near the minimum pressure point, namely
  $Cp^B_{min}+\sigma$, during the imaging tests are negative, as expected. For reasons elucidated in the following sections, the early stages of attached cavitation occur downstream of the minimum pressure point, where the values of the local
  $Cp^{B}+\sigma$ fall in the range 0.1–0.2, and corresponding absolute pressures vary between 3.5 and 6 kPa.
Table 1. The present experimental conditions.

For model I, the cavitation patches are approximately 5 mm long, isolated and form only as travelling bubble cavitation events attach to the surface downstream of the minimum pressure point, consistent with the observations of Ceccio & Brennen (Reference Ceccio and Brennen1991) and De Chizelle et al. (Reference De Chizelle, Ceccio and Brennen1995). These patches remain attached for 2–10 ms before collapsing, becoming fragmented and being swept away. Conversely, the cavitation formed in the other two models is characterized by smaller (1–2 mm) patches that are distributed along the span of the nozzle, with those corresponding to model II being slightly longer than those seen for model III. While each patch still persists for a few milliseconds, new ones form repeatedly, such that the attached cavitation rarely disappears from the field of view once it starts. While the initial patch appears to be generated by occasional travelling bubble cavitation, the subsequent ones do not, raising questions about their origin and the mechanisms sustaining them. The answers can be found by examining the local boundary layer structure and by observations on the processes that initiate the subsequent patches.
A few observations can be made from the mean velocity fields presented in figure 2 and the magnified insets attached to each plot, which focus on the regions of attached cavitation. Having the mildest adverse pressure gradient, the boundary layer for model I remains thin downstream of the minimum pressure point (figure 2d), and the velocity magnitude exceeds  $2.8\ \textrm {m}\,\textrm {s}^{-1}$ as close as
  $10\ \mathrm {\mu }\textrm {m}$ from the surface. Estimating the thickness of the boundary layer in the inset area based on the average height where the velocity reaches
  $95\,\%$ of the maximum value gives
  $\delta _{95}=90\ \mathrm {\mu }\textrm {m}$. In contrast, the adverse pressure gradient for model II (figure 2e) is strong enough to cause local thickening of the boundary layers (
 $\delta _{95}=160\ \mathrm {\mu }\textrm {m}$) and the formation of a
  $60\text {--}80\ \mathrm {\mu }\textrm {m}$ thick, 3.5–4 mm long, low-momentum zone under an inflection point. Yet, the mean velocity there remains positive with magnitude that does not exceed
  $0.3\text {--}0.4\ \textrm {m}\,\textrm {s}^{-1}$, i.e. there is no mean flow separation. Furthermore, examination of approximately 200 samples of particle displacement do not show instantaneous reverse flows. The boundary layer for model III (figure 2f) does separate, causing formation of an approximately
  $80\ \mathrm {\mu }\textrm {m}$ thick recirculating zone with peak reverse velocity of
  $0.6\text {--}0.7\ \textrm {m}\,\textrm {s}^{-1}$. Here,
  $\delta _{95}=200\ \mathrm {\mu }\textrm {m}$ while the separation and reattachment points, estimated based on the location of zero wall-normal velocity gradients close to the surface, are
  $x=0.6$ and
  $2.25\ \textrm {mm}$, respectively. These observations suggest that there is a causal relationship between the occurrence of sustained attached cavitation patches for models II and III and the formation of low-momentum zones near the surface. The following observations elucidate the mechanisms involved.
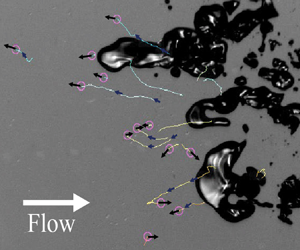
Figure 3(a) is a sample image of attached cavitation for model II, taken from supplementary movie 2. It shows several attached cavitation patches along with more than 20 microbubbles with sizes ranging between 20 and  $50\ \mathrm {\mu }\textrm {m}$ moving upstream towards the minimum pressure line. The bubble tracks over a period of 2.2 ms prior to acquiring this image along with the instantaneous direction of these bubbles are superimposed. The tracking has been performed using the ‘ImageJ Trackmate’ software (Tinevez et al. Reference Tinevez, Perry, Schindelin, Hoopes, Reynolds, Laplantine, Bednarek, Shorte and Eliceiri2017), and verified manually. Supplementary movie 2 shows that the cavitation patches appear intermittently and disappear in a few milliseconds at the downstream end of the low-momentum zone. As they evolve, these patches grow, propagate laterally and split frequently. They disappear either by being fragmented, with the sub-patches getting swept into the free stream, or by collapsing, starting from their downstream end. This collapse appears as an upstream-propagating vapour–liquid front until the patch disappears. Both processes leave a large number of residual microbubbles. Most of them get swept immediately downstream, as seen in multiple prior studies (e.g. Russell et al. Reference Russell, Giosio, Venning, Pearce, Brandner and Ceccio2016). However, as illustrated by the tracks, a small fraction of these microbubbles migrate upstream and laterally, in what appears to be erratic trajectories, within the low-momentum zone of the boundary layer. The typical size of these bubbles is smaller than or comparable to the height of this zone.

Figure 3.  $(a)$ Tracks of microbubbles migrating upstream in the low-momentum region of model II superimposed on a cavitation snapshot.
  $(b)$ A 2.5 ms time series focusing on a bubble track leading attached cavitation inception.
  $(c)$ The red area marked in
  $(b)$ enlarged to show the rapid growth in the final
  $431\ \mathrm {\mu }\textrm {s}$.
The duration of their generally upstream migration varies from 2 to 16 ms at mean velocities that range between 0.5 and  $0.7 \ \textrm {m}\,\textrm {s}^{-1}$ until they either get swept by the free-stream flow or become a nucleation site of a new cavitation patch. The location of the new patch does not appear to be correlated with that of previous events, and often occurs away from other sites with attached cavitation. As a demonstration of a case leading to cavitation inception, figures 3(b) and 3(c) follow the time history of a single bubble, with the first series showing the full trajectory at relatively coarse time steps, and the second focusing on the last
  $431\ \mathrm {\mu }\textrm {s}$, when the new attached patch forms. This microbubble migrates upstream for approximately 2.35 ms at a mean velocity of
  $0.62\ \textrm {m}\,\textrm {s}^{-1}$, i.e. 3.9 % of the maximum velocity, and then grows rapidly, as its size increases from
  $30\ \mathrm {\mu }\textrm {m}$ to approximately
  $300\ \mathrm {\mu }\textrm {m}$ in less than
  $200\ \mathrm {\mu }\textrm {s}$. Hence, the bubble dynamics involves two time scales, with the upstream migration occurring in milliseconds, and the cavitation inception in tens of microseconds. Once the initial attachment of travelling bubble cavitation occurs and generates the first group of microbubbles trapped in the inner part of the (non-separated) boundary layer, the upstream migration, formation of new cavitation patches, followed by their collapse, generation of new microbubbles and so on, sustains the intermittent formation of attached cavitation. As discussed below, the upstream migration of the bubbles against the local slow flow is induced by the adverse pressure gradients in this part of the flow field.
The mechanism sustaining cavitation for model III (supplementary movie 3) appears to be similar to those described above, with some differences that can be largely attributed to the separated flow in the inception area. The attached patches grow to smaller lengths and remain confined to the separated region. They also fragment at a faster rate and are more evenly dispersed along the tangential direction. Moreover, the number of microbubbles seen migrating upstream appears to be about twice as large compared to the non-separated flow, resulting in more frequent inception events of attached cavitation. As elaborated in the next section, which discusses the bubble dynamics, in this case the microbubbles are driven upstream with the reverse flow in the recirculation region.
3.2. Microbubble dynamics
Figure 4(a–f) depicts the results of statistical analysis performed based on 915 bubble tracks for model II (figure 4a,c,e) and 700 tracks for model III (figure 4b,d,f), each providing multiple data points. Joint probability distributions of normalized bubble velocity components and streamwise location are presented in figures 4(a,b) and 4(c,d) for the streamwise ( $V_{bx}/V_{s,max}$) and lateral (
 $V_{bz}/V_{s,max}$) components, respectively. The corresponding locations of the thickened boundary layers are also provided. Matching probability density functions (p.d.f.s) of the normalized velocity magnitude,
  $\tilde {V}=V_{b}/V_{s,max}$, are presented in figure 4(e,f). Several trends appear to be similar. First, the lateral velocity components are symmetric, indicating that the lateral motions do not have a preferred direction. Second, the streamwise velocity components decrease as the bubbles migrate upstream towards the minimum pressure point (
 $x=0$), away from their origin where the cavitation collapses. Third, in both cases, the microbubbles are concentrated inside the low-momentum region, hence they are spread over a longer area for model II. Finally, as illustrated by the blue lines (figure 4e,f), both p.d.f.s of velocity magnitude appear to have a Rayleigh distribution, i.e.
  $P(\tilde {V})=(2\tilde {V}/\langle \tilde {V}^2\rangle ) \exp (-\tilde {V}^2/\langle \tilde {V}^2\rangle )$. Such behaviour has been attributed to random horizontal motions of a particle suspended close to dynamic equilibrium in a fluctuating flow of a fluidized bed, i.e. when the mean force balance on it is zero (Ojha et al. Reference Ojha, Lemieux, Dixon, Liu and Durian2004). Hence, the p.d.f.s in figure 4(e,f) suggest that the present microbubbles are nearly in dynamic equilibrium with their surrounding flow field.

Figure 4. (a–d) P.d.f.s of streamwise (a,b) and lateral (c,d) bubble velocities for (a,c) model II and (b,d) model III. (e,f) P.d.f.s of bubble velocity magnitude for (e) model II and (f) model III. (g) The mean bubble velocity during upstream migration plotted versus the diameter. (h) Velocity distribution and (i) corresponding pressure along streamlines located just outside of the boundary layer calculated using Bernoulli's equation.
The measured mean bubble velocities conditioned on upstream motion (that is,  $\langle V_{bx}|_{V_{bx}<0}\rangle /V_{s,max}$) are plotted as a function of their diameter in figure 4(g). While they migrate upstream in both cases, the mechanisms driving them are different, as illustrated by the inset in figure 4(h). For model III, the microbubbles are driven in the same direction as the flow in the recirculating region of the separated boundary layer. In this case, the pressure gradients are nearly zero, as indicated by the streamwise velocity and pressure profiles along a streamline located just outside of the boundary layer shown in figure 4(h,i). The pressure is calculated from the measured velocity using Bernoulli's equation. Hence, the primary likely force driving the bubbles upstream is drag. As expected, the measured values, ranging from
  $-0.028$ to
  $-0.022$, are smaller, but of the same order as the normalized maximum liquid reverse flow within the separated region,
  $-0.033$ to
  $-0.028$. This relationship supports our postulate that the motion of these bubbles is dominated by the drag force. For
  $D>55\ \mathrm {\mu }\textrm {m}$, when the bubble diameter becomes comparable to the separated region height, the upstream velocity decreases sharply, presumably owing to the growing influence of the positive velocity in the outer part of the separated region.
In contrast, near model II, the microbubbles located in the inner part of the boundary layer move against the local flow, where they are subjected to adverse pressure gradients evident from the velocity and pressure distributions (figure 4h,i). Being in near-hydrodynamic equilibrium, as the p.d.f.s suggest, the force induced by the pressure gradients is likely to be balanced by the drag force (neglecting inertia and lift, etc.). Equating these forces (inset in figure 4h) leads to the following estimate for the local relative velocity:  $V_{b,rel}=\sqrt {(4D/3C_D)(-V_s\partial V_s/\partial s)}$. Here,
  $C_D=(24/Re)(1+0.15Re^{0.681})+0.407Re/(Re+8710)$ is the drag coefficient estimated according to Brown & Lawler (Reference Brown and Lawler2003),
  $D$ is the bubble diameter, and
  $Re$ is the bubble Reynolds number estimated based on mean slip velocity. Using the measured value,
  $V_s\partial V_s/\partial s\approx -5.3 \times 10^3\ \textrm {m}\,\textrm {s}^{-2}$, gives
  $V_{b,rel}/V_{s,max} \approx -0.006$ and
  $-0.03$ for
  $D=20$ and
  $60\ \mathrm {\mu }\textrm {m}$, respectively. For
  $D<50\ \mathrm {\mu }\textrm {m}$,
  $\langle V_{bx}|_{V_{bx}<0}\rangle /V_{s,max}$ increases with diameter (figure 4g), but at a slower rate than
  $V_{b,rel}$, with the estimated and measured values agreeing at
  $D \approx 35\ \mathrm {\mu }\textrm {m}$. Note that, owing to very low local flow velocity,
  $V_{b}$ is very close to
  $V_{b,rel}$. The disagreement in trends might be associated in part with the simplified model, the impact of the collapsing cavities, as well as the uncertainty in measuring the microbubble diameter, estimated as
  $5\ \mathrm {\mu }\textrm {m}$ based on the pixel resolution. For
  $D>45\ \mathrm {\mu }\textrm {m}$, the upstream mean velocity decreases presumably since the diameter becomes comparable to the low-momentum thickness, i.e. part of the bubble is influenced by faster downstream flows.
It should be emphasized that the present analysis is based on the mean flow field, without cavitation. The growth and collapse of cavities inherently generate local unsteady flows that are likely to affect the bubble trajectories. In fact, the above-mentioned random motions (figure 4e,f), as well as the broad distributions of velocities, including lateral ones (see figure 4a–d and supplementary movies 2 and 3), are likely to be affected by the intermittent growth and collapse of the cavities. However, on average the bubbles migrate upstream at a low mean velocity, whether they are located near to or away from the collapsing cavities (figure 4g). Hence, the simplified models balancing the effects of pressure gradients and drag for model II, and drag only for model III, seem to be reasonable. The results show that, owing to the very high local acceleration  $(5000\ \textrm {m}\,\textrm {s}^{-2})$ in the region of bubble migration for model II, the microbubbles cannot be treated as passive scalars.
The next discussion examines the impact of non-condensable gas diffusion on the size of the bubbles migrating upstream. Our observations indicate that,over the few milliseconds of migration, these bubbles grow from a typical initial diameter of  $10\text {--}20\ \mathrm {\mu }\textrm {m}$ to
  $40\text {--}50\ \mathrm {\mu }\textrm {m}$. The latter is already comparable to that of the thickness of the low-momentum region of the boundary layer. At this stage they either grow explosively or are swept downstream. Figure 5(a) demonstrate this growth, where a microbubble grows from a diameter of
  $11\ \mathrm {\mu }\textrm {m}$ to
  $38.3\ \mathrm {\mu }\textrm {m}$ in 6 ms, before being swept downstream by the free-stream flow. The measured size for 12 other microbubbles as a function of time is presented in figure 5(b). Initially they all grow at a relatively mild rate for 2–10 ms, and then either grow explosively in tens of microseconds, namely cavitate, or get swept. The relatively slow growth rate that occurs during the above-mentioned long time scale could be caused either by non-condensable gas diffusion or by the change in the local pressure. The latter can be discounted since the bubbles migrate upstream by an average distance of 0.4 mm with peak values of approximately 2 mm. The corresponding changes to the local pressure are 2.1 and 10.6 kPa, respectively. After subtracting the vapour pressure, and accounting for
  $4\tau /D$, where
  $\tau$ is the surface tension, the partial pressure of non-condensable gas in a
  $10\ \mathrm {\mu }\textrm {m}$ diameter bubble changes at most from 34.4 to 24 kPa (2 mm displacement). Assuming isothermal expansion, the bubble radius would increase by 13 %. In contrast, figure 5(a) and several other examples in figure 5(b) shows that the typical diameter increases by 3–4 times. Hence, gas diffusion must be playing a prominent role.

Figure 5.  $(a)$ A time series showing the growth of a microbubble during its 6 ms migration upstream, and
  $(b)$ measured size evolution of 12 sample microbubbles superimposed on the calculated growth by mass diffusion.
Owing to the very low liquid pressure in the cavitation inception area, the fluid becomes locally supersaturated with non-condensable gases. Following Epstein & Plesset (Reference Epstein and Plesset1950), the growth rate of a stationary bubble by mass diffusion is  $\textrm {d}D/\textrm {d}t=\alpha [(D/2)^{-1}+({\rm \pi} \kappa t)^{-0.5}]$, where
  $\alpha =2\kappa \mathfrak {R}T(C_{\infty }-C_s)/(P-P_v+8\tau /3D)$,
  $\kappa$ is the diffusion coefficient of air in water,
  $\mathfrak {R}$ is the gas constant of air,
  $C_{\infty }$ is the dissolved gas concentration far from the bubble (
 $C_{\infty }=18.2\ \textrm {mg}_{air}\,\textrm {l}^{-1}$ in the present experiments) and
  $C_{s}$ is the pressure-dependent saturation concentration. Note that, under the present conditions, the magnitude of the surface tension term, e.g. 20 kPa for a
  $10\ \mathrm {\mu }\textrm {m}$ bubble and 5 kPa for a
  $40\ \mathrm {\mu }\textrm {m}$ bubble, is the largest contributor to the pressure inside the bubble. As the bubble grows, the contribution of this term diminishes. According to Fuller, Schettler & Giddings (Reference Fuller, Schettler and Giddings1966), the diffusion coefficient increases with decreasing pressure according to
  $\kappa /\kappa _0=(P_0/P)(T/T_0)^{1.75}$, where
  $\kappa _0=2 \times 10^{-5}\ \textrm {cm}^{2}\,\textrm {s}^{-1}$ for
  $P_0=101\ \textrm {kPa}$ and
  $T_0=293.2\ \textrm {K}$. While the above relation has been validated only down to an ambient pressure of 35 kPa (Li et al. Reference Li, Chen, Zhou, Wu, Stoyanov and Pelan2014), in the present assessment we extrapolate it to the pressure at the origin of the bubble, 8 kPa. The result,
  $\kappa \approx 2.5 \times 10^{-4}\ \textrm {cm}^{2}\,\textrm {s}^{-1}$, is an order of magnitude higher than that of atmospheric values. Figure 5(b) compares the measured time evolution of bubble diameter for 12 sample microbubbles to that obtained by integrating the Epstein & Plesset (Reference Epstein and Plesset1950) solution using the aforementioned
  $\kappa$,
  $C_{\infty }$ and
  $C_s=1.44\ \textrm {mg}_{air}\,\textrm {l}^{-1}$ at 8 kPa, and the same initial diameter. The trends appear to be quite similar until some of the bubbles begin to grow explosively, once cavitation inception starts. While the model simplifies the processes involved, this comparison and lack of other plausible explanations strongly suggest that bubble growth is caused primarily by non-condensable gas diffusion.
The present observations also provide a plausible explanation for why the attached cavitation inception occurs systematically downstream of the minimum pressure point, and why it does not occur shortly after being generated in the regions where the previous cavities collapse. Starting from the latter, the microbubbles form at the downstream end of the collapsing cavities for models II and III, where the absolute mean liquid pressure varies between 5 and 20 kPa. Owing to the surface tension, the resulting pressure inside a (for example)  $10\ \mathrm {\mu }\textrm {m}$ diameter bubble is 35–50 kPa. In this area, it would be very difficult to satisfy the condition for unstable bubble growth, namely
  $P-P_{v}<-8\tau /3D$. As these bubbles migrate upstream while growing by mass diffusion, their interior pressure decreases owing to both reductions in the absolute local pressure and the magnitude of
  $4\tau /D$, with the latter changing at a faster rate. Yet, the mean liquid pressure in the area where cavitation inception typically occurs remains positive (but very low – see figure 4i). Hence, the condition for unstable bubble growth cannot be satisfied by the mean flow alone. However, it could occur intermittently, owing to local pressure fluctuations induced by the flow or by collapse of a previous attached cavitation event further downstream. With the increase in bubble diameter, the amplitude of fluctuations required for triggering the instability decreases. For sufficient growth by mass diffusion to occur, the bubble has to be located within the low-momentum zone of the boundary layer. Even there, only some of the bubbles initiate attached cavitation while others are swept rapidly downstream by the external flow. These observations imply that the bubbles cannot migrate upstream all the way to the minimum pressure point, where the inner part of the boundary layer is very thin, and the pressure gradient diminishes.
4. Conclusions
In cases where adverse pressure gradients either thicken the boundary layer or cause local flow separation, the inner region of low momentum ‘shelters’ microbubbles from being swept by the main flow. The origin of these trapped microbubbles can be traced back to intermittent attachment and collapse of travelling bubble cavitation events originating from free-stream nuclei. Without flow separation (model II), there is no other mechanism that could drive free-stream microbubbles into the thin low-momentum zone. Being largely laminar, there is very little wall-normal mixing, and adverse pressure gradients are not sufficient to drive the bubble upstream in high-momentum regions above or downstream of the thickened boundary layer. Furthermore, by tracking them to their origin, and the fact that we have not observed patches originating from unidentified sources, surface nuclei do not seem to play a significant role in the present study. When the flow is separated, while prior studies have suggested that free-stream nuclei might be entrained through the reattachment area (Arakeri & Acosta Reference Arakeri and Acosta1973), they do not seem to play a major role in the present study.
In the non-separated boundary layer, the trapped bubbles are driven upstream by the adverse pressure gradients, and, when the flow is separated, the pressure gradients diminish, and the bubbles are driven upstream by drag. Both cases result in slow upstream migration that lasts a few milliseconds. During that time the microbubbles grow by 3–4 times owing to non-condensable gas diffusion until their size becomes comparable to the thickness of the low-momentum region. At this stage, some are swept downstream, but others become nucleation sites for new attached cavitation events. When the new patches collapse, they generate new residual microbubbles, allowing the process to repeat itself independently of free-stream nuclei. In both cases, thickening of the boundary layer is a common key feature that sustains the continuous bubble migration and growth leading to regeneration of attached cavitation. The bubble migration and self-sustaining mechanisms occurring over models II and III do not occur over model I even when the pressure is reduced further. In this case, the adverse pressure gradients are too mild to thicken the boundary layer and create a region where the bubbles can be sheltered. With decreasing adverse pressure gradients, the force driving the bubbles upstream against the mean flow also diminishes. These observations provide a plausible answer to the following longstanding question: Why, and under what conditions, is inception of attached cavitation on curved surfaces or hydrofoils at incidence relatively insensitive to the concentration of free-stream nuclei?
Acknowledgements
This study has been funded in part by the Office of Naval Research (ONR) under grant number N00014–18-1–2635, and in part by the ONR MURI programme entitled ‘Predicting Turbulent Multi-Phase Flows with High-Fidelity: a Physics-Based Approach’. Ki-Han Kim is the Program Officer.
Declaration of interests
The authors report no conflict of interest.
Supplementary movies
Supplementary movies are available at https://doi.org/10.1017/jfm.2020.646.


