


1. Introduction
The study of turbulent ribbed duct flows is of great importance for many engineering applications such as heat exchangers, turbine blade cooling and mixing chambers (Yaglom & Kader Reference Yaglom and Kader1974; Casarsa & Arts Reference Casarsa and Arts2005; Han, Dutta & Ekkad Reference Han, Dutta and Ekkad2012; Borello, Salvagni & Hanjalić Reference Borello, Salvagni and Hanjalić2015). Turbulent flow inside a ribbed duct is three dimensional, characterized by not only the existence of multiple turbulent separations but also the interaction of four boundary layers developed over the four sidewalls. These characteristics greatly complicate the flow physics and make turbulence characteristics drastically different from those of a two-dimensional (2-D) rough-wall boundary-layer flow over a flat plate. These interesting physical features lead to the motivation of this research, which aims to expound the influence of rib geometry on the mechanism of organized secondary flows and their effects on the turbulence structures in a ribbed square duct.
In the current literature, there have been several reported direct numerical simulation (DNS) studies on 2-D riblet flows (Miyake, Tsujimoto & Nakaji Reference Miyake, Tsujimoto and Nakaji2001; Cui, Patel & Lin Reference Cui, Patel and Lin2003; Leonardi et al. Reference Leonardi, Orlandi, Djenidi and Antonia2004; Ikeda & Durbin Reference Ikeda and Durbin2007; Burattini et al. Reference Burattini, Leonardi, Orlandi and Antonia2008; Liu, Ke & Sung Reference Liu, Ke and Sung2008; Chan et al. Reference Chan, MacDonald, Chung, Hutchins and Ooi2015). For example, Burattini et al. (Reference Burattini, Leonardi, Orlandi and Antonia2008) conducted experiments and DNS for studying a fully developed 2-D turbulent channel with transverse ribs mounted on one wall. They showed that the dominant budget terms for turbulent kinetic energy (TKE) are the production and dissipation rates, which peak at a position that is slightly above rib crest. This physical feature has also been observed by Miyake et al. (Reference Miyake, Tsujimoto and Nakaji2001) and Nagano, Hattori & Houra (Reference Nagano, Hattori and Houra2004), who used DNS to study turbulent boundary-layer flow developed over a surface roughened with transverse ribs. Djenidi et al. (Reference Djenidi, Antonia, Amielh and Anselmet2008) performed measurements of a 2-D turbulent boundary-layer flow over transverse rib roughness using particle image velocimetry (PIV) and planar laser-induced fluorescence (PLIF). They showed that the rib elements impose significant disturbances on the turbulence field, resulting in large magnitudes of normal and shear stresses near the ribbed wall. This was later confirmed by the study of Ikeda & Durbin (Reference Ikeda and Durbin2007) and Volino, Schultz & Flack (Reference Volino, Schultz and Flack2009), who investigated 2-D ribbed plane-channel flows using DNS and PIV, respectively.
In addition to 2-D ribbed flows briefly reviewed above, a number of numerical and experimental works have also focused on the effects of secondary flows on the mean velocities and Reynolds stresses in either a smooth or a transverse rib-roughened duct (Yokosawa et al. Reference Yokosawa, Fujita, Hirota and Iwata1989; Gavrilakis Reference Gavrilakis1992; Hirota, Yokosawa & Fujita Reference Hirota, Yokosawa and Fujita1992; Mompean et al. Reference Mompean, Gavrilakis, Machiels and Deville1996; Lohász, Rambaud & Benocci Reference Lohász, Rambaud and Benocci2006; Sewall et al. Reference Sewall, Tafti, Graham and Thole2006; Wang, Hejcik & Sunden Reference Wang, Hejcik and Sunden2007; Coletti et al. Reference Coletti, Maurer, Arts and Di Sante2012, Reference Coletti, Lo Jacono, Cresci and Arts2014; Labbé Reference Labbé2013; Mahmoodi-Jezeh & Wang Reference Mahmoodi-Jezeh and Wang2020). For instance, Brundrett & Baines (Reference Brundrett and Baines1964) performed measurements of a smooth square duct flow using a hot-wire anemometer to investigate the mechanism of secondary flow motions. By analysing the transport equation of the streamwise vorticity, they concluded that the gradients of Reynolds stress in the cross-stream directions played an important role in the generation of secondary flows. Recently, Pirozzoli et al. (Reference Pirozzoli, Modesti, Orlandi and Grasso2018) studied the effects of Reynolds numbers on the secondary flows in a smooth square duct using DNS and observed that the bulk flow properties are less sensitive to the secondary flow motions. By using PIV, Casarsa & Arts (Reference Casarsa and Arts2005) also observed similar secondary flows in the pattern of streamwise-elongated counter-rotating vortex pairs in a transverse rib-roughened duct. Hirota et al. (Reference Hirota, Yokosawa and Fujita1992) performed measurements in a turbulent ribbed duct flow using hot-wire anemometers and observed that secondary flows drastically alter the distributions of TKE in the cross-stream directions. This research finding of Hirota et al. (Reference Hirota, Yokosawa and Fujita1992) was recently confirmed by Mahmoodi-Jezeh & Wang (Reference Mahmoodi-Jezeh and Wang2020), who investigated the effects of rib height on turbulent flow structures in a square duct using DNS. Mahmoodi-Jezeh & Wang (Reference Mahmoodi-Jezeh and Wang2020) compared three straight transverse rib duct flows with a smooth duct flow, and concluded that secondary flows in a ribbed duct generate a high degree of non-equilibrium states in a region between the sidewalls and duct centre. All these previous investigations have indicated that the appearance of the secondary flows in the cross-stream directions represents a major physical feature in a smooth or a ribbed three-dimensional (3-D) duct flow, a mechanism that is absent in a conventional 2-D rough-wall boundary-layer flow over a flat plate.
While there is considerable research dedicated to turbulent flow in a transverse rib-roughened duct, much less is documented on turbulent flow in a duct with inclined ribs. Gao & Sundén (Reference Gao and Sundén2004a) performed measurements of a flow in an angled rib-roughened rectangular duct using PIV and showed that the secondary flow appeared as one large longitudinal vortex in the cross-stream directions. In their follow-up study, Gao & Sundén (Reference Gao and Sundén2004b) conducted PIV measurements in a rectangular duct with surface-mounted V-shaped ribs pointing towards both upstream and downstream directions. They observed that owing to the disturbances from the sharp-angled ribs and the presence of strong secondary flows, the magnitude of the Nusselt number is significantly enhanced on the two vertical sidewalls of the duct. Fang et al. (Reference Fang, Yang, Wang, Tachie and Bergstrom2017) conducted a large-eddy simulation (LES) study of the turbulent flow in rib-roughened ducts with three different rib angles, and showed that the spatial distribution of main flow characteristics (such as the first- and second-order turbulence statistics) in the V-shaped rib case is greatly different from those in the perpendicular rib case. Recently, Ruck & Arbeiter (Reference Ruck and Arbeiter2018) performed a detached eddy simulation to investigate the effects of secondary flows on the statistics of the velocity and temperature fields in V-shaped rib-roughened square ducts. They showed that the mean secondary flows greatly affected the spatial distribution of both friction and pressure drags on the ribbed bottom wall, resulting in an enhanced magnitude of the Nusselt number. Even though the previous studies (Gao & Sundén Reference Gao and Sundén2004a,Reference Gao and Sundénb; Fang et al. Reference Fang, Yang, Wang, Tachie and Bergstrom2017; Ruck & Arbeiter Reference Ruck and Arbeiter2018) have proven the existence of large-scale secondary flows in the cross-stream direction, there is a lack of detailed investigation into the combined effect of ribs and sidewalls on the turbulence structures and Reynolds stress anisotropy. This is because a comprehensive 3-D instantaneous DNS data set is typically needed for a detailed study of these subjects.
Notwithstanding the aforementioned contributions, a DNS study of turbulent flow in a square duct with surface-mounted inclined or V-shaped ribs is still lacking in the current literature, and the effects of rib geometry on rib-roughened wall-bounded turbulence are yet to be discovered. In view of this, we aim at conducting a detailed DNS study of rib-roughened duct flow to investigate the mechanism underlying the organized secondary flows and their effects on turbulent flow and coherent structures in both physical and spectral spaces.
The remainder of this paper is organized as follows. In § 2 the governing equations, numerical algorithms and test cases are described. Also in this section, a detailed study of the minimal computational domain required for accurately capturing turbulent flow structures in a square duct with either inclined or V-shaped ribs mounted on one wall is conducted. In § 3 the influence of both sidewalls and ribs on the statistically averaged quantities are analysed, including the mean flows, the pressure and viscous drag coefficients, Reynolds stresses, as well as the budget balance of TKE. In § 4 the effects of rib geometry on turbulent flow structures are investigated using multiple tools such as vortex identifiers, joint probability density functions (JPDF) of streamwise and vertical velocity fluctuations, two-point auto-correlation functions and premultiplied energy spectra. In § 5 major findings of this research are concluded.
2. Test case and numerical procedure
Figure 1 shows the geometry of the computational domain and body-fitted mesh used in our DNS. The streamwise, vertical and spanwise domain sizes for the current study are set to  $L_x\times L_y\times L_z=64H\times 10H\times 10H$, respectively. Both cross-sections of the duct and ribs are square-shaped, with the side lengths
  $H$ and
  $D$ (
$D$ ( $L_y=L_z=D$), respectively. The distance between the ribs
  $(P)$ in the streamwise direction is
  $8.0H$, and both the height and width of the rib are 10 % of the duct height (i.e.
  $H=0.1D$). This same rib height has also been used in the PIV studies of rib-roughened duct flows of Wang, Salewski & Sundén (Reference Wang, Salewski and Sundén2010), Coletti, Cresci & Arts (Reference Coletti, Cresci and Arts2013) and Fang et al. (Reference Fang, Yang, Wang, Tachie and Bergstrom2015), and in the LES studies of Sewall et al. (Reference Sewall, Tafti, Graham and Thole2006) and Fang et al. (Reference Fang, Yang, Wang, Tachie and Bergstrom2017). Here, the pitch value is set to
  $P=8.0H$ because it has been demonstrated that the strongest turbulence level occurs near the ribbed bottom wall when the pitch-to-height ratio is between
  $P/H=7.0$ and 8.0 (Rau et al. Reference Rau, Cakan, Moeller and Arts1998; Leonardi et al. Reference Leonardi, Orlandi, Djenidi and Antonia2004; Ryu, Choi & Patel Reference Ryu, Choi and Patel2007; Leonardi et al. Reference Leonardi, Orlandi, Djenidi and Antonia2015). Periodic boundary conditions are prescribed for velocity components in the streamwise direction and a no-slip boundary condition is applied to each solid wall. The mass flow rate is kept constant, which offers a fixed-valued bulk Reynolds number (
 $Re_b$) for both rib cases. This is similar to the study of Fang et al. (Reference Fang, Yang, Wang, Tachie and Bergstrom2015) and Coletti et al. (Reference Coletti, Maurer, Arts and Di Sante2012), who conducted an experimental study of rib-roughened duct flows based on a constant bulk Reynolds number
  $Re_b$. The Reynolds number is
  $Re_b=U_bD/\nu =7000$, where
  $U_b$ denotes the bulk mean velocity in the streamwise direction.

Figure 1. Schematic of the 3-D duct with the different rib geometries, coordinates and grid system. (a) Inclined rib case and (b) V-shaped rib case. The side length of the square-shaped rib and duct is  $H$ and
  $D$, respectively. The origin of the absolute coordinate system (i.e.
  $(x, y, z)=(0,0,0)$) is located at the centre of the inlet (
 $y$–
$y$– $z$) plane. Eight rib periods are simulated in this DNS study. To facilitate the analysis of each rib period, the relative streamwise coordinate
  $x'$ is defined, with its origin located at the windward face of each rib.
Table 1 shows the key parameters involved in our comparative study of inclined and V-shaped ribbed duct flow test cases. The Reynolds number based on the rib height is defined as  $H^+=H u_{\tau R}/\nu$. Alternatively, the Reynolds number can be defined based on the mean streamwise wall friction velocities of the smooth top and ribbed bottom walls (i.e.
  $Re_{\tau S}=\delta u_{\tau S}/\nu$ and
  $Re_{\tau R}=\delta u_{\tau R}/\nu$, respectively) in the central vertical (
 $x$–
$x$– $y$) plane located at
  $z/\delta =0.0$. Here,
  $\delta =D/2$ is the half-side length of the square duct, which is defined in an analogy to the usual convention used in the study of a 2-D smooth or ribbed plane-channel flow. For a smooth wall, the friction velocity (
 $u_{\tau S}$) is directly defined as the mean streamwise velocity gradient (i.e.
  $u_{\tau S}=(\nu \partial \langle u\rangle /\partial y)^{1/2}$). However, calculation of the friction velocity on a ribbed wall is complex as it is determined by both viscous and pressure drags as
  $u_{\tau R}=(D_p+D_v)^{1/2}$. This method for calculating
  $u_{\tau R}$ follows the approach of Leonardi & Castro (Reference Leonardi and Castro2010) and Ismail, Zaki & Durbin (Reference Ismail, Zaki and Durbin2018) in their DNS study of 2-D ribbed turbulent channel flows and Mahmoodi-Jezeh & Wang (Reference Mahmoodi-Jezeh and Wang2020) in their DNS study of turbulent flow in a 3-D square duct with transverse ribs mounted on one wall. Here,
  $D_p$ and
  $D_v$ represent the pressure and viscous drag forces in the central (
 $x$–
$x$– $y$) plane, defined as
  $D_p=1/(\rho L_x)\sum _{n=1}^N\int _{0}^{H}(\langle P_{wind}\rangle -\langle P_{lee}\rangle )\,\textrm {d} y$ and
  $D_v=\mu /(\rho L_x)\int _{0}^{L_x}(\partial \langle u\rangle /\partial y)_{w}\,{\textrm {d} x}$, respectively. In these equations, subscript ‘
 $w$’ denotes either the bottom wall or top of the rib elements,
  $N$ is the total number of rib elements,
  $\langle \cdot \rangle$ denotes averaging over time and over the eight rib periods, and
  $P_{wind}$ and
  $P_{lee}$ represent the pressures on the windward and leeward faces of a rib, respectively. The total drag forcing term is
  $D_t=D_p+D_v$ in the central (
 $x$–
$x$– $y$) plane. Given the 3-D nature of the flow, the evaluation of the characteristic values of the mean wall friction velocities (
 $u_{\tau R}$ and
  $u_{\tau S}$) and drag forces (
 $D_p$ and
  $D_v$) are done in the central (
 $x$–
$x$– $y$) plane here, simply because these values vary in the spanwise direction. Different from a conventional 2-D ribbed flow over a flat plate, the 3-D ribbed duct flows studied here are statistically inhomogeneous in all three directions.
Table 1. Key flow parameters of the inclined and V-shaped test cases.

From table 1 it is clear that a significant fraction of the friction velocity on the ribbed bottom wall  $u_{\tau R}$ is contributed by pressure drag
  $D_p$, as the ratio of the friction drag
  $D_v$ to the pressure drag
  $D_p$ is 14.6 % and 4.72 % for the inclined and V-shaped rib cases, respectively. This implies that there exists a significant pressure difference between the windward and leeward faces of the inclined and V-shaped ribs (to be discussed in § 3.2). Furthermore, it is observed that the value of
  $D_t$ in the inclined rib case is one order of magnitude smaller than that in the V-shaped rib case, resulting in a smaller magnitude of the mean friction velocity
  $u_{\tau R}$ on the ribbed bottom wall.
An in-house computer code was developed using FORTRAN 90/95 to solve the governing equations, and message passing interface libraries were used to parallelize the code. In order to simulate the turbulent fluid flow over non-orthogonal ribs within a square duct, the continuity and momentum equations in this computer code are discretized based on a general curvilinear coordinate system  $( {{\xi }_{1}},{{\xi }_{2}},{{\xi }_{3}} )$, which take the following form in the context of an incompressible fluid:
 $$\begin{gather} \frac{1}{J}\frac{\partial ( \beta _{i}^{k} {{{u}_{i}}} )}{\partial {{\xi }_{k}}}=0, \end{gather}$$
 $$\begin{gather}\frac{\partial {{{u}_{i}}}}{\partial t}+\frac{1}{J}\frac{\partial }{\partial {{\xi }_{k}}}( \beta _{j}^{k}{{{u}_{i}}} {{{u}_{j}}} )={-}\frac{1}{J\rho }\frac{\partial ( \beta _{i}^{k}{p} )}{\partial {{\xi }_{k}}} -\frac{1}{\rho }\varPi {{\delta }_{1i}}+\frac{\nu }{J}\frac{\partial }{\partial {{\xi }_{p}}}\left( \frac{1}{J}\beta _{j}^{p}\beta _{j}^{q}\frac{\partial {{{u}_{i}}}}{\partial {{\xi }_{q}}} \right). \end{gather}$$
 Here, governing equations are expressed using tensor notations, and the streamwise ( $x$), vertical (
 $y$) and spanwise (
 $z$) coordinates shown in figure 1 are denoted using
  $x_{i}$ for
  $i=1$, 2 and
  $3$, respectively. In the above equations,
  ${p}, \nu, \rho$ and
  ${{\delta }_{ij}}$ represent the pressure, kinematic viscosity, density of the fluid and Kronecker delta, respectively. In (2.2),
  $\varPi$ is a constant pressure gradient that drives the flow, and
  $\beta _{i}^{j}$ and
  $J$ are the cofactor and Jacobian of tensor
  ${\partial {{x}_{i}}}/{\partial {{\xi }_{j}}}$, respectively.
This computer code has been successfully used for performing DNS of turbulent dispersion of passive concentration plumes in a channel flow (Noormohammadi & Wang Reference Noormohammadi and Wang2019), LES of turbulent flow and structures in a square duct roughened with perpendicular and V-shaped ribs (Fang et al. Reference Fang, Yang, Wang, Tachie and Bergstrom2017), and DNS of both smooth duct flow and transverse rib-roughened duct flow (Mahmoodi-Jezeh & Wang Reference Mahmoodi-Jezeh and Wang2020). Also, a thorough description of the numerical method for DNS of turbulent heat transfer in a transverse rib-roughened duct flow can be found in Mahmoodi-Jezeh & Wang (Reference Mahmoodi-Jezeh and Wang2021). The numerical algorithm is based on a finite-volume method in which a second-order accuracy is achieved with respect to both spatial and temporal discretizations. Within each sub-step of the second-order Runge–Kutta scheme, a fractional-step method is applied and a pressure correction equation is solved using the parallel algebraic multigrid solver. For time advancement, the Courant–Friedrichs–Lewy number is kept approximately at 0.2. A momentum interpolation approach is used to obtain the cell-face velocity components and based on the velocity and pressure values in two adjacent control volumes in order to avoid a potential checkerboard problem of the pressure field. The simulation started with an initial laminar flow solution superimposed with artificial perturbations to trigger turbulence. The precursor simulation was run for an extended duration of 61 flow-through times (i.e.  ${780}\delta / U_b$) until the turbulent flow field became fully developed and statistically stationary. Then, turbulence statistics were collected for a time period over approximately 55 flow-through times (i.e.
  ${704}\delta / U_b$). All the simulations were conducted using the WestGrid (Western Canada Research Grid) supercomputers. For each simulated case, 254 cores were used for performing DNS, and approximately 520 000 CPU hours were spent for solving the velocity field and for collecting the flow statistics after the flow became fully developed and statistically stationary.
2.1. Streamwise domain-size study
In order to accurately predict statistical moments of the velocity field, the streamwise computational domain size  $L_x$ must be held sufficiently large such that all dominant coherent flow structures may fully evolve in the streamwise direction and their wavelengths can be captured in a numerical simulation. To this purpose, the spatial two-point correlation function of streamwise velocity fluctuation (
 $R_{uu}$) is calculated for both ribbed duct cases at two streamwise locations. For a ribbed duct flow, the streamwise two-point auto-correlation coefficient is defined as (Townsend Reference Townsend1980; Volino et al. Reference Volino, Schultz and Flack2009)
 \begin{equation} R_{uu}(x_{ref},{\rm \Delta} x)=\frac{\langle u'(x_{ref})u'(x_{ref}+{\rm \Delta} x)\rangle}{\sqrt{\langle u^{\prime 2}(x_{ref})\rangle\langle u^{\prime 2}(x_{ref}+{\rm \Delta} x)}\rangle}, \end{equation}
where  $u'$ represents the streamwise velocity fluctuations and
  ${\rm \Delta} x$ denotes the relative displacement from the reference point located at
  $x_{ref}$, such that
  $x=x_{ref}+{\rm \Delta} x$. The streamwise coordinate of the reference points are
  $x_{ref}/H= 29.0$ and
  $34.0$, while the vertical coordinate of the reference points is fixed at
  $y_{ref}/H=-3.8$. In terms of the relative streamwise coordinate, the reference points are located near the leeward and windward sides of a rib at
  $x_{ref}'/H=2.0$ and 7.0, respectively.
Figure 2 shows that for both rib cases, the profile of  $R_{uu}$ drops drastically to almost zero at the two ends. This indicates that the velocity statistics are not affected by the streamwise domain size, such that a domain size of
  $L_x=64H$ is sufficiently large for capturing the characteristic length scales of dominant turbulence structures in the streamwise direction. From figure 2, it is also evident that the decaying rates of
  $R_{uu}$ in the inclined rib case are slower than those of the V-shaped rib case at both reference points (
 $x_{ref}/H=29.0$ and 34.0), indicating that the streamwise length scales of turbulent eddies of the inclined rib case are larger than those of the V-shaped rib case. By comparing figure 2(a) with 2(b), it is apparent that the decaying rate of
  $R_{uu}$ is slightly slower at the reference point near the leeward face of the rib (
 $x_{ref}/H=29.0$) than at the reference point near the windward face of the rib (
 $x_{ref}/H=34.0$). More specifically, the value of the streamwise integral length scale (i.e.
  $L_{xx}=\int _0^{\infty }R_{uu}(x)\, \textrm {d} x$) decreases by
  $16.5\,\%$ and
  $4.7\,\%$ as
  $x_{ref}/H$ increases from
  $29.0$ to
  $34.0$ in the inclined and V-shaped rib cases, respectively.

Figure 2. Streamwise profiles of two-point auto-correlations for ribbed duct flows of two rib cases at different streamwise locations ( $x/H$). The vertical coordinate of the reference points is fixed at
  $y_{ref}/H=-3.8$. The streamwise coordinates of the reference points are (a)
  $x_{ref}/H= 29.0$ and (b)
  $x_{ref}/H=34.0$ (in terms of the relative streamwise coordinate, the reference points are located near the leeward and windward of a rib at
  $x_{ref}'/H=2.0$ and
  $x_{ref}'/H=7.0$, respectively). The characteristic streamwise length scale (
 $L_{xx}$) determined based on the streamwise two-point auto-correlation coefficient.
Figure 3 shows the temporal energy spectra of the streamwise velocity fluctuations. The spatial reference points considered here are the same as in figure 2 for the calculation of the streamwise two-point auto-correlation coefficient. Figure 3 shows that for both inclined and V-shaped rib cases, the difference between the highest and lowest frequencies is of the order of four. This implies that the statistical sampling range is deemed to be sufficient to resolve all significant temporal scales of the studied turbulent flows. From figure 3 it is also observed that the energy spectrum is strongly influenced by the rib geometry, as the  $-5/3$ slope (which is a characteristic of equilibrium turbulence regime, Pope Reference Pope2000) is apparently absent near the leeward and windward faces of the rib (at
  $x_{ref}/H=29.0$ and 34.0, respectively). This indicates the presence of small-scale structures with a high degree of anisotropy due to the disturbances from the ribs.

Figure 3. Non-dimensionalized temporal energy spectra of streamwise velocity fluctuations for both inclined and V-shaped rib cases. The streamwise coordinates of the reference points are (a)  $x_{ref}/H= 29.0$ and (b)
  $x_{ref}/H=34.0$. The comparison of the two ribbed flow cases is conducted at the elevation that is slightly above the rib crest (with the spatial reference point being identical to that used in figures 2a and 2b).
2.2. Grid resolution
The number of body-fitted grid points used in the current simulations are  $N_x \times N_z \times N_y = 1424 \times 168 \times 162$ in the streamwise, vertical and spanwise directions, respectively. The mesh is non-uniform in all three directions, and is refined near all solid surfaces. To ensure that the local resolution of this grid is sufficient for conducting DNS of turbulent flow over different rib geometries, the contours of the ratio between the maximal dimension of a grid cell in all three directions (i.e.
  ${{\varDelta }}= \max ({{\varDelta }_{x}},{{\varDelta }_{y}},{{\varDelta }_{z}})$) and Kolmogorov length scale,
  $\eta =({\nu }^{3}/\varepsilon )^{0.25}$, in the central (
 $x$–
$x$– $y$) plane (located at
  $z/H=0.0$) are plotted in figure 4. Here,
  $\varepsilon =\nu \langle {a}'_{ij} {a}'_{ij} \rangle$ is the TKE dissipation rate, with
  ${a'_{ij}}={\partial {{u}_{i}'}}/{\partial x_{j}}$ being the fluctuating velocity gradient tensor. In their DNS study of turbulent channel flows, Moser & Moin (Reference Moser and Moin1987) indicated that the grid size requires to be of the same order as the Kolmogorov length scale (i.e.
  $O(\varDelta /\eta )\sim O(1)$) in order to accurately capture the TKE dissipation pertaining to the smallest scales of turbulence.

Figure 4. Contours of the ratio between the grid resolution and Kolmogorov length scale ( ${{\varDelta }}/\eta$) in the central plane at
  ${z}/{H}=0.0$ for two rib cases. (a) Inclined rib case and (b) V-shaped rib case.
Figure 4 shows that the maximum magnitude of  ${{\varDelta }_{\max }}/\eta$ occurs in the inter-rib region under the rib height, which is approximately 5.3 and 6.3 for inclined and V-shaped rib cases, respectively. It is therefore expected that the mesh resolutions employed suffice to capture small turbulence motions at the Kolmogorov scale level in the two rib cases. From figure 4 it is evident that the appearance of a local maximum in the contours of
  ${{\varDelta }_{\max }}/\eta$ is associated with a destruction mechanism of the upstream flow structures near the rib elements. A detailed explanation of the rib geometry effects on turbulence structures will be provided in § 4. The spatial resolutions used in this research are comparable to those used by Ismail et al. (Reference Ismail, Zaki and Durbin2018), who conducted a DNS study of turbulent flows in a channel with rough-to-smooth step changes based on a second-order accurate finite-difference computer code.
3. Statistics of the velocity field
3.1. Mean velocity field
Figure 5 shows the time-averaged streamlines superimposed onto the mean streamwise velocity field in the central vertical ( $x$–
$x$– $y$) plane located at
  $z/H=0.0$ for two rib cases. From figure 5 it is observed that both the contours of
  $\langle u\rangle /U_b$ and the mean streamlines are influenced significantly by the rib geometries. This inevitably leads to changes in the spatial distribution of skin friction and pressure coefficients, which will be discussed separately in this section. From figure 5(a) it is seen that for the inclined rib case, no apparent separation bubbles are present at the square duct midspan in the near-wall region below the rib height. This phenomenon is mainly attributed to the occurrence of large vortices unique for the inclined rib flow case, which reduce the tendency of generating separation bubbles in the leeward side of the rib. These physical features are consistent with the observations of Bonhoff et al. (Reference Bonhoff, Parneix, Leusch, Johnson, Schabacker and Bölcs1999) who studied the effects of inclined ribs on the turbulence statistics in a rectangular duct flow using a planar PIV. By contrast, for the V-shaped rib case as shown in figure 5(b), a large single separation bubble (marked with ‘A’) exists in the inter-rib region below the rib height. From figure 5(b) it is observed that due to the downdraft of the mean flow, the separation bubble behind the rib is squeezed towards the leeward face of the V-shaped rib, which further leads to the formation of a region of high pressure values. This well explains the pressure drag difference between the inclined and V-shaped rib cases shown previously in table 1. By comparing figures 5(a) with 5(b), it is seen that for the inclined rib case, the highest streamwise momentum level as indicated by the magnitude of
  $\langle u\rangle /U_b$ appears in regions well above the rib crest (for
  $y/H>-3.7$), whereas for the V-shaped rib cases, the maximum value of
  $\langle u\rangle /U_b$ occurs near the rib crest due to an enhanced pressure difference. As is evident in figure 5(b), the reattachment length in the V-shaped rib case is observed to be
  $4.0H$ which is comparable to
  $4.1H$ reported in Fang et al. (Reference Fang, Yang, Wang, Tachie and Bergstrom2017) based on their LES study of turbulent flows over transverse and V-shaped ribs at a Reynolds number of
  $Re_b=10\ 000$.

Figure 5. Contours of the mean streamwise velocity  $\langle u\rangle /U_b$ superimposed with in-plane mean streamlines in the central (
 $x$–
$x$– $y$) plane (located at
  $z/H=0.0$) for two rib cases. (a) Inclined rib case and (b) V-shaped rib case.
Figure 6 compares the vertical profiles of the non-dimensionalized mean streamwise and vertical velocity profiles (i.e.  $\langle u\rangle /U_b$ and
  $\langle v\rangle /U_b$, respectively) of the two rib cases along the central vertical lines located at
  $(x'/H,z/H)=(2.0, 0.0)$, (4.5, 0.0) and (7.0, 0.0). From figure 6 it is evident that the maximum value of
  $\langle u\rangle /U_b$ in both rib cases occurs above the rib height and then decreases monotonically as the relative downstream distance from the rib (
 $x'/H$) increases from 2.0 to 7.0, a pattern that is remarkably different from those in a canonical 2-D turbulent boundary layer over a flat plate (Miyake et al. Reference Miyake, Tsujimoto and Nakaji2001; Leonardi et al. Reference Leonardi, Orlandi, Djenidi and Antonia2004; Ikeda & Durbin Reference Ikeda and Durbin2007; Burattini et al. Reference Burattini, Leonardi, Orlandi and Antonia2008; Volino et al. Reference Volino, Schultz and Flack2009) or in a transverse rib-roughened duct flow (Coletti et al. Reference Coletti, Maurer, Arts and Di Sante2012; Labbé Reference Labbé2013; Mahmoodi-Jezeh & Wang Reference Mahmoodi-Jezeh and Wang2020). As an example, for the 2-D riblet flow over a flat plate, the magnitude of
  $\langle u\rangle /U_b$ reaches its maximum near the central region of the channel (Miyake et al. Reference Miyake, Tsujimoto and Nakaji2001; Volino et al. Reference Volino, Schultz and Flack2009). The existence of this mean streamwise velocity peak further causes the appearance of the strong shear layers (as indicated by the magnitude of mean streamwise velocity gradient
  $\textrm {d}\langle u\rangle /{\textrm {d} y}$ near the rib crest), which is often accompanied by an increase in the value of the TKE production rate (i.e.
  $-\langle u'_iu'_j \rangle {\partial \langle u_i \rangle }/{\partial x_j}$). From figure 6 it is also clear that for both ribbed duct cases, the vertical gradient of
  $\langle u\rangle$ is positive in the region near the ribbed bottom wall (for
  $-5.0< y/H<-4.0$), which indicates an acceleration of the mean flow in the downstream direction. However, as the duct centre is approached, the vertical gradient of
  $\langle u\rangle$ becomes negligible and negative in the inclined and V-shaped rib cases, respectively. In contrast to the monotonic variation of the mean streamwise velocity
  $\langle u\rangle /U_b$ with an increasing relative streamwise distance
  $x'/H$, the mean vertical velocity
  $\langle v\rangle /U_b$ exhibits a complex behaviour near the ribbed bottom wall. As demonstrated in figure 6, in the region near the rib crest at
  $x'/H=2.0$, the value of
  $\langle v\rangle /U_b$ is positive and negative in the inclined and V-shaped rib cases, respectively. This further confirms that the mean flow field is sensitive to the rib geometry. As seen in figure 6(a), the magnitude of
  $\langle v\rangle /U_b$ in the inclined rib case remains unchanged as the vertical distance from the rib crest increases. However, as is clear in figure 6(b), the magnitude of
  $\langle v\rangle /U_b$ in the V-shaped rib case decreases as the duct centre approaches, a feature that is consistent with the qualitative results shown previously in figure 5(b). From figures 5 and 6, it is understood that the magnitudes of the mean streamwise velocity gradient
  $|\textrm {d}\langle u\rangle /{\textrm {d} y}|$ reaches its maximum near the rib crest (in the vertical direction) and at the relative streamwise location
  $x'/H=2.0$ in the two rib cases. In view of this, in the remainder of our analysis, we need to pay close attention to the flow physics occurring at this special relative streamwise location
  $x'/H=2.0$.

Figure 6. Comparison of the non-dimensionalized mean streamwise and vertical velocity profiles (indicated by the black and blue colours, respectively) at three relative downstream locations from the rib (for  $x'/H=2.0$ (dash-dot-dot), 4.5 (dashed) and 7.0 (solid)) in the central plane (located at
  $z/H=0$) for two ribbed duct flow. The horizontal red dashed line demarcates the rib crest. (a) Inclined rib case and (b) V-shaped rib case.
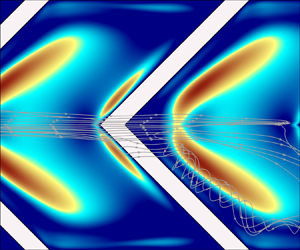
Figure 7 shows the contours of non-dimensionalized mean streamwise vorticity (defined as  $\langle \omega _x\rangle =\partial \langle w\rangle /\partial y-\partial \langle v\rangle /\partial z$) superimposed with the mean spanwise-vertical velocity streamlines in the (
 $y$–
$y$– $z$) plane at the relative streamwise location
  $x'/H=2.0$ for two ribbed duct cases. From figure 7 it is seen that the pattern of the secondary flow is strongly influenced by the rib geometry, causing substantial variations in momentum transfer in the cross-stream plane. As is evident in figure 7(a), for the inclined rib case, the secondary flow appears as a large streamwise-elongated vortex, which occupies almost the entire cross-section of the square duct. Owing to the interaction between this large-scale circulation of the fluid with the four boundary layers developed over the duct walls, high-level negatively valued mean streamwise vorticity
  $\langle \omega _x\rangle$ appears near all four sidewalls. From figure 7(b) it is clear that the vortex pattern of the mean flow in the V-shaped rib case is drastically different from that in the inclined rib case since the secondary flow develops into a pair of large symmetrical counter-rotating vortices in the cross-stream directions. This figure also shows that due to the angled ribs in the V-shaped rib case, the mean streamwise vorticity generated in the near-rib region is convected sideways and upwards by the secondary flow, interacting with the boundary layers over the two vertical sidewalls, and creating a region with high values of
  $\langle \omega _x\rangle$ near the sidewalls above the rib height (
 $y/H=-2.5$).

Figure 7. Contours of non-dimensionalized mean streamwise vorticity ( $\langle \omega _x\rangle /(U_b/\delta ))$ superimposed with the mean spanwise-vertical velocity streamlines in the (
 $y$–
$y$– $z$) plane at the relative streamwise location
  $x'/H=2.0$ for the two rib cases. For clarity, only large dominant vortices are shown in the cross-stream plane. (a) Inclined rib case and (b) V-shaped rib case.
Figure 8 compares the spanwise profiles of non-dimensionalized mean streamwise and vertical velocity profiles (i.e.  $\langle u\rangle /U_b$ and
  $\langle v\rangle /U_b$, respectively) along three elevated lines positioned at
  $(x'/H, y/H)=(2.0, -3.8), (2.0, -2.5)$ and
  $(2.0, 0.0)$ of the two ribbed duct cases. From figure 8 it is clear that the profiles of
  $\langle u\rangle /U_b$ and
  $\langle v\rangle /U_b$ for the inclined rib case are asymmetrical in the cross-stream directions, but symmetrical for the V-shaped rib case at all three vertical locations. Figure 8 also shows that the presence of the cross-stream secondary flow motion influences significantly the spanwise distributions of both
  $\langle u\rangle /U_b$ and
  $\langle v\rangle /U_b$. From figure 8(a) it is seen that for the inclined rib case, the spanwise profile of
  $\langle u\rangle /U_b$ at all three vertical locations is skewed toward one side of the duct, with its magnitude peaks approximately at
  $z/H=-1.7$. However, for the V-shaped rib case as shown in figure 8(b), the profile of
  $\langle u\rangle /U_b$ peaks not only at the duct centre but also near the two vertical sidewalls (located at
  $z/H=\pm 5.0$). By comparing figure 8(a) with 8(b), it is apparent that the highest value of
  $\langle u\rangle /U_b$ occurs at
  $y/H=-2.5$ in the inclined rib case, and at
  $y/H=-3.8$ in the V-shaped rib case, indicating that the highest level of streamwise momentum occurs in the lower-half duct (for
  $y/H<0.0$) in both rib cases. This observation is consistent with the previous analysis of figure 5 and with the observations of Gao & Sundén (Reference Gao and Sundén2004b) and Fang et al. (Reference Fang, Yang, Wang, Tachie and Bergstrom2015), who conducted PIV experiments of ribbed duct flows with a similar geometrical set-up.

Figure 8. Spanwise profiles of the non-dimensionalized mean streamwise and vertical velocity profiles (indicated by the black and blue colours, respectively) along three elevated lines positioned at  $y/H=-3.8$ (dash-dot-dot),
  $-2.5$ (dashed) and
  $0.0$ (solid) for the two rib cases. The relative streamwise coordinate of the point is fixed at
  $x'/H=2.0$. (a) Inclined rib case and (b) V-shaped rib case.
For the mean vertical flow motion, figure 8(a) shows that the profile of  $\langle v\rangle /U_b$ in the inclined rib case manifests two distinct peaks, one positively valued and one negatively valued, located at
  $z/H=-5.0$ and 5.0, respectively. This clearly indicates upward- and downward-moving of the flow near the sidewalls of the duct, which is a direct consequence of the appearance of the mean secondary flows in the cross-stream plane (see figure 7a). However, as shown in figure 8(b), the magnitude of
  $\langle v\rangle /U_b$ in the V-shaped rib case peaks close to the two vertical sidewalls of the duct. Furthermore, the peak magnitude
  $\langle v\rangle /U_b$ decreases as the distance from the sidewalls increases. This trend reflects the fact that the mean flow near the sidewalls is pushed upwards (corresponding to the positive sign of
  $\langle v\rangle /U_b$) and then convected downwards near the central region (corresponding to the negative sign of
  $\langle v\rangle /U_b$). From figure 8, it is observed that for both rib cases, the secondary flow effect on the mean flow field is the largest at
  $y/H=-2.5$, hence, our study needs to be refined to investigate the influence of secondary flow on the major characteristics of the flow field at this specific vertical position later in § 3.3.
3.2. Viscous and pressure drags
The effects of rib geometry on the mean flow field can be further investigated through an analysis of the skin friction and pressure coefficients, defined as  ${{C}_{f}}={{\tau }_{w}}/(\rho U_{b}^{2}/2)$ and
  ${{C}_{p}}={\langle p \rangle }/{(\rho {{U}_{b}^{2}} /2)}$, respectively, where
  ${\tau }_{w}$ represents the local total wall friction stress calculated as
  $\tau _w = \mu [ (\partial \langle u \rangle /\partial y)^2+(\partial \langle w \rangle /\partial y )^2]_{w}^{1/2}$. Figure 9 shows the distributions of the skin friction
  ${{C}_{f}}$ on the bottom wall located at
  $y/H= -0.5$ for two ribbed duct cases. To explain the influence of the mean flow structures on the local
  $C_f$ value, the mean velocity streamlines are also superimposed. From figure 9 it is evident that owing to the presence of ribs and strong secondary flows, the magnitude of
  $C_f$ varies considerably along the cross-stream directions, indicating that this 3-D rib-roughened duct flow is remarkably inhomogeneous in the spanwise direction. As seen in figure 9(a), the highest value of
  $C_f$ in the inclined rib case appears at the corner on the leeward side of the upstream ribs near the vertical sidewall of the duct (at
  $z/H=5.0$). This is due to the fact that the secondary flow induces a strong downwash of mean flows towards the ribbed bottom wall (see figures 7a and 8a), further resulting in a large magnitude of the streamwise velocity gradient in the vertical direction. By contrast, in the V-shaped rib case as shown in figure 9(b), the highest friction coefficient values appear near the leeward face of the rib elements in the central region (for
  $-2.5< z/H<2.5$). This peak of
  $C_f$ coincides exactly with the core of vortex A exhibited previously in figure 5(b). Furthermore, it is apparent that both streamlines and vortex A (featuring high values of
  $C_f$) evolve along the V-shaped ribs and then become aligned with the main stream in regions near the sidewalls.

Figure 9. Contours of the skin friction coefficient  $C_f$ displayed in the (
 $x$–
$x$– $z$) plane on the bottom wall located at
  $y/H=-5.0$ for the two rib cases. (a) Inclined rib case and (b) V-shaped rib case. The presentation of the contour plots of
  $C_f$ is superimposed with the mean velocity streamlines. Given the spanwise symmetry of the mean flow in the V-shaped rib case, streamlines are plotted only in one-half of the duct in panel (b) for clarity.
Figure 10 compares the spatial distributions of pressure coefficient  $C_p$ of the two ribbed duct cases over the ribbed bottom wall located at
  $y/H=-5.0$. From figures 10(a) and 10(b), it is evident that similar to the skin friction coefficient, both the pressure coefficient level and its spatial distribution are sensitive to the rib geometry. Figure 10(a) clearly demonstrates the spatial evolution of the streamlines of the mean flow and shows how the flow turns as it passes over the inclined ribs. First, flow intensively interacts with the windward face of the upstream rib near the vertical sidewall of the duct (at
  $z/H=5.0$), causing the flow to become stagnant and create a high pressure region (marked with ‘I’), then the flow in the inter-rib region is driven toward the other sidewall (at
  $z/H=-5.0$) and impinges onto the windward side of the downstream rib, which results in the generation of the second and third high pressure regions (marked with ‘II’ and ‘III’, respectively). As a result, the mean separation bubble occurs near region II at
  $z/H=-5.0$, as shown in figure 10(a). From figure 10(b) it is observed that the mean streamline topology in the V-shaped rib case is substantially different from that of the inclined rib case. Figure 10(b) shows that the magnitude of
  $C_p$ reaches its maximum near the windward face of the V-shaped ribs (marked with ‘I’) and near the reattachment point (marked with ‘II’). Furthermore, owing to the angled ribs in the V-shaped rib case, the mean streamlines diverge from the duct midspan towards the sidewalls below the rib height and impinge on the two vertical sidewalls of the duct, leading to the formation of a region with high values of
  $C_p$ (marked with ‘III’). By comparing figures 9 with 10, it is concluded that the pressure difference between the windward and leeward faces of the ribs greatly contribute to increasing the total drag (see table 1). Furthermore, if we compare the mean flow features of the full inclined ribbed duct shown in figure 10(a) with that of one-half the V-shaped duct (for
  $z/H=-5.0$) shown in figure 10(b), certain similarity can be observed in terms of the streamline and
  $C_p$ contour patterns. More specifically, the mean flow pattern exhibited in the V-shaped ribbed duct is almost a pair of mirror reflections of that of the inclined rib case. The same can be concluded by comparing figures 9(a) and 9(b) with respect to the spatial distribution of the
  $C_f$ values.

Figure 10. Contours of the pressure coefficient  $C_p$ displayed in the (
 $x$–
$x$– $z$) plane on the bottom wall located at
  $y/H=-5.0$ for the two rib cases. (a) Inclined rib case and (b) V-shaped rib case. The presentation of the contour plots of
  $C_p$ is superimposed with the mean velocity streamlines. Given the spanwise symmetry of the mean flow in the V-shaped rib case, streamlines are plotted only in one-half of the duct in panel (b) for clarity.
3.3. Reynolds stress distributions
Figure 11 compares the contours of the non-dimensionalized mean Reynolds normal stress components ( $\langle u'u'\rangle /U_b^2, \langle v'v'\rangle /U_b^2$ and
  $\langle w'w'\rangle /U_b^2$) in the central (
 $x$–
$x$– $y$) plane (located at
  $z/H=0.0$) for two rib cases. From figure 11(a) it is seen that for the inclined rib case, the magnitude of the streamwise Reynolds normal stress
  $\langle u'u'\rangle$ peaks in the neighbourhood of the rib crest and then decreases as the downstream distance from the leading edge of the rib (
 $x'/H=0.0$) increases. This enhancement in the magnitude of
  $\langle u'u'\rangle$ immediately downstream of the rib crest is a result of the occurrence of the boundary-layer separation near the leading edge of the rib, which also produces strong spanwise vortex shedding. However, as shown in figure 11(b), the primary peak of
  $\langle u'u'\rangle$ in the V-shaped case occurs in the inter-rib region (below the rib height) in the lee of the ribs. This is due to the negative values of
  $\langle v\rangle /U_b$ induced by the secondary flows, which results in a downwash of high momentum flow from duct centre to the ribbed wall (see figures 5b, 6b and 7b). By comparing figure 11(c) with 11(d), it is observed that the highest levels of the vertical Reynolds normal stress
  $\langle v'v'\rangle$ in the inclined rib case are mainly concentrated around the rib height; however, in the V-shaped rib case, large values of
  $\langle v'v'\rangle$ are primarily confined within a small region below the rib height. As is seen clearly in figure 11(e), in the inclined rib case the contours of the spanwise Reynolds normal stress
  $\langle w'w'\rangle$ exhibit two distinct peaks, one in the near-wall region below the rib height and one near the rib height. The occurrence of these two peaks is a unique feature of the inclined rib-roughened duct flow. By contrast, in the V-shaped rib case the maximum value of
  $\langle w'w'\rangle$ is only observed within the cavity (for
  $2.0< x'/H<4.0$), which nearly coincides with those of
  $\langle u'u'\rangle$ and
  $\langle v'v'\rangle$ shown in figures 11(b) and 11(d), respectively.

Figure 11. Contours of non-dimensionalized Reynolds normal stress components ( $\langle u'u'\rangle /U_b^2, \langle v'v'\rangle /U_b^2$ and
  $\langle w'w'\rangle /U_b^2$) in the central (
 $x$–
$x$– $y$) plane for the inclined rib case (a,c,e) and V-shaped rib case (b,d, f). To facilitate a clear visual comparison, contour values less than 20 % of the peak value of Reynolds normal stresses are clipped off. The cross symbol
  $\times$ marks the local peak positions of Reynolds normal stresses.
To further investigate the effects of rib geometry on the velocity field, figure 12 compares the vertical profiles of non-dimensionalized Reynolds normal stresses ( $\langle u'u'\rangle /U_b^2, \langle v'v'\rangle /U_b^2$ and
  $\langle w'w'\rangle /U_b^2$) of two rib cases along the central vertical lines located at
  $(x'/H,z/H)=(2.0, 0.0)$, (4.5, 0.0) and (7.0, 0.0). From figure 12 it is observed that for both ribbed duct cases, the highest turbulent levels (as indicated by the magnitudes of Reynolds normal stresses) occur around the rib height at the relative streamwise location
  $x'/H=2.0$, where the shear strength is the largest (see figure 6). The shear layer generated over the rib crest separates immediately after the rib, shedding downstream energetically and causing an enhancement in the variance of velocity fluctuations. Furthermore, it is observed that for both rib cases, the peak value of all the three Reynolds stress components reduces monotonically near the rib crest as
  $x'/H$ increases from 2.0 to 7.0. From figure 12 it is clear that owing to the disturbances from the ribs, the magnitudes of Reynolds normal stresses in both inclined and V-shaped rib cases are significantly amplified on the ribbed bottom wall side than on the smooth top wall side. Also, it is apparent that although there exists a drastic difference in the patterns of the Reynolds normal stresses profiles below the rib height (
 $y/H<-4.0$) between these two ribbed duct cases, they all collapse to a single profile above the rib height (
 $y/H>-4.0$). From figures 12(a), 12(c) and 12(e), it is evident that for the inclined rib case, the magnitudes of normal components reduce considerably as the duct centre is approached, especially on the ribbed side. By contrast, for the V-shaped rib case as shown in figures 12(b), 12(d) and 12( f), the magnitudes of normal components increase and peak near the duct centre, contributing to a local enhancement of TKE.

Figure 12. Comparison of the non-dimensionalized Reynolds normal stress components ( $\langle u'u'\rangle /U_b^2, \langle v'v'\rangle /U_b^2$ and
  $\langle w'w'\rangle /U_b^2$) at three relative streamwise locations (for
  $x'/H=2.0$, 4.5 and 7.0) in the central vertical plane (located at
  $z/H=0$) for the inclined rib case (a,c,e) and V-shaped rib case (b,d, f). The horizontal red dashed line demarcates the rib crest. In order to show clearly the profiles of the Reynolds stresses below the rib crest, they are partially enlarged and replotted in inset graphs in panels (b), (d) and (e).
Figure 13 compares the vertical profiles of Reynolds shear stress ( $\langle u'v'\rangle /U_b^2$) along the central vertical lines located at
  $(x'/H, z/H)=(2.0, 0.0)$, (4.5, 0.0) and (7.0, 0.0) for the two ribbed duct flow cases. From figure 13 it is seen that similar to the trend of
  $\langle u'u'\rangle$ shown previously in figures 12(a) and 12(b) (for inclined and V-shaped rib cases, respectively), the Reynolds shear stress component
  $\langle u'v'\rangle$ peaks around the rib height for both rib cases, with the magnitude decreasing progressively as the relative streamwise distance
  $x'/H$ increases. Since the Reynolds shear stress is a reflection of the sweeping or ejection events, it implies that the strength of both events is significant near the rib crest but becomes trivial as
  $x'/H$ increases from 2.0 to 7.0. Later in § 4 we will refine our study by examining the rib geometry effects on turbulent motions through a quadrant analysis of the ejection and sweep events. From figure 13(a) it is clear that as the duct centre is approached, the magnitude of
  $\langle u'v'\rangle$ gradually increases and a positive peak occurs in its profile at
  $y/H=2.3$ in the inclined rib case. By contrast, for the V-shaped rib case as seen from figure 13(b), the magnitude of
  $\langle u'v'\rangle$ in all three streamwise locations becomes trivial in the central region of the duct. In fact, the profile of
  $\langle u'v'\rangle$ in the V-shaped rib case becomes almost a vertical straight line with a small magnitude in the region
  $-4.0< y/H<4.0$.

Figure 13. Profiles of the non-dimensionalized Reynolds shear stress ( $\langle u'v'\rangle /U_b^2$) at three relative streamwise locations (for
  $x'/H=2.0$, 4.5 and 7.0) in the central vertical plane (located at
  $z/H=0$) for the two rib cases. The horizontal red dashed line demarcates the rib crest. (a) Inclined rib case and (b) V-shaped rib case.
Figure 14 compares the spanwise profiles of the Reynolds normal ( ${{{\langle {{u}'{u}'}\rangle }}}, {{{\langle {{v}'{v}'}\rangle }}}$ and
  ${{{\langle {{w}'{w}'}\rangle }}}$) and shear (
 ${{{\langle {{{u}'}{{v}'}}\rangle }}}$) stresses along an elevated line positioned at
  $(x'/H, y/H)=(2.0, -2.5)$ for the two rib cases. From figure 14 it is evident that for both inclined and V-shaped rib cases, the highest Reynolds stress levels appear near the vertical sidewalls and decay in magnitude as the duct centre is approached. This physical feature is mainly attributed to the difference of the rib geometries and associated secondary flow patterns in the cross-stream plane shown previously in figure 7. Figure 14(a) shows that for the inclined rib case, the magnitudes of the three normal components are comparable in value near the sidewall (located at
  $z/H=-5.0$), indicating that turbulence tends to be locally isotropic in this region. However, the three Reynolds normal stress magnitudes are significantly different near the other sidewall (located at
  $z/H=5.0$), with the magnitude of
  ${{{\langle {{u}'{u}'}\rangle }}}$ being approximately 1.9 and 8.7 times larger than those of
  ${{{\langle {{v}'{v}'}\rangle }}}$ and
  ${{{\langle {{w}'{w}'}\rangle }}}$, respectively. This implies that
  ${{{\langle {{u}'{u}'}\rangle }}}$ makes the primary contribution to the TKE among the three Reynolds normal stress components and also indicates the anisotropic states of turbulence in this region (near the side wall located at
  $z/H=5.0$). Given spanwise symmetry of the mean flow field in the V-shaped ribbed duct case, only one-half of the Reynolds stress profiles are displayed in figure 14(b). From figure 14(b) it is seen that near the two vertical sidewalls, the magnitude of
  ${{{\langle {{w}'{w}'}\rangle }}}$ is larger than those of
  ${{{\langle {{u}'{u}'}\rangle }}}$ and
  ${{{\langle {{v}'{v}'}\rangle }}}$ in the V-shaped rib case. This phenomenon reflects the fact that TKE is mostly contributed by
  ${{{\langle {{w}'{w}'}\rangle }}}$ (instead of
  $\langle u'u'\rangle$ and
  $\langle v'v'\rangle$), a physical feature that is drastically different from that of an inclined ribbed duct flow.

Figure 14. Spanwise profiles of Reynolds normal ( ${{{\langle {{u}'{u}'}\rangle }}}, {{{\langle {{v}'{v}'}\rangle }}}$, and
  ${{{\langle {{w}'{w}'}\rangle }}}$) and shear (
 ${{{\langle {{{u}'}{{v}'}}\rangle }}}$) stresses along an elevated line positioned at
  $(x'/H, y/H)=(2.0, -2.5)$ for the two rib cases. (a) Inclined rib case and (b) V-shaped rib case. In panel (b), for the V-shaped rib-roughened duct, only one-half of the duct is plotted given the spanwise symmetry of the profiles (the horizontal dashed line on the top of the panel demarcates the symmetric centre for
  $z/H=0.0$). Note that the spanwise profiles of Reynolds normal and shear stresses cross through only one rib, as they are plotted at the relative streamwise location
  $x'/H=2.0$.
Figure 15 shows the contours of the instantaneous TKE (defined as  $k_t=(u^{\prime 2}+v^{\prime 2}+w^{\prime 2})/2$) in the central (
 $x$–
$x$– $y$) plane located at
  ${z}/{H}=0.0$ for two different rib cases. From figure 15 it is seen that owing to the mechanisms such as vortex shedding and secondary flows, the TKE generated around the rib elements are deflected and then spread to the smooth top wall in both inclined and V-shaped rib ducts. By comparing figures 15(a) and 15(b), it is apparent that in the region well above the rib height, the intensity of turbulence as indicated by the value of
  $k_t$ in the V-shaped rib case is greater than that in the inclined rib case.

Figure 15. Contours of instantaneous TKE  $k_t=(u^{\prime 2}+v^{\prime 2}+w^{\prime 2})/2$ (non-dimensionalized using
  ${U}_{b}^2$) in the central (
 $x$–
$x$– $y$) plane located at
  ${z}/{H}=0.0$ for two different rib cases. (a) Inclined rib case and (b) V-shaped rib case.
3.4. Anisotropy invariant map
A detailed analysis of the effects of rib geometry on turbulence anisotropy can be conducted through the anisotropy invariant map (AIM) proposed by Lumley & Newman (Reference Lumley and Newman1977). This AIM provides a description of the local flow topologies associated with the Reynolds stress anisotropy tensor, defined as
 \begin{equation} {{b}_{ij}}=\frac{\langle {{u}_{i}'}{{u}_{j}'} \rangle }{\langle {{u}_{k}'}{{u}_{k}'} \rangle }-\frac{1}{3}{\delta}_{ij}.\end{equation}
The Reynolds stress anisotropy tensor has three invariants in the context of an incompressible flow, one zero (i.e.  $\mbox {I}=b_{ii}=0.0$) and two non-trial invariants (i.e.
  $\mbox {II}=b_{ij}b_{ji}$ and
  $\mbox {III}=b_{ij}b_{jk}b_{ki}$). Invariant II quantifies the degree of turbulence anisotropy, while invariant III indicates the nature of the turbulence anisotropy (Lumley Reference Lumley1979; Antonia, Djenidi & Spalart Reference Antonia, Djenidi and Spalart1994; Oyewola, Djenidi & Antonia Reference Oyewola, Djenidi and Antonia2004). There are three distinct characteristic states of turbulence associated with the so-called Lumley triangle: the axisymmetric turbulence state where one eigenvalue of the Reynolds stress tensor is either larger (
 $\mbox {III}>0.0$) or smaller (
 $\mbox {III}<0.0$) than the other two which are precisely equal in magnitude, and the two-component turbulence state in which one eigenvalue of the Reynolds stress tensor vanishes more rapidly than the other two (i.e. statistically 2-D turbulence). All possible turbulent states must lie within the Lumley triangle, because states outside of the Lumley triangle relate to non-realizable Reynolds stresses. Limiting points at the ends of the three defining curves of the Lumley triangle correspond to the isotropic turbulence state (
 $\mbox {II}=0.0$ and
  $\mbox {III}=0.0$), two-component isotropic turbulence state (
 $\mbox {II}=1/6$ and
  $\mbox {III}=-1/36$) and one-component turbulence state (
 $\mbox {II}=2/3$ and
  $\mbox {III}=2/9$).
Figure 16 compares the AIMs of the Reynolds stress anisotropy tensor along the central vertical line positioned at  $(x'/H, z/H)=(2.0, 0.0)$ for both rib cases. From figure 16(a) it is seen that in the region very close to the ribbed bottom wall (for
  $-5.0< y/H<-4.9$), the state of
  $b_{ij}$ in the inclined rib case lies on the two-component turbulence state. This is simply because the magnitude of
  $\langle v'v'\rangle$ is negligibly small in comparison with those of
  $\langle u'u'\rangle$ and
  $\langle w'w'\rangle$ in this region (see figures 12a, 12c and 12e). However, as the vertical distance from the ribbed bottom wall increases to the range of
  $-4.9< y/H<-3.8$, the vertical normal stress
  $\langle v'v'\rangle$ makes increasingly important contributions to the TKE causing the turbulence flow to move towards the axisymmetric state. In the region well above the rib crest (for
  $-3.8< y/H<4.0$), the state of
  $b_{ij}$ turns towards the isotropic state where TKE is evenly distributed among the three normal components (see figures 12a, 12c and 12e). As the smooth top wall is approached (for
  $4.0< y/H<5.0$), the state of
  $b_{ij}$ falls back to the two-component turbulence state due to the enhanced damping effect of the smooth top wall on the vertical normal stress
  $\langle v'v'\rangle$. The wall anisotropy near the smooth top wall is similar to those of a smooth plane-channel flow observed by Lee & Choi (Reference Lee and Choi2001). As is evident in figure 16(b), the invariants in the V-shaped rib case exhibit a similar trend to that of the inclined rib case for most of the vertical positions, with the exception of the region just below the rib crest (at
  $y/H=-4.25$). At this elevation
  $y/H=-4.25$, the value of TKE is dominated by
  $\langle u'u'\rangle$ (see figures 12b, 12d and 12f), resulting in an enhanced degree of turbulence anisotropy in the V-shaped rib case.

Figure 16. Anisotropy invariant map based on  $\mbox {II}=b_{ij}b_{ji}$ and
  $\mbox {III}=b_{ij}b_{jk}b_{ki}$ of the Reynolds stress anisotropy tensor along the central vertical line positioned at
  $(x'/H, z/H)=(2.0, 0.0)$ for both rib cases. (a) Inclined rib case and (b) V-shaped rib case. The solid black line represents a two-component turbulence state (defined as
  $\mbox {II}=2/9+2\mbox {III}$), while both dashed and dash-dotted black lines indicate axisymmetric turbulence states (defined as
  $\mbox {II}=-6(\mbox {III}/6)^{2/3}$ and
  $\mbox {II}=6(\mbox {III}/6)^{2/3}$, respectively). These lines form the boundaries of the so-called Lumley triangle (Lumley & Newman Reference Lumley and Newman1977).
3.5. TKE budget analysis near the rib-roughened wall
To further elucidate the effects of rib geometry on turbulence stresses discussed in § 3.3, the turbulent transport equation of TKE (defined as  $k=\langle u'_iu'_i \rangle /2$) can be studied, which reads as
 \begin{equation} 0=\varPi_k+T_k+D_k+P_k+\varepsilon_k+C_k.\end{equation}
Here,  $\varPi _k, T_k, D_k, P_k, \varepsilon _k$ and
  $C_k$ denote the pressure diffusion term, turbulence diffusion term, viscous diffusion term, turbulent production term, dissipation term and mean convection term, defined as
 $$\begin{gather} \varPi_k={-}\frac{1}{\rho} \frac{\partial \langle p'u'_j \rangle}{\partial x_j},\quad T_k={-}\frac{1}{2} \frac{\partial \langle u'_iu'_iu'_j \rangle}{\partial x_j},\quad D_k=\nu \frac{\partial^2 k}{\partial x^2_j}, \end{gather}$$
 $$\begin{gather}P_k={-} \langle u'_iu'_j \rangle \frac{\partial \langle u_i \rangle}{\partial x_j},\quad \varepsilon_k={-}\nu \langle \frac{\partial u'_i}{\partial x_j}\frac{\partial u'_i}{\partial x_j} \rangle,\quad C_k={-}\langle u_j \rangle \frac{\partial k}{\partial x_j}, \end{gather}$$
respectively.
Figure 17 shows the profiles of TKE budget terms along the central vertical line positioned at  $(x'/H, z/H)=(2.0, 0.0)$ for the two rib cases. In order to clearly demonstrate the profiles of the budget terms around the rib crest, they are plotted partially in figure 17. From the figure, it is clear that the turbulence energy transfer in the vertical direction is sensitive to the rib geometry, as the TKE budgets of these two rib cases are not only different in values but also dissimilar in patterns. As shown in figure 17(a), for the inclined rib case, the budget balance of TKE in the inter-rib region (for
  $-5.0< y/H<-4.5$) is dominated by viscous diffusion
  $D_k$ and turbulence diffusion
  $T_k$ as the source terms; and by convection
  $C_k$, production
  $P_k$ and dissipation
  $\varepsilon _k$ as the sink terms. Furthermore, it is observed from figure 17(a) that the turbulence diffusion term
  $T_k$ changes its sign four times near the ribbed bottom wall (for
  $-5.0< y/H<-3.0$), indicating that this term can be either a source or a sink in the inclined ribbed duct flow case. The appearance of a large positively valued turbulent diffusion term
  $T_k$ below and above the rib height (at
  $y/H=-4.6$ and
  $-3.5$, respectively) clearly indicates that highly turbulent fluid is transported away from these regions. From figure 17(a) it is also apparent that owing to the disturbances from the ribs, a dominant TKE source (as indicated by a distinct peak of turbulent production term
  $P_k$) appears above the rib crest, which is primarily balanced by the four sink terms (i.e. by turbulence diffusion, dissipation, convection and viscous diffusion). This peak of
  $P_k$ coincides with that in the streamwise normal stress
  $\langle u'u'\rangle$ shown previously in figure 12(a). By contrast, as shown in figure 17(b), in the V-shaped rib case, all dominant TKE budget terms peak in a region below the rib height. This feature is fully consistent with the quantitative results shown in figures 12(b), 12(d) and 12( f), in the sense that high levels of Reynolds normal stress components are also mainly concentrated in the region slightly below the rib crest. In the region very close to the ribbed bottom wall (for
  $-5.0< y/H<-4.7$), the TKE budget in the V-shaped rib case is primarily balanced between the viscous diffusion and dissipation terms (i.e.
  $D_k$ and
  $\varepsilon _k$), as the source and sink terms, respectively. However, as the distance from the bottom wall increases in the vertical direction (for
  $-4.4< y/H<-4.0$), the magnitudes of
  $D_k$ and
  $P_k$ become increasingly dominant TKE sources and reach their maxima just below the rib height, balanced by the dissipation term
  $\varepsilon _k$, convection term
  $C_k$ and turbulent diffusion term
  $T_k$. From figure 17 it is apparent that among all six TKE budget terms of (3.2), the pressure diffusion term
  $\varPi _k$ makes the smallest contribution to the TKE balance in both rib cases; therefore, it can be concluded that near the rib elements, the other five budget terms contribute considerably to the TKE balance, and the production and dissipation are not the only significant terms.

Figure 17. Vertical profiles of the budget terms of the TKE transport equation along the central vertical line positioned at  $(x'/H, z/H)=(2.0, 0.0)$ for both rib cases. (a) Inclined rib case and (b) V-shaped rib case. The budget terms are non-dimensionalized using the duct half-height,
  $\delta$, and bulk velocity,
  ${U}_{b}$. In order to show clearly the profiles of the budget terms around the rib crest, they are plotted partially in panels (
 $a$) and (
 $b$). The vertical dash-dotted line demarcates the position of the rib crest.
4. Effects of rib geometry on turbulence structures
To better understand the effects of rib geometry on near-wall turbulence structures, figure 18 demonstrates the isosurfaces of the swirling strength,  $\lambda _{ci}$ (Zhou et al. Reference Zhou, Adrian, Balachandar and Kendall1999), superimposed onto the contours of the ‘instantaneous TKE’ (defined as
  $k_t=(u^{\prime 2}+v^{\prime 2}+w^{\prime 2})/2$) in the (
 $x$–
$x$– $z$) plane located at
  $y/H=-5.0$ for the two rib cases. This figure vividly shows the effects of the rib geometry on the vortical structures in the inclined and V-shaped ribbed duct flow cases. From figure 18(a) it is apparent that due to the inclination angle of the ribs, the energetic vortical structures are deflected towards only one side of the duct (located at
  $z/H=-5.0$), where the secondary flow motion pushes the fluid to move upward as previously shown in figure 7(a). The interactions between these turbulent eddies with the boundary layer developed over the sidewall are the underlying physical causes of the appearance of a local maximum in the profiles of Reynolds stresses and TKE production rate. However, as shown in figure 18(b), the turbulence structures in the V-shaped rib case divert from the duct centre sideways towards both sidewalls (located at
  $z/H=\pm 5.0$); and as a result, a significant fraction of these vortical structures are concentrated near the two vertical sidewalls. From figures 18(a) and 18(b), it is seen that in comparison with the inclined rib case, the V-shaped rib case induces stronger disturbances to the velocity field as turbulence structures apparently become more broken down, and as a result, more vortical structures are generated near the ribbed bottom wall in the V-shaped ribbed duct flow. This physical feature is consistent with the previous analysis of figure 2, in the sense that the length scales of turbulent eddies of the V-shaped rib case are smaller than those of the inclined rib case.

Figure 18. Isosurfaces of the swirling strength  $\lambda _{ci}$ around ribs superimposed with background contours of the instantaneous TKE (i.e.
  $k_t=(u^{\prime 2}+v^{\prime 2}+w^{\prime 2})/2$) in the (
 $x$–
$x$– $z$) plane located at
  $y/H=-5.0$ for the two rib cases. The isosurfaces of swirling strength are coloured using non-dimensionalized elevation
  $y/H$. (a) Inclined rib case and (b) V-shaped rib case.
Figure 19 shows the contours of the non-dimensionalized instantaneous TKE ( $k_t/U_b^2$) superimposed with the isosurfaces of the swirling strength
  $\lambda _{ci}$ in the cross-stream (
 $y$–
$y$– $z$) plane located at
  $x'/H=2.0$ downstream of the rib. As is clear in figure 19, turbulent eddies induced by rib elements are influenced significantly by the secondary flow in the cross-stream directions. From figure 19(a) it is seen that in the inclined rib case, the energetic vortical structures around the rib elements recirculate within the closed square cross-section of the duct due to the presence of secondary flow, which further facilitates the distribution of turbulence energy in the cross-stream directions. As is evident in figure 19(b), for the V-shaped rib case, turbulent eddies are mostly confined near the ribbed bottom wall and the two vertical sidewalls of the duct, a pattern that is consistent with the spatial distributions of the swirling strength isosurfaces shown in figure 18(b). Clearly, energetic turbulent eddies in the duct centre are carried by the cross-stream secondary flow motion towards each vertical sidewall (for the mean secondary flow pattern, see figure 7b), giving rise to a high local Reynolds stress value (see figure 14).

Figure 19. Isosurface of the swirling strength  $\lambda _{ci}$ in the cross-stream (
 $y$–
$y$– $z$) plane at the relative streamwise location
  $x'/H=2.0$ superimposed onto the background instantaneous TKE
  $k_t$ (shown using grey-scaled contours) for the two rib cases. The isosurfaces of swirling strength are coloured using non-dimensionalized elevation
  $y/H$. (a) Inclined rib case and (b) V-shaped rib case.
To further understand the effects of rib geometry on the length scale and inclination angle  $(\alpha )$ of turbulence structures near the ribbed bottom wall, the 2-D spatial two-point auto-correlation function of streamwise velocity fluctuations can be investigated, which is defined as
 \begin{equation} R_{ij}(x'_{ref}, y_{ref}, x', y)=\frac{\langle u_i'(x',y)u_j'(x'_{ref},y_{ref}) \rangle }{\sqrt{\langle u_i^{\prime 2}(x',y) \rangle\langle u_j^{\prime 2}(x'_{ref}, y_{ref}) \rangle}}, \end{equation}
where ( $x'_{ref} , y_{ref}$) are the coordinates of the reference point. The value of
  $R_{ij}$ is statistically stationary, based on averaging over time and over the eight rib periods. The comparison of these two ribbed duct cases is conducted at three reference points with different relative streamwise coordinates (for
  $x'_{ref}/H=2.0, 4.5$ and 7.0) and a common vertical coordinate fixed at
  $y_{ref}/H=-3.8$. This particular vertical position is chosen to sensitize the vortex shedding events over the rib crest and is due to the fact that the shear effect is the largest in this region (see figure 6). As is evident in figure 20, for both rib cases, there exists a small angle
  $\alpha$ between the direction of stretched isopleths and the streamwise direction at all three reference points. Following Volino et al. (Reference Volino, Schultz and Flack2009), Leonardi et al. (Reference Leonardi, Orlandi, Djenidi and Antonia2015) and Fang et al. (Reference Fang, Yang, Wang, Tachie and Bergstrom2015), the inclination angle of the isopleths of
  $R_{uu}$ is quantified using a least-squares fit to the points farthest away from the reference point at contour levels 0.5, 0.6, 0.7, 0.8 and 0.9 in the downstream direction. Furthermore, it is observed that near the leeward face of the rib (at
  $x'_{ref}/H=2.0$), the value of
  $\alpha$ is smaller than that near the windward face of the rib (at
  $x'_{ref}/H=7.0$) in both ribbed duct cases. By comparing figures 20(a) with 20(b), it is apparent that near the leeward and windward faces of the ribs (at
  $x'_{ref}/H=2.0$ and 7.0. respectively), the inclination angle
  $\alpha$ of the V-shaped rib case is greater than that of the inclined rib case, leading to an increase in the communication between the flow near the ribbed bottom wall and that near the smooth top wall. Furthermore, in comparison with the inclined rib case, the characteristic length of the streamwise correlation (as indicated by the length of the outermost isopleth of
  $R_{uu}$) in the V-shaped rib cases is larger than that in the inclined rib case at all three reference points. This physical feature is inconsistent with the observation of figure 2 in the sense that the value of the integral length scale
  $L_{xx}$ in the inclined rib case is larger than that in the V-shaped rib case. From figure 20(b) the mean inclination angle of
  $R_{uu}$ isopleths in the V-shaped rib case is observed to be
  $\alpha =5.6^\circ$ at the reference point
  $(x'_{ref}/H,y_{ref}/H)=(2.0,-3.8)$, which is approximately 3.2 times smaller than that reported by Fang et al. (Reference Fang, Yang, Wang, Tachie and Bergstrom2015) based on their PIV study of turbulent flows over the V-shaped ribs in a square duct at a higher Reynolds number of
  $Re_b= 10\ 000$. Furthermore, as is seen in figure 20(b), with a reference point between two adjacent ribs
  $(x'_{ref}/H,y_{ref}/H)=(4.5,-3.8)$, the value of the inclination angle in the V-shaped rib case becomes negative (i.e.
  $\alpha =-8.1^\circ$), indicating a downwash of the mean flow into the inter-rib region (below the rib height) by the secondary flow (see figures 5b and 6b).

Figure 20. Isopleths of two-point auto-correlation  $R_{uu}$ with respect to the reference points at
  $(x'_{ref}/H,y_{ref}/H)=(2.0, -3.8), (4.5, -3.8)$ and
  $(7.0, -3.8)$ in the central vertical plane located at
  $z/H=0.0$. The isopleth value ranges from 0.5 to 1.0, with the outermost and innermost isopleths corresponding to
  $R_{uu}=0.5$ and 1.0, respectively. The increment between two adjacent isopleths is 0.1 for the two rib cases. (a) Inclined rib case and (b) V-shaped rib case.
Figure 21 compares the distributions of the JPDF of  $u'/u$ and
  $v'/v$ downstream of the rib crest (at the same reference points as in figure 20) for both rib cases. From figure 21(a–c), it is clear that in the inclined rib case, the isopleths of JPDF indicate a tendency towards the second and fourth quadrant (Q2 and Q4) events as described in Adrian (Reference Adrian2007). This phenomenon implies that the ejection (featuring
  $u'<0$ and
  $v'>0$, associated with Q2) and sweep (featuring
  $u'>0$ and
  $v'<0$, associated with Q4) motions make the most contribution to the Reynolds shear stress, resulting in a negatively valued
  $\langle u'v'\rangle$ in the region immediately above the rib height (see figure 13a). The preference for the diagonal direction (indicated using a red dashed-dotted line) at the
  $135^\circ$ angle in the inclined rib case (in figure 21a–c) indicates that there exists a strong correlation between streamwise and vertical velocity fluctuations at all three reference points. By contrast, as shown in figure 21(d–f), the isopleths of JPDF in the V-shaped rib case show an isotropic distribution, which signifies that there is no apparent correlation between the streamwise and vertical velocity fluctuations in the region around the rib height. This observation also suggests an absence of vortices near the rib crest as they are commonly associated with the occurrence of multiple Q2 and Q4 events (Christensen & Adrian Reference Christensen and Adrian2001; Adrian Reference Adrian2007). This physical feature is consistent with the previous analysis of figure 13(b) in the sense that the Reynolds shear stress in the V-shaped rib case is suppressed in the region above the rib crest. This observation is also consistent with the findings of Fang et al. (Reference Fang, Yang, Wang, Tachie and Bergstrom2015) who conducted a PIV experiment to investigate the effects of the V-shaped ribs on turbulent flow and structures in a square duct.

Figure 21. Contours of JPDF of  $u'/u_{rms}$ and
  $v'/v_{rms}$ at three different relative streamwise locations
  $(x'_{ref}/H=2.0, 4.0$ and 7.0) in the central vertical plane located at
  $z/H=0.0$. The comparison of the two ribbed flow cases is conducted at the elevation that is slightly above the rib crest (with the reference points being identical to those used in figure 20). Contours vary with incremental JPDF value of 0.0035. Panels (a), (b) and (c) correspond to the inclined rib case, and panels (d), (e) and ( f) correspond to the V-shaped rib case. In panels
  $(\textit {a})$ and
  $(d)$, the relative streamwise coordinate of the reference point is
  $x'_{ref}/H=2.0$; in panels
  $(\textit {b})$ and
  $(e)$, the relative streamwise coordinate of the reference point is
  $x'_{ref}/H=4.5$; and in panels
  $(c)$ and
  $(f)$, the relative streamwise coordinate of the reference point is
  $x'_{ref}/H=7.0$.
To refine our study of the effects of rib geometry on the temporal scales of turbulent flow structures, premultiplied energy spectra of streamwise velocity fluctuations (i.e.  $fE_{uu}/\langle {u'u'}\rangle$) are plotted in figure 22 at two different relative streamwise locations for both rib cases. The relative streamwise coordinates of the two reference points are
  $x'_{ref}/H=2.0$ and 7.0, while the vertical coordinate of the reference point is fixed at
  $y_{ref}/H=-3.8$. From figure 22 it is seen that in the lee of the rib (at
  $x'_{ref}/H=2.0$), the temporal scale of turbulence structures is larger than that in the windward of the rib (at
  $x'_{ref}/H=7.0$) in both ribbed duct cases. More specifically, the mode of
  $fE_{uu}/\langle {u'u'}\rangle$ (as indicated by the vertical dashed lines ‘
 $a_1$’ and ‘
 $a_2$’ in figure 22) decreases by 15 % and 9 % as
  $x'/H$ increases from 2.0 to 7.0 in the inclined and V-shaped ribbed duct cases, respectively. The reason that both spatial and temporal scales of turbulence structures are larger in the lee of a rib (see figures 2 and 22, respectively) is that the strength of the secondary flows (as a result of rib geometry and peripheral confinement of the duct) is stronger near the windward face of the rib (at
  $x'_{ref}/H=7.0$) than that near the leeward face of the rib (at
  $x'_{ref}/H=2.0$). This consequently leads to a stronger interaction of the upstream turbulence structures with the rib elements (see figure 5), causing the breaking down of the vortical streaks. By comparing figures 2 and 22, it is understood that both spatial and temporal scales of turbulence at
  $x'_{ref}/H=2.0$ are larger than those at
  $x'_{ref}/H=7.0$ for both ribbed duct cases. By comparing figure 22(a) with 22(b), it is apparent that the temporal scale of turbulent eddies in the inclined rib case is slightly larger than that in the V-shaped rib case (given the identical side length
  $D$ of the square duct). For example, at a reference point near the leeward face of a rib (at
  $x'_{ref}/H=2.0$), the mode of
  $fE_{ii}/\langle {u'u'}\rangle$ corresponds to a non-dimensional temporal scale of
  $t_c=1/St \approx 1.37$ in the inclined rib case, whereas
  $t_c \approx 1.14$ in the V-shaped rib case. Here,
  $St=f\delta /U_b$ is the Strouhal number.

Figure 22. Comparison of the premultiplied temporal energy spectra,  $fE_{uu}/\langle {u'u'}\rangle$, of streamwise velocity fluctuations for the two rib cases. (a) Inclined rib case and (b) V-shaped rib case. The relative streamwise coordinate of the reference points are
  $x'_{ref}/H= 2.0$ and
  $7.0$, while the vertical coordinate of the reference point is fixed at
  $y_{ref}/H=-3.8$. The red vertical dashed lines ‘
 $a_1$’ and ‘
 $a_2$’ demarcate the modes of the premultiplied energy spectra.
In view of the fact that turbulence structures in a 3-D ribbed duct undergo significant changes in both patterns and sizes due to the presence of the ribs and appearance of the cross-stream secondary flows, it is worthwhile to investigate the rib geometry effects on the streamwise streaky structures in this peripherally confined duct space. To this purpose, contours of non-dimensionalized instantaneous streamwise velocity fluctuations  $u'/U_b$ are plotted in figure 23 in the (
 $x$–
$x$– $z$) plane located at
  $y/H=-3.8$ for both rib cases. From figure 23(a) it is evident that owing to the inclination angle of the ribs and the circular movement of the secondary flow in the cross-stream directions (see figures 7a and 19a), the streaky structures in regions slightly above the rib crest are advected from one side of the duct (at
  $z/H=5.0$) to the other side of the duct (at
  $z/H=-5.0$). As a result, the streaky structures in the inclined rib case tend to concentrate near the vertical sidewall at
  $z/H=-5.0$ and no apparent streaky structures are observed at
  $z/H=5.0$, a conclusion that is consistent with qualitative results shown previously in figure 18(a). By contrast, as shown in figure 23(b), the streaky structures in the V-shaped rib case are mainly populated in regions near two vertical sidewalls due to sharp-angled ribs and the presence of symmetrical streamwise-elongated vortices in the cross-stream plane (see figures 7b and 19b). From figure 23(b) it is also observed that the magnitude of
  $u'/U_b$ in the V-shaped rib case is greatly suppressed in the inter-rib region in the duct centre (for
  $-2.5< z/H<2.5$), which further leads to a reduction in the magnitudes of Reynolds shear stresses and TKE production rate (see figures 14b and 17b).

Figure 23. Contours of non-dimensionalized instantaneous streamwise velocity fluctuations  ${{u}'}/{U}_{b}$ in the (
 $x$–
$x$– $z$) plane for the two rib cases at the elevation that is slightly above the rib crest for
  $y/H=-3.8$ (the vertical coordinate of the reference point is identical to that used in figure 20). (a) Inclined rib case and (b) V-shaped rib case.
Figure 24 shows the contours of the 2-D two-point auto-correlation of streamwise velocity fluctuations ( $R_{uu}$) in the (
 $x$–
$x$– $z$) plane of three different relative streamwise positions (
 $x'_{ref}/H=2.0, 4.5$ and 7.0) for the two rib cases. The results are obtained at the same reference points as in figure 20. From figure 24 it is evident that the characteristic correlation widths and structure angles based on streamwise velocity fluctuations are influenced significantly by the complex geometry of the domain and secondary flows. Figure 24(a–c) clearly indicate that in the inclined rib case, the characteristic inclination angle of the contours
  $R_{uu}$ decreases from
  $\beta =13.7^\circ$ to
  $4.5^\circ$ as
  $x'_{ref}/H$ increases from 2.0 to 7.0, reflecting the fact that turbulence structures are inclined towards not only the streamwise direction (see figure 20a) but also the spanwise direction. By contrast, as is shown in figure 24(d–f), the contours pattern of
  $R_{uu}$ in the V-shaped rib case are well elongated in the streamwise direction without any deflection towards the spanwise direction (such that
  $\beta \equiv 0^\circ$) for all three reference points. By comparing figure 24(a–c) with figure 24(d– f), it is evident that the spanwise characteristic size of streaks of the V-shaped rib case is larger than that of the inclined rib case.

Figure 24. Contours of the two-point auto-correlation of streamwise velocity fluctuations  $R_{uu}$ calculated at three reference points of different streamwise positions and a common elevation of
  $y_{ref}/H=-3.8$ in the central vertical plane located at
  $z/H=0.0$. The superimposed dashed-dotted line corresponds to
  $R_{uu}=0.4$. Panels (a), (b) and (c) correspond to the inclined rib case, and panels (d), (e) and ( f) correspond to the V-shaped rib case. In panels
  $(\textit {a})$ and
  $(d)$, the relative streamwise coordinate of the reference point is
  $x'_{ref}/H=2.0$; in panels
  $(\textit {b})$ and
  $(e)$, the relative streamwise coordinate of the reference point is
  $x'_{ref}/H=4.5$; and in panels
  $(c)$ and
  $(f)$, the relative streamwise coordinate of the reference point is
  $x'_{ref}/H=7.0$.
In order to refine our study of turbulent flow structures, the spanwise one-dimensional two-point auto-correlation of the vertical velocity fluctuation ( $R_{vv}$) is plotted in figure 25 at three different relative streamwise locations (for
  $x'_{ref}/H=2.0, 4.5$ and 7.0) for the two rib cases. The vertical coordinate of the reference point is fixed at
  $y_{ref}/H=-3.8$. From figure 25 it is evident that the profile of
  $R_{vv}$ is asymmetrical in the spanwise direction in the inclined rib case, but symmetrical in the V-shaped rib case at all three relative streamwise locations of
  $x'/H=2.0, 4.5$ and 7.0. As shown in figure 25(a), the half characteristic spanwise scale (or, ‘diameter’) of the streaky structures (as inferred from the position of the negatively valued peak of
  $R_{vv}$) in the inclined rib case is
  $|{\rm \Delta} z/H|=1.4$ in one-half of the duct (from
  $z/H=-5.0$ to 0.0) at all three streamwise locations. However, in the other half of the duct (from
  $z/H=0.0$ to 5.0), the diameter of the streaky structure increases monotonically from
  $|{\rm \Delta} z/H|=1.05$ to 2.5 as
  $x'/H$ increases from 2.0 to 7.0. As is clear from figure 25(b), the profile of
  $R_{vv}$ in the V-shaped rib case also exhibits a monotonic trend and the diameter of streamwise streaks increases monotonically from
  $|{\rm \Delta} z/H|=1.35$ to 2.6 as the
  $x'/H$ increases from 2.0 to 7.0. From figure 25 it is concluded that both the inclined and V-shaped rib elements have a deep impact not only on the size of turbulence structures (see figures 20 and 24) but also on the diameter of streamwise vortices in a square duct.

Figure 25. Spanwise profiles of the two-point auto-correlation of vertical velocity fluctuations ( $R_{vv}$) at three different relative streamwise locations (
 $x'_{ref}/H=2.0, 4.5$ and 7.0) for the two rib cases. The vertical coordinate of the reference point is fixed at
  $y_{ref}/H=-3.8$, as in figure 20. (a) Inclined rib case and (b) V-shaped rib case.
5. Conclusions
Direct numerical simulations are conducted to study the effects of rib geometry on the turbulent flow field confined within a square duct. This research is carried out with the background that although there are many numerical and experimental studies focusing on turbulent flows in either smooth or transverse rib-roughened ducts, much less is documented on turbulent flows in a duct with inclined and V-shaped ribs in the current literature. Furthermore, a DNS study of inclined and V-shaped ribbed duct flows is still lacking. In contrast to the conventional 2-D rough-wall boundary-layer flow with transverse ribs mounted on a flat plate, the turbulent flow in either an inclined or a V-shaped ribbed duct studied here is statistically inhomogeneous in all three directions, influenced by not only the rib elements but also the four duct sidewalls.
Although both inclined and V-shaped rib elements exert strong disturbances to the flow field, their effects are considerably different in terms of the mean streamwise and vertical velocities, mean and turbulent secondary flows, the pressure and viscous drag coefficients, Reynolds stresses, budget balance of TKE, coherent flow structures, as well as the spatial and temporal characteristic scales of turbulence. The Reynolds number based on the bulk mean velocity is fixed at  $Re_b=7000$ for both ribbed duct cases, while the Reynolds number based on the mean streamwise wall friction velocity of the ribbed bottom wall is
  $Re_{\tau R}=642$ and 1294 for the inclined and V-shaped rib cases, respectively. In the inclined ribbed duct case no apparent separation bubbles are present at the square duct midspan in the near-wall region below the rib height, and the highest streamwise momentum level as indicated by the magnitude of
  $\langle u\rangle /U_b$ appears in regions well above the rib crest (for
  $y/H>-3.7$). However, in the V-shaped ribbed duct case a large single separation bubble exists in the inter-rib region below the rib height, and the maximum value of
  $\langle u\rangle /U_b$ occurs near the rib crest. Owing to the confinement of the four sidewalls of the duct, secondary flows appear as large longitudinal vortices in the cross-stream plane in both inclined and V-shaped rib cases. It is observed that secondary flow in the inclined rib case appears as only one large streamwise-elongated vortex in the entire cross-stream plane, however, in the V-shaped rib case it develops into a pair of large symmetrical counter-rotating vortices. Furthermore, given the same bulk Reynolds number tested, the pressure drag in the V-shaped rib case is approximately twice that in the inclined rib case, resulting in a drastic increase in the value of the friction velocity
  $u_{\tau R}$ on the ribbed bottom wall. Although the mean flow pattern exhibited in the V-shaped ribbed duct is almost a pair of mirror reflections of that of the inclined rib case in the (
 $x$–
$x$– $z$) plane, it should not be regarded that there is a linear relationship in statistical moments and any similarity in turbulence structures between these two ribbed duct flows. The effects of the sidewalls on flow statistics and structures are significantly different in these two ribbed duct cases.
Investigations into the Reynolds normal and shear stress components indicate that the highest turbulence levels in the inclined rib case appear in the region slightly above the rib crest. This enhancement in the magnitude of the Reynolds stresses immediately downstream of the rib crest is a result of the occurrence of the boundary-layer separation near the leading edge of the rib, which also produces strong spanwise vortex shedding. However, in the V-shaped case the strongest turbulent levels occur in the inter-rib region (below the rib height) in the lee of the ribs. This is due to the negative values of  $\langle v\rangle /U_b$ induced by the secondary flows, which result in a downwash of high momentum flow from the duct centre to the ribbed wall. Owing to the difference of the rib geometries and associated secondary flow patterns, the cross-stream distribution of Reynolds stresses in the inclined rib case is significantly different from that in the V-shaped rib case. It is observed that the magnitudes of the three normal components in the inclined rib case are comparable in value near the sidewall located at
  $z/H=-5.0$, while they are significantly different near the other sidewall located at
  $z/H=5.0$. As such, in the inclined rib case turbulence tends to be locally isotropic and anisotropic near the two vertical sidewalls (located at
  $z/H=-5.0$ and 5.0), respectively. By contrast, in the V-shaped ribbed duct case it is seen that near the two vertical sidewalls, the magnitude of
  ${{{\langle {{w}'{w}'}\rangle }}}$ is larger than those of
  ${{{\langle {{u}'{u}'}\rangle }}}$ and
  ${{{\langle {{v}'{v}'}\rangle }}}$.
Through an analysis of the TKE budget terms, it is found that the turbulence energy transfer in the vertical direction is sensitive to the rib geometry, as the TKE budget terms of these two rib cases are not only different in values but also dissimilar in their profile patterns. It is seen that for the inclined rib case, the budget balance of TKE in the inter-rib region (for  $-5.0< y/H<-4.5$) is dominated by viscous diffusion
  $D_k$ and turbulence diffusion
  $T_k$ as the source terms; and by convection
  $C_k$, production
  $P_k$ and dissipation
  $\varepsilon _k$ as the sink terms. However, the TKE budget in the V-shaped rib case is primarily balanced between the viscous diffusion and dissipation terms (i.e.
  $D_k$ and
  $\varepsilon _k$) as the source and sink terms, respectively, in the region very close to the ribbed bottom wall (for
  $-5.0< y/H<-4.7$).
The effects of rib geometry on the scales and dynamics of coherent structures are investigated through an analysis of the  $\lambda _{ci}$-criterion, spatial two-point auto-correlations of the turbulence field, JPDF of the streamwise and vertical velocity fluctuations and premultiplied energy spectra. It is observed that in the inclined rib case the energetic vortical structures are deflected towards only one side of the duct (located at
  $z/H=-5.0$), where the secondary flow motion pushes the fluid to move upward. However, in the V-shaped rib case turbulence structures divert from the duct centre sideways towards both vertical sidewalls (located at
  $z/H=\pm 5.0$), and as a result, a significant fraction of the vortical structures are concentrated near the two sidewalls. Based on an analysis of the 2-D spatial two-point auto-correlation function of velocity fluctuations, it is seen that near the leeward and windward faces of a rib (at
  $x'_{ref}/H=2.0$ and 7.0. respectively), the inclination angle
  $\alpha$ of the V-shaped rib case is greater than that of the inclined rib case, leading to an increase in the communication between the flow near the ribbed bottom wall and that near the smooth top wall. Furthermore, based on an analysis of the non-dimensionalized streamwise premultiplied temporal spectrum
  $f E_{ii}/\langle u'u'\rangle$ of velocity fluctuations, it is observed that the mode of
  $fE_{uu}/\langle {u'u'}\rangle$ decreases by 15 % and 9 % as
  $x'/H$ increases from 2.0 to 7.0 for the inclined and V-shaped ribbed duct cases, respectively.
The study of spatial two-point auto-correlations in the streamwise–spanwise plane indicates that turbulence structures in the inclined rib case are considerably different from those in the V-shaped rib case in terms of their characteristic width and diameter. Specifically, in the inclined rib case, the characteristic inclination angle of the contours  $R_{uu}$ decreases from
  $\beta =13.7^\circ$ to
  $4.5^\circ$ as the
  $x'_{ref}/H$ increases from 2.0 to 7.0, reflecting the fact that turbulence structures are inclined towards not only the streamwise direction but also the spanwise direction. By contrast, in the V-shaped rib case the contours pattern of
  $R_{uu}$ are well elongated in the streamwise direction without any deflection towards the spanwise direction (such that
  $\beta \equiv 0^\circ$) for all three reference points.
Finally, it should be indicated that in this research we are motivated to conduct a detailed DNS study of inclined and V-shaped ribbed duct flows to fill the gap of literature. As the first step, our focus is on developing a fundamental understanding of the flow physics and coherent structures of these two ribbed square duct flows. Admittedly, this work has limitations, mainly because the DNS was carried out based on fixed values of the Reynolds number  $Re_b$, rib alignment angle, blockage ratio (
 $H/D$), pitch-to-height ratio (
 $P/H$), rib width-to-pitch ratio and aspect ratio of the duct (
 $L_y/L_z$). Indeed, these are all important parameters and need to be explored in future studies. Furthermore, owing to the absence of spanwise homogeneity, both inclined and V-shaped ribbed duct flows are intrinsically three dimensional, and are computationally more intensive in DNS compared with the conventional 2-D rib-roughened boundary-layer flows over a flat plate. In this research we have focused our attention on the fluid dynamics of the inclined and V-shaped ribbed duct flows. The application of the knowledge gained through this research to a DNS study of turbulent heat transfer in these ribbed duct flows (as in Mahmoodi-Jezeh & Wang (Reference Mahmoodi-Jezeh and Wang2021), for studying heat convection in a square duct with straight transverse ribs mounted on one wall) represents another interesting extension of the current research effort. Therefore, as a moderate or long term objective, collective efforts with also possible contributions from other research groups based on numerical and experimental approaches will be needed in order to develop a systematic knowledge of the subject.
Acknowledgements
The authors would like to thank Western Canada Research Grid (WestGrid) for access to supercomputing and storage facilities.
Funding
Research funding from Natural Sciences and Engineering Research Council (NSERC) of Canada to B.-C.W. is gratefully acknowledged.
Declaration of interest
The authors report no conflict of interest.


