


The menopause transition (a.k.a. perimenopause) represents the 5–6-year reproductive stage transitioning from ovulatory menstrual cycles to the complete cessation of menstruation, which marks the onset of menopause (Avis & McKinlay, Reference Avis and McKinlay1995; Oldenhave, Jaszmann, Haspels, & Everaerd, Reference Oldenhave, Jaszmann, Haspels and Everaerd1993; Treloar, Reference Treloar1981). Multiple studies have identified this transition period as a time of increased vulnerability for depressive mood, with longitudinal studies pointing to a 1.3–2.9-fold increased risk (Maki et al., Reference Maki, Kornstein, Joffe, Bromberger, Freeman, Athappilly and Soares2019). In contrast, only two longitudinal studies have examined the development of major depressive episodes (MDEs), assessed via a structured clinical interview, in relation to a reproductive stage (Bromberger et al., Reference Bromberger, Kravitz, Matthews, Youk, Brown and Feng2009, Reference Bromberger, Schott, Kravitz and Joffe2015): although these studies suggest that women with a history of major depressive disorder do exhibit an increased risk of relapse in the menopause transition relative to premenopausal levels, it remains unclear whether the risk of major depression is also increased among women without a history of depression.
Underlying the appearance of irregular menstruation, marking the onset of the menopause transition, are several hormonal changes that are triggered by an age-related decline in the number of ovarian follicles, resulting in decreased negative feedback through the hypothalamic-pituitary-gonadal axis and temporary increases in follicle stimulating hormone (FSH) (Gordon et al., Reference Gordon, Girdler, Meltzer-Brody, Stika, Thurston, Clark and Wisner2015). Menstrual cycles that are characterized by luteal estradiol levels up to 2–3 times higher than those typically seen in reproductive-aged women, begin to appear in the early menopause transition and continue into the late transition (Hale & Burger, Reference Hale and Burger2009; Hale et al., Reference Hale, Zhao, Hughes, Burger, Robertson and Fraser2007). At the same time, likely due to low antral follicle numbers, perimenopausal estradiol levels have also been shown to occasionally dip to postmenopausal levels (Shideler, DeVane, Kalra, Benirschke, & Lasley, Reference Shideler, DeVane, Kalra, Benirschke and Lasley1989). Furthermore, the low-estradiol early follicular phase lengthens due to a delayed ovarian response to FSH, resulting in a longer cycle (Miro et al., Reference Miro, Parker, Aspinall, Coley, Perry and Ellis2004).
Increased sensitivity to this shifting hormonal environment has long been suspected to be a key etiological factor in the development of perimenopausal depressive symptoms (Rubinow, Schmidt, & Roca, Reference Rubinow, Schmidt and Roca1998). However, the extent to which perimenopausal depression is related to hypo- v. hyper-estrogenism sensitivity remains unclear. One seminal study by Schmidt and colleagues (Schmidt et al., Reference Schmidt, Ben, Martinez, Guerrieri, Harsh, Thompson and Rubinow2015) found that experimentally inducing estradiol withdrawal triggered depressive symptoms among women selected based on their personal history of depression that had been responsive to hormone therapy; in contrast, this effect was not seen in the women who did not have a history of depression (with perimenopausal onset or otherwise). While this study suggests that a subset of women is mood-sensitive to perimenopausal estradiol withdrawal, it does not rule out the possibility that increased sensitivity to estradiol surges also contribute to perimenopausal depressive symptoms in some women. After all, experimentally-induced increases in estradiol (with or without concomitant increases in progesterone) have been shown to induce negative affect among women with a diagnosis of premenstrual dysphoric disorder (Schmidt et al., Reference Schmidt, Martinez, Nieman, Koziol, Thompson, Schenkel and Rubinow2017; Schmidt, Nieman, Danaceau, Adams, & Rubinow, Reference Schmidt, Nieman, Danaceau, Adams and Rubinow1998). Furthermore, in a small study comparing within-person effects of salivary estradiol on mood across 4 weekly measurements, we found that women with current perimenopausal depression exhibited greater sensitivity to weekly increases in estradiol compared to non-depressed women (Gordon, Eisenlohr-Moul, Rubinow, Schrubbe, & Girdler, Reference Gordon, Eisenlohr-Moul, Rubinow, Schrubbe and Girdler2016a). Thus, there is reason to believe that while estradiol withdrawal is a trigger for depressive mood in some perimenopausal women, others may develop depressive symptoms as a result of increased sensitivity to elevations in estradiol, and still others may be sensitive to estradiol changes in both directions. However, this hypothesis remains to be tested.
The current manuscript reports the findings of the fluctuating estrogen and menopausal mood (FEMM) study, which aimed to investigate individual differences in the relationship between mood and estrone-3-glucuronide (E1G), a urinary metabolite of estradiol, in a community sample of perimenopausal women and to examine the importance of these individual differences in predicting the occurrence of depressive symptoms and diagnoses of MDEs. It also aimed to examine potential baseline characteristics that might modify the extent to which this relationship would translate into depressive symptoms, including depression history, baseline stressful life events, and progression into the menopause transition.
A secondary purpose of the FEMM study was to investigate the potential role of the hypothalamic-pituitary-adrenal (HPA) axis – the primary central stress response system – in mediating within-person effects of estradiol on mood. Indeed, HPA axis dysregulation has been hypothesized to be a potential mechanism by which estradiol fluctuation may trigger perimenopausal depression in some women (Gordon et al., Reference Gordon, Girdler, Meltzer-Brody, Stika, Thurston, Clark and Wisner2015). Thus, in addition to assessments of weekly E1G and mood, concomitant assessments of the cortisol awakening response (CAR) were made in the current study.
Methods
Participants
We recruited 101 women aged 45–55 years and perimenopausal according to the Stages of Reproductive Aging Workshop (Harlow et al., Reference Harlow, Gass, Hall, Lobo, Maki, Rebar and de Villiers2012) (STRAW + 10) criteria (early perimenopause, defined as menstrual cycle length 7+ days shorter or longer than usual and late perimenopause, defined as ⩾2 skipped cycles but <1 year since the last menstrual period). Exclusion criteria included the following: (1) current psychiatric diagnosis of major depressive disorder, bipolar disorder, a psychotic disorder or any other psychiatric diagnosis rated ‘severe’ based on DSM-5 criteria; (2) current use of medications affecting mood or ovarian hormone levels; and (3) pregnant or nursing. Participants were compensated up to $250 for participating in full compliance. The study was primarily advertised through social media and flyers posted throughout the city and surrounding areas.
Study overview
The current study involved three components (Fig. 1), described in detail below.
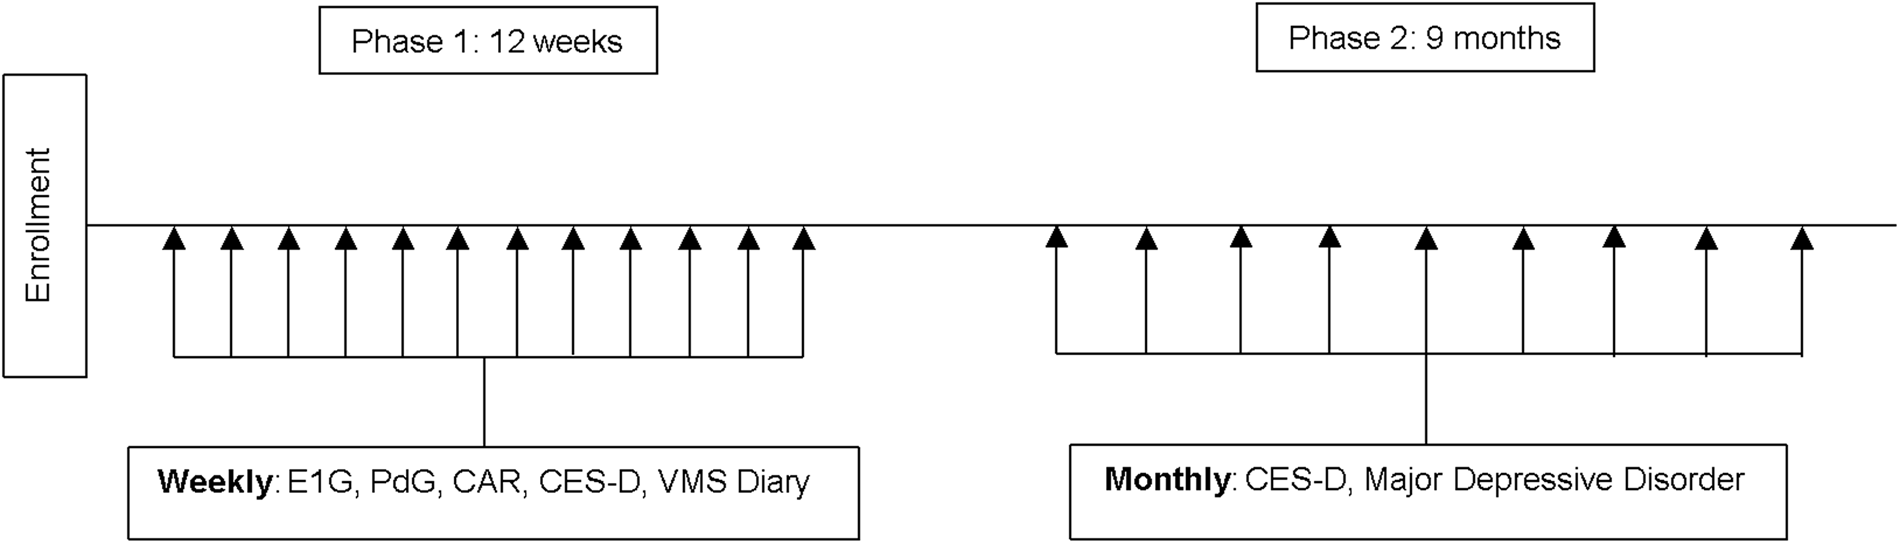
Fig. 1. Study design. E1G, estrone-3-glucuronide; PdG, pregnanediol glucuronide; CAR, cortisol awakening response; CES-D, Center for Epidemiologic Studies Depression Scale; VMS, vasomotor symptom bother.
Enrollment visit
Following informed consent, a trained research assistant measured the participant's height and weight for the calculation of the body mass index due to its possible association with estradiol levels (McTiernan et al., Reference McTiernan, Wu, Chen, Chlebowski, Mossavar-Rahmani and Modugno2006; Mongraw-Chaffin et al., Reference Mongraw-Chaffin, Anderson, Allison, Ouyang, Szklo, Vaidya and Golden2015), administered the mood and anxiety disorders modules of the Structured Clinical Interview for DSM-5 (SCID-RV) and asked about prior diagnosis of any other severe psychiatric disorders. Eligible participants were asked to complete an electronic version of a number of questionnaires, described below.
Measures. Demographic and Medical Information including age, race, marital status, years of education, income, occupation, medications, and reproductive history, were assessed, including a detailed description of their menstrual bleeding patterns in the last 12 months.
Depressive symptoms were assessed using the Center for Epidemiologic Studies-Depression (CES-D) Scale, a 20-item self-report form that asks about the frequency of depressive symptoms during the previous week on a 4-point scale of 0 (rarely) to 3 (most or all of the time) (Radloff, Reference Radloff1977). A score of ⩾16 is commonly used as a cutoff for identifying potential clinical depression (Boyd, Weissman, Thompson, & Myers, Reference Boyd, Weissman, Thompson and Myers1982) and is predictive of major depression (Thomas, Jones, Scarinci, Mehan, & Brantley, Reference Thomas, Jones, Scarinci, Mehan and Brantley2001).
Recent stressful life events during the 6 months before the baseline assessment were measured using the life events survey (Sarason & Johnson, Reference Sarason and Johnson1976; Sarason, Johnson, & Siegel, Reference Sarason, Johnson and Siegel1978), modified to include only those events that are considered moderate to severely stressful based on previous studies with interviewer-based objectively rated stresses (e.g. death of a close loved one, severe financial hardship, chronically long work hours) (Leserman et al., Reference Leserman, Petitto, Perkins, Folds, Golden and Evans1997; Leserman et al., Reference Leserman, Petitto, Gu, Gaynes, Barroso, Golden and Evans2002; Leserman, Ironson, O'Cleirigh, Fordiani, & Balbin, Reference Leserman, Ironson, O'Cleirigh, Fordiani and Balbin2008).
Vasomotor symptom bother was measured using items 19 and 20 of the Greene Climacteric Scale (Greene, Reference Greene2008), a self-report form that asks the participant to rate the extent to which they currently suffer from 21 menopausal symptoms (e.g. hot flashes) on a 4-point scale from ‘not at all’ to ‘extremely’ (Alder, Bancroft, & Livingstone, Reference Alder, Bancroft and Livingstone1992; Derman, Dawood, & Stone, Reference Derman, Dawood and Stone1994; Schneider, MacLennan, & Feeny, Reference Schneider, MacLennan and Feeny2008). The average of these two items provided an overall ‘vasomotor symptom (VMS) bother’ score.
History of trauma was measured using the Trauma History Questionnaire, a 24-item self-report survey designed to detect experiences of a wide variety of traumatic life events, such as those related to crime, disaster, and physical or sexual abuse (Hooper, Stockton, Krupnick, & Green, Reference Hooper, Stockton, Krupnick and Green2011).
Study phase 1
Weekly mood assessment. Once weekly for 12 weeks (on a consistent day of their choosing), participants completed an electronic version of the CES-D and reported current vasomotor symptom bother.
Cortisol awakening response. On the day of weekly mood assessment, participants collected two 2-ml saliva samples upon waking and 30 min post-waking for the measurement of the CAR, taking note of their precise wakeup time and time of sample collection. The samples were stored in the participant's home freezer until study Phase 1 was complete, at which point they were shipped to the university to be stored at −40 °C until assayed.
Reproductive hormones. The morning following each weekly mood assessment, participants collected 4 ml of their first-morning voided urine for the measurement of both E1G and pregnanediol glucuronide (PdG), which are urinary metabolites of estradiol and progesterone, respectively. At the end of Study Phase 1, samples were mailed to the university via a same-day courier service and frozen at −40 °C until assayed. These metabolites have been shown to correlate very highly (rs = 0.93–0.97) (O'Connor et al., Reference O'Connor, Brindle, Holman, Klein, Soules, Campbell and Wood2003) with serum levels of estradiol and progesterone measured 1 day prior to urine collection. In other words, first-morning urine levels of E1G and PdG reflect an integrated measure of the overall hormone levels from the previous day. For this reason, urine collection occurred the morning following the completion of the CES-D. E1G and PdG were chosen over salivary estradiol and progesterone in light of research suggesting that salivary reproductive hormone levels correlate poorly with serum levels at low levels (Tivis, Richardson, Peddi, & Arjmandi, Reference Tivis, Richardson, Peddi and Arjmandi2005), which perimenopausal women may periodically exhibit.
Hormonal assays. E1G, a urinary metabolite of estradiol, was assayed using an enzyme immunoassay (Arbor Assays, Ann Arbor, MI), with sensitivity at <22.5 pg/ml. The intraassay coefficient of variation was 5.1% and the interassay coefficient of variation was 14.8%. PdG was also assayed using an enzyme immunoassay (Arbor Assays, Ann Arbor, MI), with sensitivity at <0.180 ng/ml. The intraassay coefficient of variation was 9.1% and the interassay coefficient of variation was also 9.1%. To account for differences in urine concentration, E1G and PdG levels were adjusted for specific gravity using the formula recommended by O'Connor et al. (Reference O'Connor, Brindle, Holman, Klein, Soules, Campbell and Wood2003). Cortisol was assayed using a commercially available ELISA kit (Salimetrics), with sensitivity <0.007 μg/dl. The intra-assay variability was 4.0% and the inter-assay variability was 13.6%.
Study Phase 2
Every month for 9 months, participants were emailed a link to an electronic version of the CES-D. When a participant obtained a score of 16 or above, considered to be an elevation to ‘clinically significant’ symptom levels, a research assistant followed up with the participant to administer the mood module of the SCID-5 over the phone to assess for the presence of major depression. Participants meeting diagnostic criteria were provided information about mental health resources available in the community but continued to participate in the FEMM study.
Statistical analysis plan and sample size calculations
Phase 1 analyses
A two-level multilevel regression model (with repeated weekly observations nested within women) using PROC MIXED in SAS 9.4 examined the overall relationship between weekly person-centered E1G levels (that is, an individual's mean E1G level over 12 weeks was subtracted from each weekly E1G level such that a negative value indicates a level that is lower than that individual's average and a positive value indicates one that is higher than their average). A first-order autoregressive covariance structure for within-person error was applied, and the Kenward–Rogers correction was used to calculate the appropriate degrees of freedom. Because we hypothesized individual differences in the extent to which E1G influences outcomes, person-centered E1G was specified as a random effect. PdG levels and weekly vasomotor symptom bother were considered as potential covariates.
A number of additional analyses were performed to help quantify the strength and direction of each participant's E1G-mood relationship, resulting in a number of sensitivity coefficients described in Table 1. E1G mood sensitivity strength was to be the primary predictor of outcomes in Phase 2. Although all available data was submitted to the within-person analyses described above, sensitivity coefficients were not calculated for participants with six E1G/mood pairs or fewer in order to avoid creating invalid coefficients based on too-few pairs.
Table 1. Variable definitions

a For example, a participant with an E1G-CES-D correlation of −0.20 and an absE1G-CES-D correlation of +0.50 would have an E1G mood sensitivity strength value of 0.50. Conversely, a participant with an E1G-CES-D correlation of +0.10 and an absE1G-CES-D correlation of −0.70 would have an E1G mood sensitivity strength value of 0.70.
In line with our predetermined study methodology, only continuous E1G sensitivity strength was used as a predictor of Phase 2 outcomes; however, post hoc, it was reasoned that defining ‘sensitivity profiles’ using the strength and direction of the three indicators of E1G sensitivity would be useful in illustrating the enormous individual variability in responses to E1G. Using an r ⩾ 0.3 to identify moderate-to-large correlations, as per Cohen's recommendation (Cohen, Reference Cohen1992), the definitions of these profiles are indicated in Table 1. The decision to define these four profiles is based on our proposed etiological model of perimenopausal depression [described in Gordon et al. (Reference Gordon, Girdler, Meltzer-Brody, Stika, Thurston, Clark and Wisner2015)] that suggests a neurobiological mechanism by which all four profiles would theoretically exist.
Finally, in order to address the secondary goal of examining the etiological role that the HPA axis might play in mediating the effects of hormonal flux on mood, all hormone sensitivity indicators described in Table 1 were recalculated, replacing the CES-D score with weekly CAR: E1G-CAR correlation, absE1G-CAR correlation, and E1G-CAR sensitivity strength. This latter variable was to be used as a predictor of Phase 2 outcomes.
Phase 2 analyses
E1G mood sensitivity strength and E1G CAR sensitivity strength were then examined as a predictor of two Phase 2 outcomes: continuous CES-D score assessed monthly and whether or not diagnostic criteria for major depressive disorder were ever met. Specifically, PROC MIXED in SAS 9.4 for mixed models examined this index as a predictor of the continuous CES-D score while logistic regression was used to examine this index as a predictor of the development of a major depressive episode. To test for potential moderating effects, an interaction term characterizing the interaction between E1G mood sensitivity strength and the moderating variable of interest was added as a predictor in the analyses described above. Potential moderators of interest included baseline number of stressful life events, past history of major depressive disorder, and number of months since last menstrual period as a measure of progression into the menopause transition, all of which have been found to predict perimenopausal depression development or to interact with estradiol fluctuation to predict depressive symptoms (Gordon et al., Reference Gordon, Girdler, Meltzer-Brody, Stika, Thurston, Clark and Wisner2015; Gordon et al., Reference Gordon, Eisenlohr-Moul, Rubinow, Schrubbe and Girdler2016a; Gordon et al., Reference Gordon, Rubinow, Eisenlohr-Moul, Xia, Schmidt and Girdler2018; Gordon, Rubinow, Eisenlohr-Moul, Leserman, & Girdler, Reference Gordon, Rubinow, Eisenlohr-Moul, Leserman and Girdler2016b). The number of months since last menstrual period was used over STRAW stage because the overwhelming majority of participants were in the late menopause transition, limiting our statistical power to detect a significant stage effect. In order to account for multiple comparisons, the Benjamin and Hochberg false discovery rate correction was applied to all analyses (Benjamini, Reference Benjamini2010; Benjamini & Hochberg, Reference Benjamini and Hochberg1995).
Sample size calculations
Using G*Power, this study was powered to detect an effect of E1G sensitivity strength measured in Phase 1 to predict the occurrence of an MDE in Phase 2, assuming a base rate of 15%. It was determined that a sample size of 86 would give us 80% power, with α = 0.05, to detect a 15% increased risk among women who are 1 standard deviation above the mean E1G strength sensitivity (to 30%), reasoned to be the smallest clinically significant difference we would want to be powered to detect. To account for missing data and/or dropouts, we aimed to recruit 100 women. This sample size is sufficient to detect a small effect (f = 0.19) of E1G sensitivity strength on continuous monthly CES-D scores in Phase 2.
Results
Preliminary analyses
A total of 101 participants were enrolled in the study (Table 2). For Phase 1, each participant completed an average (out of 12) of 10.8 mood surveys, 11.6 urine samples, and 10.9 weeks of saliva samples for the measurement of the CAR. A total of 96 participants completed Phase 1 and had completed a sufficient number of surveys/urine collections to be included in the correlation analyses. For Phase 2, each participant completed an average of 8.4 (out of 9) monthly surveys. A total of 94 participants who had both Phase 1 and Phase 2 data available were included in Phase 2 analyses.
Table 2. Baseline characteristics
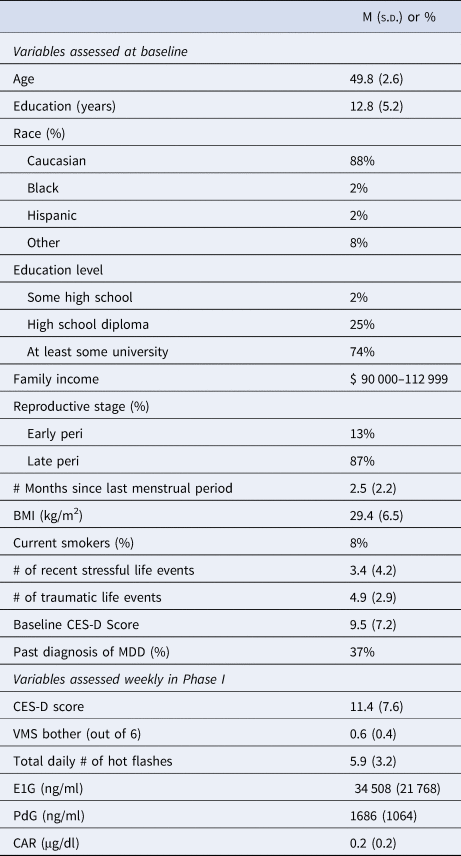
BMI, body mass index; CES-D, Center for Epidemiologic Depression Scale; MDD, major depressive disorder; VMS, vasomotor symptom bother; E1G, estrone-3-glucuronide; PdG, pregnanediol glucuronide.
Phase 1 analyses
Within-person effect of E1G on CES-D score and CAR. Applying the false discovery rate correction, linear mixed models examining the effect of person-centered E1G on the weekly CES-D score in the full participant sample revealed no significant within-person effect of E1G on mood, either in unadjusted analyses [β(s.e.) = −0.13(0.26), p = 0.610] or in models adjusting for person-centered PdG and weekly VMS bother [β(s.e.) = −0.15(0.16), p = 0.610]. Similar analyses revealed no significant effect of person-centered E1G on the CAR, either in an unadjusted model [β(s.e.) = −0.00(0.00), p = 0.610] or in an adjusted model [β(s.e.) = −0.01(0.15), p = 0.610].
Identifying E1G sensitivity categories. E1G-CES-D correlation, calculated for each individual participant, ranged from −0.87 to +0.68, with a median of −0.04; absE1G-CES-D correlation ranged from −0.74 to +0.80 (median = 0.02) and E1G sensitivity strength ranged from 0.0 to +0.87 (median = 0.20). These values were used to identify the four ‘E1G sensitivity profiles’ defined in Table 2. The prevalence of these profiles is depicted in Fig. 2a. Figure 2b uses model-based estimates to depict the relationship between person-centered E1G and weekly CES-D in each of the four E1G sensitivity groups (using estimates associated with person-centered E1G in Groups 1, 2, and 4 and person-centered absolute E1G in Group 3). None of the variables listed in Table 1 were associated with E1G sensitivity strength ps > 0.05.
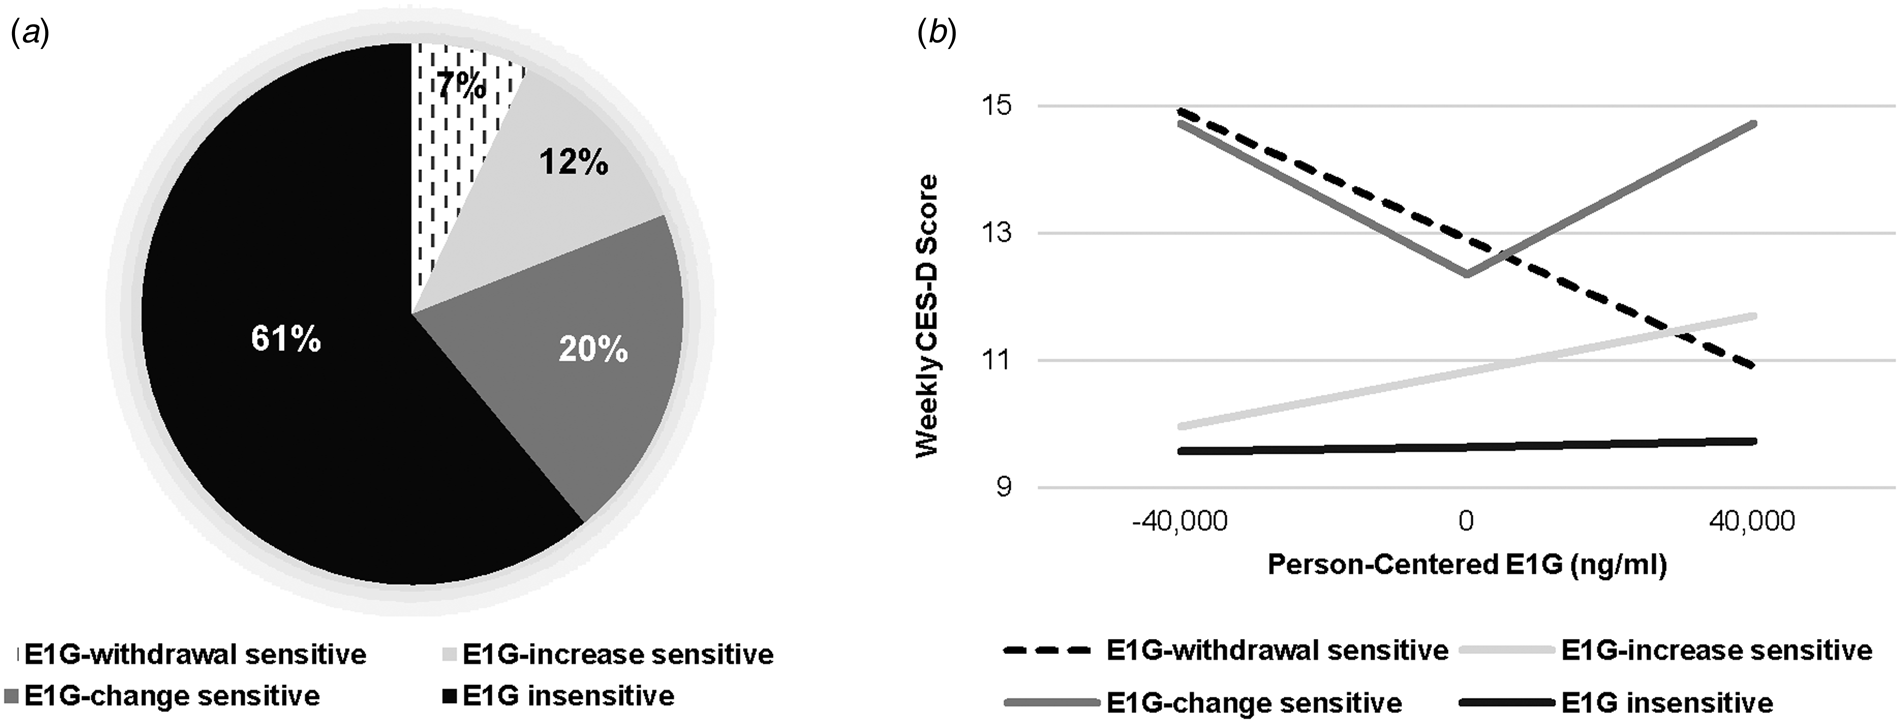
Fig. 2. (a) Participants falling into each of the E1G sensitivity groups (n = 96). (b) Model-based estimates of the relationship between weekly person-centered E1G and CES-D score among each group, adjusting for weekly PdG and vasomotor symptom bother.
Phase 2 analyses
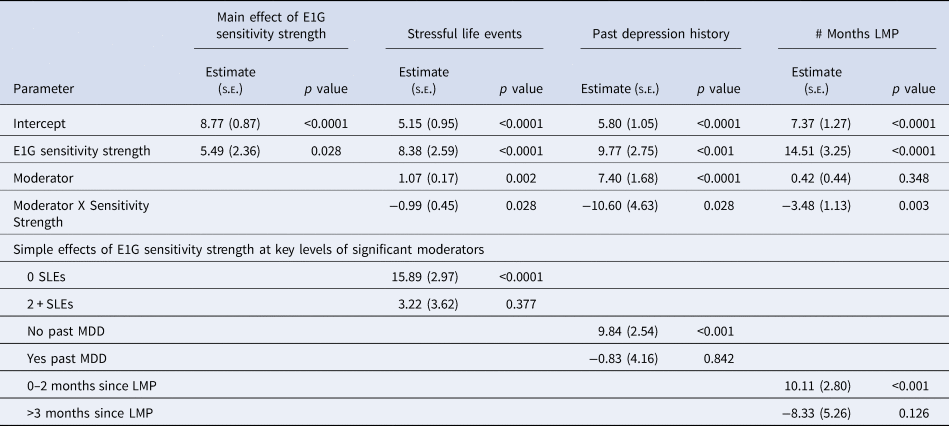
In Phase 2, 59% of women obtained an elevated score on the CES-D (⩾16) at least once and 17% of participants had at least one MDE. Of the variables listed in Table 1, baseline stressful life events [β(s.e.) = 0.80 (0.11), p < 0.05], lifetime trauma experiences [β(s.e.) = 0.80 (0.11), p < 0.001], baseline CES-D score [β(s.e.) = 0.57 (0.07), p < 0.001], past MDD [β(s.e.) = 4.30 (1.10), p < 0.001], and mean Phase 1 CES-D [β(s.e.) = 0.65 (0.05), p < 0.001] were predictive of Phase 2 CES-D scores. Only baseline stressful life events [OR (95% CI) 1.2 (1.1–1.4), p = 0.013] and mean Phase 1 CES-D score [OR (95% CI) 1.1(1.0–1.2), p = 0.013] predicted a Phase 2 MDE. As shown in Table 3, the main effect of E1G mood sensitivity strength on # of elevated CES-D scores in Phase 2 was significant but relatively small. In examining the interaction between E1G mood sensitivity strength and potential moderating variables in predicting # of elevated CES-D scores in Phase 2, three moderators emerged. Namely, E1G sensitivity strength was more predictive of depressed mood among women with fewer months since last menstrual period (Fig. 3a), among women with fewer baseline number of stressful life events (Fig. 3b), and among women without a prior history of depression (Fig. 3c).
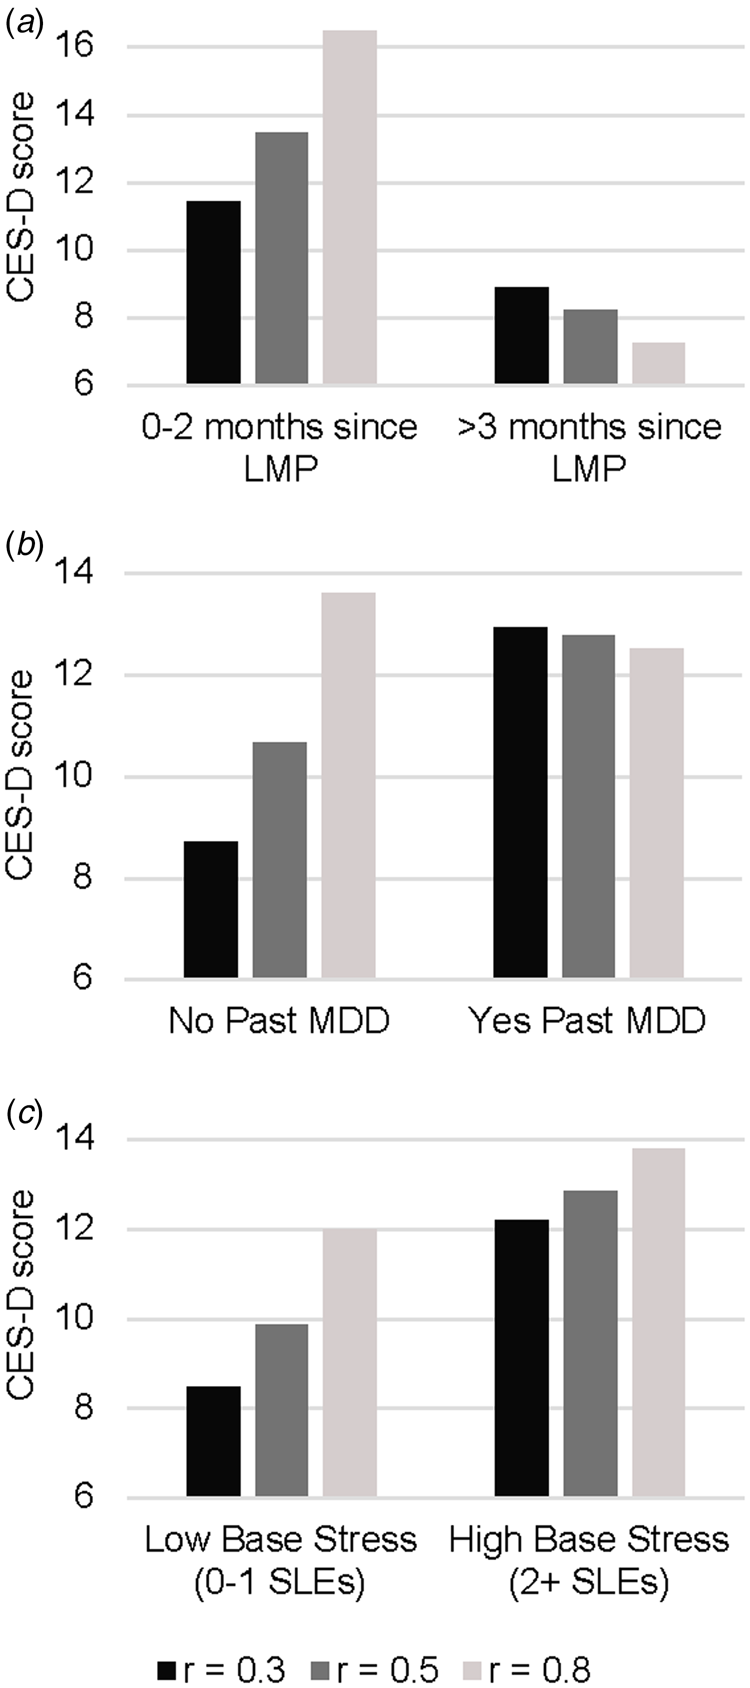
Fig. 3. Model-based estimates of the relationship between Phase 1 E1G mood sensitivity strength and continuous CES-D scores in Phase 2 among women: (a) below v. above the median months since last menstrual period (LMP), (b) women with v. without a history of major depressive disorder, and (c) women with low v. high baseline stressful life events.
Table 3. Multilevel models predicting the continuous CES-D score in Phase 2
In contrast, E1G sensitivity strength did not predict the occurrence of MDEs in Phase 2, nor did it significantly interact with baseline characteristics in predicting MDEs (ps > 0.05). Furthermore, indicators of HPA axis sensitivity to weekly fluctuation in E1G were examined as predictors of Phase 2 outcomes but no significant findings emerged: neither E1G-CAR correlation, absE1G-CAR correlation, nor E1G-CAR sensitivity strength were found to be significant predictors of either depressive symptoms or MDEs in Phase 2.
Sensitivity analyses
Effect of PdG sensitivity
PdG-CES-D correlation ranged from −0.70 to +0.88, absPdG-CES-D correlation ranged from −0.73 to 0.86, and PdG mood sensitivity strength ranged from 0.0 to 0.88. However, none of these scores were significant predictors of clinically significant depressive symptoms or MDD in Phase II, nor did these variables interact with the moderators of interest (ps > 0.05).
Discussion
The findings of the current study suggest that a significant proportion of women exhibit at least a moderate degree of mood sensitivity to endogenous estrogen changes in the menopause transition. However, the nature of the estrogen–mood relationship appears to vary greatly from woman to woman, with the largest proportion of estrogen-sensitive women exhibiting mood sensitivity to extreme estrogen levels in either direction. The degree to which the strength of this estrogen sensitivity predicts the development of depressive symptoms also varies, appearing to be stronger among women earlier in the transition (who are likely experiencing greater hormonal flux) and among women whose baseline risk for depression is relatively low. These findings may help to clarify why current studies conflict in identifying sensitivity to hypoestrogenism (Schmidt et al., Reference Schmidt, Ben, Martinez, Guerrieri, Harsh, Thompson and Rubinow2015) v. hyperestrogenism (Gordon et al., Reference Gordon, Eisenlohr-Moul, Rubinow, Schrubbe and Girdler2016a) as being etiologically relevant to perimenopausal depression, and why many studies fail to observe any overall relationship between estrogen and perimenopausal mood (Avis, Crawford, Stellato, & Longcope, Reference Avis, Crawford, Stellato and Longcope2001; Bromberger et al., Reference Bromberger, Kravitz, Chang, Cyranowski, Brown and Matthews2011; Woods et al., Reference Woods, Smith-DiJulio, Percival, Tao, Mariella and Mitchell2008).
The prevalence of the three identified ‘estrogen-sensitive’ groups is relatively consistent with the known prevalence of other reproductive mood disorders that are thought to result from an increased sensitivity to a reproductive hormone change. For example, menstrually-related mood disorders such as premenstrual dysphoric disorder, thought to result from a hypersensitivity to postovulatory increases in reproductive hormones (Schmidt et al., Reference Schmidt, Nieman, Grover, Muller, Merriam and Rubinow1991; Schmidt et al., Reference Schmidt, Nieman, Danaceau, Adams and Rubinow1998; Wyatt, Dimmock, Ismail, Jones, & O'Brien, Reference Wyatt, Dimmock, Ismail, Jones and O'Brien2004), affect 13–19% of naturally cycling women (Halbreich, Borenstein, Pearlstein, & Kahn, Reference Halbreich, Borenstein, Pearlstein and Kahn2003; Wittchen, Becker, Lieb, & Krause, Reference Wittchen, Becker, Lieb and Krause2002). Furthermore, up to 25% of women experience significant depressive symptoms following childbirth (Gavin et al., Reference Gavin, Gaynes, Lohr, Meltzer-Brody, Gartlehner and Swinson2005; Meltzer-Brody, Boschloo, Jones, Sullivan, & Penninx, Reference Meltzer-Brody, Boschloo, Jones, Sullivan and Penninx2013), which is characterized by enormous reproductive hormone withdrawal. The fact that rates of clinically significant depressive symptoms are relatively higher in the menopause transition (affecting 45–68% of women based on previous literature (Maki et al., Reference Maki, Kornstein, Joffe, Bromberger, Freeman, Athappilly and Soares2019) and 58% in the current study) is consistent with the fact that the menopause transition is characterized by both extreme estradiol highs and lows relative to a typical menstrual cycle (see (Gordon et al., Reference Gordon, Girdler, Meltzer-Brody, Stika, Thurston, Clark and Wisner2015; Santoro & Randolph, Reference Santoro and Randolph2011; Santoro, Brown, Adel, & Skurnick, Reference Santoro, Brown, Adel and Skurnick1996) for review), thus potentially contributing to an increased risk of elevated depressive symptoms among women in all three of the ‘estrogen-sensitive’ groups.
The mechanisms by which estradiol differentially impacts mood from woman to woman remain unclear. Counter to our predictions, the within-person correlation between person-centered E1G and weekly CAR did not predict Phase 2 depressive symptoms, thus failing to support a role of the HPA axis in the development of perimenopausal depression. Further research is therefore needed to explore alternative mediating mechanisms. Withdrawal from estradiol's serotonergic (Rubinow et al., Reference Rubinow, Schmidt and Roca1998), anti-inflammatory (Vegeto, Benedusi, & Maggi, Reference Vegeto, Benedusi and Maggi2008), or neuroprotective (Chowen, Torres-Aleman, & Garcia-Segura, Reference Chowen, Torres-Aleman and Garcia-Segura1992; Woolley, Reference Woolley1998) effects may help explain how estradiol withdrawal may trigger depressive mood in a subset of women. Conversely, negative mood effects of extremely high estradiol levels may relate to estradiol's modulation of oxytocin binding (Young, Wang, Donaldson, & Rissman, Reference Young, Wang, Donaldson and Rissman1998) and release (Chiodera et al., Reference Chiodera, Volpi, Capretti, Marchesi, d'Amato, De Ferri and Coiro1991; Engel, Klusmann, Ditzen, Knaevelsrud, & Schumacher, Reference Engel, Klusmann, Ditzen, Knaevelsrud and Schumacher2019; Wang, Ward, & Morris, Reference Wang, Ward and Morris1995) as oxytocin has been demonstrated to increase the perceived intensity of emotions in others (Cardoso, Ellenbogen, & Linnen, Reference Cardoso, Ellenbogen and Linnen2014), which may heighten one's vulnerability to depression. Increased sensitivity to fluctuation in GABAergic neurosteroids, such as allopregnanolone and dehydroepiandrosterone sulfate has also been hypothesized to potentially underlie mood sensitivity to estradiol fluctuation in either direction (Gordon et al., Reference Gordon, Girdler, Meltzer-Brody, Stika, Thurston, Clark and Wisner2015). Importantly, detrimental effects of low v. high estradiol may relate to either common or unique underlying mechanisms.
The observation that E1G mood sensitivity strength is most predictive of depressive symptoms among women who are still experiencing frequent menstrual cycles is consistent with our previous report that the prophylactic mood benefits of 12 months of transdermal estradiol, presumably stabilizing estradiol levels (Watson, Studd, Riddle, & Savvas, Reference Watson, Studd, Riddle and Savvas1988), are greater among early perimenopausal women relative to late perimenopausal women (Gordon et al., Reference Gordon, Rubinow, Eisenlohr-Moul, Xia, Schmidt and Girdler2018). However, the finding that E1G sensitivity strength was less predictive of depressive symptoms among women already at high risk for depression – that is, women reporting more baseline stressful life events and a prior history of major depressive disorder – contradicts our previous finding that women with a higher number of stressful life events experience greater mood benefits of transdermal estradiol (Gordon et al., Reference Gordon, Rubinow, Eisenlohr-Moul, Xia, Schmidt and Girdler2018). While it might be hypothesized that the precision of our E1G sensitivity measures may be impacted by the presence of life stress or a prior history of psychopathology, the fact that neither of these variables was significantly associated with any of the indicators of E1G sensitivity is inconsistent with this hypothesis. The fact that depression history and a higher number of stressful life events were associated with depressive symptoms in Phase 2, regardless of E1G mood sensitivity strength, suggests that these variables increase susceptibility to perimenopausal depressive symptoms through mechanisms – whether neurobiological or psychosocial – that are unrelated to estrogen sensitivity.
Sensitivity to PdG did not predict the development of clinically significant depressive symptoms, consistent with the fact that while perimenopausal estrogen levels are known to become more extreme relative to levels found in reproductive-aged women, progesterone levels become increasingly stable (O'Connor et al., Reference O'Connor, Ferrell, Brindle, Trumble, Shofer, Holman and Weinstein2009). Thus, although a subset of women may exhibit mood sensitivity to progesterone changes throughout their reproductive lifespan, including the menopause transition, this sensitivity does not appear to be a risk factor for perimenopausal depression.
Of course, the validity of the current study's findings is largely dependent on the construct validity of the measure of E1G mood sensitivity used. Its reliance on only 12 measures of E1G and mood likely limits its precision; indeed, such a small n has been shown to create a bias of up to +0.15 (Bishara & Hittner, Reference Bishara and Hittner2015). However, several observations support its construct validity: first, it is reassuring that neither mean Phase 1 E1G nor mean CES-D were significantly correlated with the measures of E1G mood sensitivity as this suggests that the calculation of the E1G sensitivity scores was not impacted by excessively low or high E1G levels or CES-D scores. Second, the fact that both E1G-CES-D correlation and absE1G-CES-D correlation significantly interact with weekly E1G to predict weekly mood (as depicted in Fig. 2b) help support the idea that these trait-level indices represent meaningful predictors of depressive symptoms within a particular hormonal environment.
The current findings suggest that future research examining the effects of estradiol on mood and related outcomes should directly measure within-person differences in the strength of estradiol's effects, perhaps by using an experimental manipulation of estradiol or a protocol similar to the one used in the current study, and consider this measure as a potential moderator of estradiol's effects. Studies failing to do so may risk finding an overall null effect of estradiol as estradiol sensitivities in opposing directions are likely to ‘cancel each other out.’ Relatedly, future research should consider the possibility that the mechanisms underlying estradiol's effects on mood may differ from woman to woman. The current study supports our previous conclusion that perimenopausal women may experience a mood benefit from the estradiol-stabilizing effects of estradiol therapy but further suggests that estradiol therapy may benefit different women for different reasons, including its tendency to raise trough estradiol levels, prevent ovulation (De Leo, Lanzetta, Morgante, De Palma, & D'Antona, Reference De Leo, Lanzetta, Morgante, De Palma and D'Antona1997; Watson et al., Reference Watson, Studd, Riddle and Savvas1988), or both.
The current findings must be interpreted in light of some limitations. First, we did not measure levels of sex hormone binding globulin for the measurement of biologically available estradiol. Second, daily or every-other-day measures of E1G and mood might have provided a more precise measure of hormonal sensitivity. Third, we did not use an objective measure of wake time when measuring the CAR. Despite these limitations, we believe that the current study represents a valuable addition to the existing research on perimenopausal depression and recommends a novel approach to future research in this area: one that is better suited to examining the ways in which individual biological sensitivities interact with both the hormonal and psychosocial environment of the menopause transition to predict clinically significant mood outcomes.
Acknowledgements
We would like to thank Rashell Wozniak, Tianna Sauer, Julie Ziemer, Julia Grummisch, and Ashley Ethier for their help with data collection.
Financial support
Saskatchewan Health Research Foundation Establishment Grant (grant #3791). Dr Gordon is also supported by a Tier II Canadian Institutes of Health (CIHR) Canada Research Chair.
Conflict of interest
None.


