


Introduction
A key assumption in social policy theory and practice is that the relationship and collaboration between caseworkers and clients are crucial to the success of interventions and programmes (Graybeal, Reference Graybeal2007; Blom and Morén, Reference Blom and Morén2010). Active cooperation and a positive relationship between client and caseworker are supposed to promote positive outcomes: for instance, labour market integration of disadvantaged social assistance recipients (Caswell et al., Reference Caswell, Eskelinen and Olesen2011; Danneris, Reference Danneris2016). However, there is limited empirical evidence to support this assumption.
Likewise, the literature on the outcomes of Active Labour Market Policy (ALMP) programmes has seldom tested the impact of the caseworker-client relationship on employment outcomes. Instead, evaluations of ALMPs tend to focus on intervention or programme effects, understood as the independent (often average) effects of a given programme or intervention (for review of the literature, see for instance Card et al., Reference Card, Kluve and Weber2018). Intervention or programme effects may occur before the programme begins (as motivation or threat effects), during the programme (as locking-in effects, qualification effects or substitution effects) or after the programme (as employment effects or displacement effects) (Bredgaard, Reference Bredgaard2015). There are a few notable exceptions in the evaluation literature which indicate that similarities between caseworkers and clients as well as reduced caseloads may improve subsequent employment outcomes (Behncke et al., Reference Behncke, Frölich and Lechner2010; Hainmueller et al., Reference Hainmueller, Hofmann, Krug and Wolf2016).
By changing the focus from activation programmes to collaboration and alliances, this article contributes to the literature on social policy and employment services by measuring the influence of the relationship between social assistance recipients and their caseworkers on subsequent employment and educational rates. We examine whether strong working alliances between social assistance recipients and their caseworkers produce higher employment and education outcomes. The data derive from a survey of Danish social assistance recipients with questions measuring the strength of the working alliance and outcome data from administrative registers. Our hypothesis is that strong alliances generate higher employment and education outcomes than weaker working alliances when controlling for other factors. The key argument of the article is that working alliances can help disadvantaged unemployed people enter employment or education. Social assistance recipients can generally be considered a disadvantaged group of unemployed. They often have low educational levels, poor self-rated health, mental health issues, limited work experience and have been on income support for multiple years (Jensen, Reference Jensen2014). Our motivation for focusing on this disadvantaged group of social assistance recipients is that we expect that they are more in need of a strong alliance to gain a foothold in the labour market than, for instance, unemployment benefit recipients with extensive work experience and few work hindering problems.
The article is organised in five sections. First, we briefly present the working alliance theory. Second, we review the relevant literature focusing on working alliance theory in employment services. Third, we present the case, data and methods of the study and operationalise the theory to fit employment services. Fourth, we present the empirical findings. Fifth, we discuss the implications, limitations and generalisability of the findings for social policy research and practice.
Working alliance theory
Working alliance theory – sometimes called the therapeutic alliance or the working relationship – was originally developed in the field of psychotherapy (Bordin, Reference Bordin1979; Reference Bordin, Horvath and Greenberg1994; Horvath, Reference Horvath, Horvath and Greenberg1994). A number of randomised controlled trials found that psychotherapy was effective in treating mental illness, but failed to demonstrate the superiority of one method over another (Wampold, Reference Wampold2001). This led to the realisation that the active ingredient in psychotherapy was not only the specific approach and the methods, but also the alliance or the relationship and collaboration between the change seeker (client) and the change agent (therapist). In the field of psychotherapeutic research, alliance theory started to emerge in the 1950s and 1960s and gained prominence in the late 1970s and 1980s with the work of Bordin (Reference Bordin1979). Bordin defined the working alliance as ‘a mutual understanding and agreement about change goals and the necessary tasks to move towards these goals along with the establishment of bonds to maintain the partners’ work’ (Bordin, Reference Bordin, Horvath and Greenberg1994: 13).
According to Bordin, the working alliance consists of mutual goals, tasks and bonds (Bordin, Reference Bordin1983; Reference Bordin, Horvath and Greenberg1994). The three concepts all originate from working alliance theory and a strong alliance is characterised by positive assessments of all three components. Since the development of working alliance theory, psychotherapeutic research has shown that the alliance accounts for a great deal of the explained variance in outcomes in psychotherapy. Wampold and Imel (Reference Wampold and Imel2015) found that 60 per cent of the variance in outcomes is explained by the alliance, 30 per cent is explained by allegiance (the therapist’s confidence in the techniques used), and the remaining 10 per cent is explained by the model and techniques used. According to Duncan et al. (Reference Duncan, Miller, Sparks, Claud, Reynolds, Brown and Johnson2003), more than a thousand studies in the field of psychotherapy show that a strong alliance is one of the best predictors of positive outcomes. Proponents of the theory claim that working alliance theory can be applied to any type of relation-based change process (Bordin, Reference Bordin1979: 252; Reference Bordin1983: 35). In the following section, we review the relevant literature on working alliances in employment services and related strands of literature. Then, we apply working alliance theory to the field of employment services.
Existing research and working alliances in employment services
Only a small number of studies have been conducted to examine the employment effects of caseload reductions in employment services and the effect of the caseworker. In Switzerland, Behncke et al. (Reference Behncke, Frölich and Lechner2010) found that the chances of job placements improved by 3 percentage points if the unemployed person was counselled by caseworkers belonging to the same social group, defined by age, education and nationality. A German experiment found that reduced caseloads improved employment outcomes for hard-to-employ unemployed (Hainmueller et al., Reference Hainmueller, Hofmann, Krug and Wolf2016). A quasi-experimental study found a significant employment effect of caseload reductions in combination with intensified activation of disadvantaged social assistance recipients (Ravn and Nielsen, Reference Ravn and Nielsen2019). Furthermore, a recent review of existing research found ‘moderate’ evidence of employment effects of caseload reductions in employment services (VIVE, 2019). A Danish study also showed that caseworkers’ belief in the client’s job chances could predict subsequent job outcomes (Beskæftigelses Indikator Projektet, 2017a). For unemployment benefit recipients, evidence further suggests that early and frequent meetings between clients and caseworkers produce positive employment effects (Maibom et al., Reference Maibom, Rosholm and Svarer2017). Studies of vocational rehabilitation also indicate that a strong working alliance is useful in retaining and integrating persons on sick leave in the labour market (Lustig et al., Reference Lustig, Strauser, Rice and Rucker2002; Pruett et al., Reference Pruett, Swett, Chan, Rosenthal and Lee2008; Haugli et al., Reference Haugli, Maeland and Magnussen2011; Wagner et al., Reference Wagner, Wessel and Harder2011). Therefore, there is some evidence to suggest that caseloads and the relationships between clients and caseworkers affect employment outcomes. The role of the working alliance in employment services is, however, underexplored.
Studying working alliances in employment services is relevant for several reasons. First, the goals of employment services (activation or welfare-to-work programmes) are not necessarily mutual and shared, as envisioned in working alliance theory. Employment services define the goals in advance: employment, education or participation in programmes. If the unemployed is not willing to participate or cooperate, the employment services may enforce economic sanctions. Second, the obligatory character of employment services such as activation programmes suggests that tasks are mandatory and not voluntary. Payment of income benefits such as social assistance is conditional on participation in activation programmes. Third, bonds may be difficult to forge when caseworkers have limited time, resources and energy. The challenges of creating strong working alliances in employment services are clearly illustrated in the literature on street-level bureaucracy (Lipsky, Reference Lipsky2010; Zacka, Reference Zacka2017). In the Danish case, empirical studies indicate that strong and positive bonds between caseworkers and clients are generally difficult to establish, since many clients distrust job centres and caseworkers (Caswell et al., Reference Caswell, Eskelinen and Olesen2011). Studies also indicate that many clients do not experience the activation programmes as meaningful and find the goals of activation unclear (Rambøll, 2009; 2013; Andersen and Larsen, Reference Andersen and Larsen2018). This indicates that alliance building might prove difficult in employment services.
As described above, there are only a few studies of the impact of case work on job outcomes in employment services, and no specific studies applying and measuring the working alliance. Our study therefore contributes to the existing research by measuring the strength of the working alliance through a survey among social assistance recipients and by examining the association between the alliance and subsequent employment and education outcomes.
Case, data and methods
We study the influence of working alliances on employment outcomes through a case study of a Danish municipality. Denmark is a relevant country to study in relation to public employment services for a number of reasons. First, Denmark is a ‘high-spender’ on ALMPs1. Second, the Danish public employment service system is decentralised, implying that municipalities have a relatively high degree of autonomy in designing and implementing innovative employment services. In the case study, we focus on one innovative municipality.
From 2015 to 2018, the local politicians of Hjoerring Municipality decided to invest €17 million in reducing caseloads by hiring additional staff and intensifying activation of the disadvantaged unemployed in ALMPs2. With this investment the caseloads of caseworkers responsible for the activation of disadvantaged persons on social assistance were reduced from seventy to eighty cases per caseworker to thirty-five to forty. The idea was to create better framework conditions for providing high quality (employment focused) social work and for establishing a good working relationship and collaboration between caseworkers and clients.
The case is therefore a ‘best case’ in reducing high caseloads in employment services. The data consist of a survey of unemployed social assistance recipients. The purpose of the survey was to investigate the clients’ assessment of their own barriers to employment, the employment service and the collaboration with their caseworker. The survey was later merged with administrative register data to obtain information on employment and education outcomes one year after the survey was conducted (August 2017). The participant survey was conducted in August 2016 among social assistance recipients in the municipality who had been unemployed for at least thirteen weeks. The cut-off point of thirteen weeks was chosen to ensure that the clients in the survey had enough time to get familiar with their caseworker and the employment service, so they would be able to adequately assess the questions in the survey. The survey data were collected using telephone interviews. Potential respondents were called by telephone up to four times in total in order to increase the response rate.
The response rate in the survey was 19 per cent (153 respondents) for the social assistance group. The total population (N) of social assistance recipients in the municipality was 805 persons. Missing values on ratio variables were not imputed. Instead, observations with missing values were dropped from the analysis. Non-response and dropout analyses of the data showed no clear pattern concerning dropouts or non-response from the survey. The survey is, therefore, representative of the population regarding age, duration of the benefit recipiency and status as native Dane/immigrant, and it is almost representative regarding gender, with a slight overrepresentation of women. The respondents are therefore representative regarding most observed characteristics. The respondents may, however, consist of clients who feel most strongly about the subject of the survey. On average, respondents had a somewhat strong self-assessed alliance, but they were not overly positive (cf. Table 1 and Table 2). Furthermore, there was a high degree of variance in the answers (see the standard deviations in Table 1 and Table 2).
Table 1 Indicators of the working alliance (n=92)

Note:* The questions have been translated from Danish to English
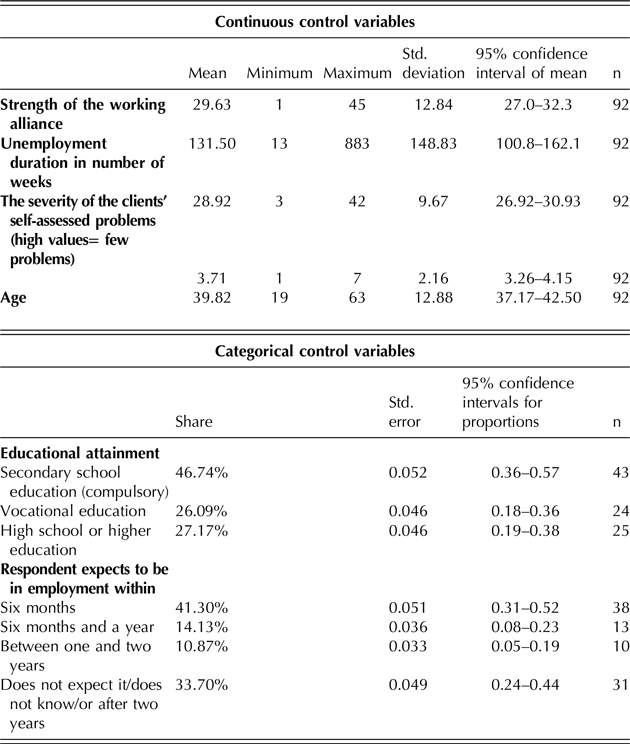
Table 2 Descriptive statistics of the control variables
Measuring the working alliance between social assistance recipients and their caseworkers
We constructed a set of eight indicators to measure the different dimensions of working alliances in employment services. The questions were developed with inspiration from the Working Alliance Inventory (Horvath, Reference Horvath1992), which is a validated scale for measuring working alliances in psychotherapy. However, the questions needed to be adapted to fit the context of employment services. Table 1 shows the eight indicators and the results of the survey. The questions were measured on a seven-point ordinal scale.
According to the theory, goals refer to the desired outcome of an intervention or activity. It is important that the change seeker understands and agrees with the overall goal of the intervention or treatment (Bordin, Reference Bordin, Horvath and Greenberg1994: 13). According to the alliance theory, agreement on the goals increases motivation to participate actively. We included two questions to measure the ‘goals dimension’ of working alliance theory. The first question measured ‘goal alignment’ by asking to what extent respondents wanted to get back into work or education. There may be a discrepancy between the clients’ own goals and the official policy goal. Some persons on social assistance may not want ordinary employment due to, for instance, economic disincentives, inadequate work ability or child-care responsibilities. The second question asked whether respondents understood the purpose of the activation programme.
In working alliance theory, tasks refer to the specific therapeutic activities. The therapist is responsible for choosing the relevant tasks or methods, but it is important that the client understands the relevance of the tasks in order to remain an active participant (Bordin, Reference Bordin, Horvath and Greenberg1994: 16). This implies client involvement and negotiation between the parties when choosing the tasks (Bordin, Reference Bordin, Horvath and Greenberg1994: 15). To foster motivation and engagement, the client should regard the tasks as effective, suitable and relevant for achieving the desired outcome (Bordin, Reference Bordin1983: 35; Horvath and Symonds, Reference Horvath and Symonds1991). We constructed three questions to measure the ‘tasks dimension’ of the theory. The first question asked to what extent the respondents were included in the planning of the activities. The second question asked to what extent their preferences were taken into account. The third question asked to what extent clients believed that the activation programme took their needs as a starting point. Again, these ideals may be difficult to achieve in employment services, which are often characterised as unresponsive, standardised and bureaucratic (Rambøll, 2009; 2013; Andersen and Larsen, Reference Andersen and Larsen2018).
In working alliance theory, bonds refer to the relationship between the client and the therapist. It is essential that the client trusts the therapist and believes that the therapist has good intentions and is trying to help (Bordin, Reference Bordin1979: 254; Horvath and Luborsky, Reference Horvath and Luborsky1993). The final questions measured the ‘bonds dimension’ of the theory. The first question measured the respondents’ assessment of cooperation with the caseworker. The second question assessed whether the respondents believed that the caseworker was trying to help. The final question measured the level of satisfaction with the caseworker.
The majority of the respondents in our survey found that the working alliance between them and their caseworker was relatively strong. This may be a result of the caseload reduction and the explicit empowerment and client-centred strategy of the case municipality. For the eight indicators, the mean values were between 4.5 and 6.2 on the seven-point scale, where seven is the highest. The standard deviations were around 2 (see Table 1), which means that there was quite a lot of variance in the answers.
To improve the reliability and validity of these working alliance indicators and to reduce the number of variables in the analysis, the next step was to construct an additive index (component variable). The index was constructed from the eight original questions in Table 1 based on factor and reliability analyses.
The initial factor analysis (principal factor) without rotation suggested that only one dimension should be extracted from the variables (largest Eigenvalue=4.8, second largest Eigenvalue=0.21). According to the Kaiser criterion, all components with Eigenvalues below 1.0 should be dropped. The results of the initial factor analysis thus suggested that the index should include all eight items (variables). After orthogonal rotation (principal factor), the largest Eigenvalue was 3.8 and the second largest was 1.1. A unique dimension with the first question in Table 1 was extracted. This suggested that the first alliance question could potentially be excluded from the index. A KMO test for sampling adequacy yielded an overall value of 0.9, suggesting a very high degree of sampling adequacy.
The reliability analyses also strongly suggested the construction of an index due to high inter-item correlation. For all eight questions/items, Cronbach’s alpha was 0.9. Excluding the first alliance question led to Cronbach’s alpha rising to 0.93 – a minor increase in value. This analysis suggested that it might be beneficial to exclude the first item, but the results were ambiguous.
Because working alliance theory states that agreement with goals is essential and to get a parsimonious regression model with relatively few independent variables (due to the sample size), we constructed an additive index with all eight items. We also constructed the index with all eight items due to the overall high Cronbach’s alpha values and the mixed results from the factor analysis. The index ranges from 0-45, with low values indicating a weak alliance and high values indicating a strong alliance.
Measuring employment and education outcomes
Subsequently, the data from the participant survey were merged with administrative register data from Statistics Denmark (the DREAM register) in order to measure employment and education outcomes of the working alliance. The outcome variable ranges from 0-12 and is based on employment and education information from the subsequent year (12 months) after the respondents completed the survey (from September 2016 to August 2017). A value of 1 indicates that a respondent had one month with either an employment degree or received the Danish Student Grant (been in education) in one month. Conversely, a value of 12 means that the respondent had an employment degree or was in education in all twelve months from September 2016 to August 2017. A value of 0 means that the respondent was not in paid work or education at all during the course of the year after the survey. Employment refers to anything from having a full-time job to working just a few hours each month. Regardless of the number of hours worked, a score of 1 was added for each month with (some) employment or participation in education. Education was included in the outcome variable to take into account that the official policy objective for young persons on social assistance is to enter education. Thirty per cent of the social assistance recipients in the survey are people younger than thirty years of age.
We measured both employment and participation in education in the dependent variable. We could have chosen to focus only on employment, measured as the number of hours with employment during the course of a year, or only on the number of weeks of participating in education during the subsequent year (0-52 weeks). However, sixty-five of ninety-two social assistance recipients did not obtain paid employment in the observation period. Furthermore, eighty-two of the ninety-two social assistance recipients did not participate in education during the observation period. We therefore see quite low variation in these two variables, which makes it difficult for a regression model to explain the (limited) variation.
When we combined the employment and education variables, we found that fifty-four respondents had neither been in employment nor education, while the remaining forty-six respondents attained some form of employment or participated in education. By combining the two variables, we thereby increased the variation in the outcome variable and the proportion of respondents achieving positive outcomes. Using, for instance, only information on employment outcomes, the respondents that began education would be counted as achieving a negative outcome instead of a positive outcome. We therefore tried to minimise the amount of positive information that was disregarded. As a robustness test, we did the analysis with the education variable and the employment variable separately (see appendix) and found positive and significant associations (at a 0.10 level) of the alliance with participation in education (see Table 4 in the appendix). We also found positive, but non-significant statistical effects of the alliance (p-value=0.2) on the number of working hours (see Table 5 in the appendix). As a third robustness test, we did a series of models with the number of working hours as the dependent variable including only respondents older than thirty years (the policy goal for this group is to obtain employment). The alliance index became significant in model 2, with a positive coefficient at a 0.1 level (see Table 6 in the appendix).
Statistical methods
Using the working alliance index as an explanatory variable, we perform linear regression analyses (ordinary least squares) to investigate whether the strength of the working alliance contributes to outcomes for social assistance recipients (n=92).
According to Green (Reference Green1991), regression analysis is feasible with a dataset consisting of a minimum of fifty subjects or cases. As a rule of thumb, Green states that for each additional control or explanatory variable, the sample size should increase by eight respondents to avoid ‘overfitting’ the regression model. Overfitting a model can result in an artificially inflated R2 and poor model prediction (Austin and Steyerberg, Reference Austin and Steyerberg2015). To avoid overfitting our regression model, we therefore include only six to seven control variables when interpreting the results. We include these particular control variables because existing research has established them as valid predictors of employment outcomes, and because they show significant or close to significant results in the regression model. In relation to the interpretation of our regression analyses below, it should be noted that we are not able to be certain that there is a causal effect of the alliance on employment and education. When we use the term ‘effect’ below it should be understood as a statistical association. Theoretically, it is however plausible that a causal relationship between the alliance and subsequent employment and education outcomes exists.
Empirical analysis and findings
We begin the empirical analysis by showing the distribution of the six variables we use as control variables in the regression analyses.
The first variable shown in Table 2 is the working alliance index, our primary variable of interest. The mean value in the index is 29.6, which indicates a somewhat strong alliance. The standard deviation of 12.8 indicates a rather high degree of variance in the answers.
The first control variable is the duration of unemployment in number of weeks. This variable is included because existing research shows that a longer duration of unemployment is associated with a lower chance of re-employment (e.g. Caliendo et al., Reference Caliendo, Tatsiramos and Uhlendorff2009). On average, the social assistance recipients have been unemployed for 149 weeks (almost three years).
The second control variable is the self-assessed severity of the clients’ problems. This index was constructed from six variables measuring the respondents’ self-assessed problems in terms of:
-
1) physical health
-
2) mental health
-
3) social problems
-
4) total self-assessed problems
-
5) energy to focus on getting closer to the labour market or education
-
6) the degree to which the respondents believe that they can hold a job (work ability).
The questions measuring the severity of problems were based on the Danish ‘Employability Indicator Project’, which showed that these questions are valid predictors of subsequent employment (Beskæftigelses Indikator Projektet, 2017b). A reliability analysis showed that the seven items were suited for index construction (Cronbach’s alpha=0.88). The Cronbach’s alpha values did not increase when excluding any of the seven items. The mean of 29 indicates that the client group, as a whole, is struggling with a number of health-related and social problems, which are likely to affect their employment chances.
The third control variable is self-assessed progression from participating in activation programmes. The progression variable is a seven-point ordinal scaled variable measuring whether the respondent believes that the activation programme has brought him or her closer to getting a job or starting education. Existing research shows that progression influences employment outcomes positively (Beskæftigelses Indikator Projektet, 2017b). The question wording was: ‘Overall, to what degree do you believe the measures of the jobcentre have brought you closer to getting a job or starting in education?’. The mean value was 3.7.
The fourth control variable is the age of the respondents. Age is often negatively associated with employment outcomes (e.g. Pruett et al., Reference Pruett, Swett, Chan, Rosenthal and Lee2008; Lammerts et al., Reference Lammerts, Schaafsma, Eikelenboom, Vermulen, van Mechelen, Anema and Penninx2016). In our case, age is a particularly relevant control variable, because young people may be more predisposed to beginning an education.
The fifth control variable measures the educational attainment of the respondents. Educational background is normally a strong predictor of employment outcomes (e.g. Øyeflaten et al., Reference Øyeflaten, Hysing and Eriksen2008; Støver et al., Reference Støver, Pape, Johnsen, Sund, Claussen and Bjørngaard2012). 47 per cent of the respondents had only secondary (compulsory) schooling, 26 per cent had completed a vocational education and 27 per cent had completed high school or higher education. As a whole, our social assistance group thus has a limited educational background.
The final control variable measures the time horizon in which the respondent expects to enter into employment or education. Previous research has shown that expectation about future employment outcomes is a valid predictor of the actual obtainment of employment (Melin and Fugl-Meyer, Reference Melin and Fugl-Meyer2003; Hansen et al., Reference Hansen, Edlund and Henningsson2006; Heymans et al., Reference Heymans, de Vet, Knol, Bongers, Koes and van Mechelen2006). 41 per cent of the respondents believe that they will start work or education within six months; 14 per cent believe it will happen in between six months and a year; and 11 per cent believe that it will happen in between one and two years. The remaining 34 per cent either believe that it will happen later than two years in the future, do not know, or do not believe that they will ever obtain work or begin an education.
Table 3 shows the three OLS regressions that we perform to investigate the potential influence of the working alliance on employment and educational outcomes.
Table 3 OLS regressions (unstandardised regression coefficients). The influence of the working alliance on number of months with employment or education

Notes: *significant at 0.05, **significant at 0.01, ***significant at 0.001 Standard errors in parentheses
The first model in Table 3 is a simple model that only includes the dependent variable and the working alliance variable. There are no significant results in the first model. The obvious explanation for this is that the sample size is not sufficiently large for the differences to be statistically significant.
In model 2, we add six control variables described in Table 2. We find significant results from the variable for the ‘severity of self-assessed problems’ and the variable on ‘unemployment duration’. Fewer self-assessed problems are associated with higher employment and education outcomes, and longer unemployment is associated with lower employment and education outcomes. We also find that those with a vocational education have significantly lower employment and educational outcomes than those with a high school education or higher education. The variable measuring the self-assessed progression is not significant (p-value=0.07).
The variable measuring the time-horizon in which the respondent expects to be in employment or education also becomes significant. Those who expect to enter employment or education in between six months and a year are predicted to have 4.7 fewer months with employment or education than those who expect to be in employment or education within six months. Similarly, those with the worst assessments of their labour market and educational prospects are predicted to have 2.4 fewer months with education or employment compared to the reference group. This indicates that people are quite adequately able to evaluate their labour market prospects. Our main variable of interest, the alliance variable, also becomes significant in model 2.
In model 3, we control for age, but the variable does not become significant and does not change the adjusted R2, the coefficients or the significance of the other variables.
Model 3 also shows significant results for the working alliance variable, like in model 2. The point at which the working alliance variable becomes significant is with the addition of the ‘expectations’ variable (between model 1 and model 2). A plausible explanation for this is that some of the respondents are quite close to the labour market, whereas others are far from it. When controlling for this, the alliance variable becomes significant. This indicates that the ‘expectations’ variable acts as a suppressor variable, clouding the relationship between the alliance and employment and educational outcomes. The coefficient of the alliance variable implies that, during the course of a year, a one-unit increase in the alliance variable yields 0.087 more months with employment or education. This corresponds to 3.9 more months in education or employment when going from a very weak alliance (a value of 1) to a very strong alliance (a value of 45). We therefore see a positive influence of the working alliance variable on employment and education outcome. In addition, we see a rather high adjusted R2 of 0.41. Our model explains the employment and education outcomes of the social assistance recipients quite well. The high adjusted R2 could be a sign of overfitting. However, this does not seem to be the case, as only a few variables do most of the explanatory work (not shown in Table 3). When adding the first control variable – in a model, the ‘severity of problems variable’ – the adjusted R2 increases to 0.22. This variable therefore explains a lot of the variance. When the unemployment duration is added, the adjusted R2 increases to 0.26. It increases to 0.29 when controlling for education, and it increases to 0.39 when the ‘expectations’ variable is included. These four variables are therefore very good at explaining and predicting employment outcomes.
To check for multicollinearity, we conducted variance inflation factor tests (VIF tests) for models 2 and 3. The largest mean vif-value was 1.6, showing no evidence of multicollinearity. We also investigated the homogeneity of variance of the residuals visually by plotting the residuals against the fitted predicted values. These plots showed no evidence of heteroscedasticity. Furthermore, we conducted Cameron and Trivedy’s test of heteroscedasticity. The p-value was insignificant (=0.31), indicating no issues of heteroscedasticity.
In addition, we carried out three robustness tests (see the Appendix). In these tests, we found positive coefficients of the working alliance index. Regarding participation in education (Table 4), we found nearly significant effects of the alliance on a 0.10 level. The alliance variable almost became significant when we controlled for age (p-value=0.101). This makes sense, as the official policy goal for young persons on social assistance is to begin an education, and older age groups are less predisposed to starting an education.
In relation to the number of working hours (Table 5), we found quite strong and positive (a one-unit increase in the alliance variable corresponds to five additional hours of employment) but non-significant effects of the alliance (p-value=0.2). When including only respondents older than thirty and using the number of working hours as the dependent variable (Table 6), the alliance index becomes significant, with a positive coefficient at a 0.1 level (in model 2). A one-unit increase in the alliance index yields nine additional hours of paid employment during the course of a year. Going from a very weak alliance (a value of 1) to a very strong alliance (a value of 45) corresponds to 405 extra hours of employment during a year.
In these robustness tests, we disregard a lot of information about positive outcomes when focusing only on either employment or education. In addition, the two dependent variables contain significantly less variation than the composite measure. This makes it more difficult to find significant associations of the alliance in the robustness tests.
Discussion and conclusion
In this article, we attempt to open the ‘black box’ of employment services and examine one possible mechanism explaining the outcomes: namely, the role of working alliances. The literature suggests that the strength of the working alliance between caseworkers and clients may affect employment and education outcomes.
Our analyses indicate that working alliances between clients on social assistance and their caseworkers are associated with employment and education outcomes. When controlling for other variables, social assistance recipients with strong alliances have higher employment or education outcomes (than their counterparts with weak alliances) one year after the survey was conducted. Controlling for other factors, we found that a one-unit increase in the alliance variable adds 0.087 months with education or employment. Going from a very weak alliance to a very strong alliance adds roughly 3.9 months with employment or education. Despite the methodological limitations of our study, we provide evidence suggesting that strong working alliances are useful in assisting disadvantaged jobseekers in finding employment or education. These findings should be tested in other studies in other contexts and with different target groups. Nevertheless, our results indicate that a ‘collaboration’ or a ‘relationship’ effect exists in employment services, which is our main contribution to the literature. Needless to say, the associations we find are not deterministic but probabilistic. Many clients with strong alliances with their caseworker may not become employed due to, for instance, work hindering problems or a lack of in-demand qualifications. This is the case for the respondents with strong alliances with their caseworker who did not obtain employment or start an education. They remain unemployed.
The working alliance is one of many mechanisms that can promote the employment of disadvantaged unemployed persons.
Taking the results at face value, the implication for social policy practice and especially the implementation of employment services is to create settings that are conducive to stronger working alliances. In most places, the current realities of employment services are not necessarily conducive to the ideal notions of working alliance theories. Public employment services tend to decide the goals of the interventions, and not every unemployed person may want any type of job. The tasks of employment services are mandatory and sanctions may be enforced if clients do not comply. Finally, positive and strong bonds may be difficult to forge in a context where caseworkers have limited time, resources and energy. Nevertheless, our findings are encouraging by suggesting that strong working alliances may promote higher employment and education outcomes. Our findings therefore prompt the implementers of employment services to invest time, energy and resources in promoting settings that are conducive to building stronger working alliances.
The strong working alliances we find in the case municipality may, to a certain extent, be a consequence of the caseload reduction, and the empowerment and client-centred strategy of the municipality by providing improved framework conditions for high quality collaboration. Nevertheless, we strongly believe that the notion that alliances in employment services affect employment outcomes for disadvantaged jobseekers is theoretically generalisable. It is, however, a task for future research to investigate this empirically.
Notes
-
1 In 2017, the expenditure for ALMPs in Denmark was 1.96 per cent of GDP. The highest share among all OECD countries (OECD, 2017).
-
2 The municipality is an average sized municipality (65.000 inhabitants) located in the northern part of Jutland in a relatively low income and high unemployment area, where labour supply is shrinking due to an ageing population and migration to urban areas.
Appendix
Table 4 Linear regressions. The influence of the working alliance on number of weeks participating in education during the course of a year (52 weeks)

*significant at 0.05 **significant at 0.01 *** significant at 0.001
In Table 4 above, we use the number of weeks with participation in education as the dependent variable (values from 0–52). In model 2, the p-value of the alliance variable is 0.101. At a 0.1 level we thus find nearly significant and positive results of the alliance in model 2.
Table 5 Linear regressions. The influence of the working alliance on number of working hours during the course of a year

*significant at 0.05 **significant at 0.01 *** significant at 0.001
In Table 5, we use the number of working hours as our dependent variable. In model 2, the p-value of the alliance variable is 0.2. The results are not statistically significant, but the coefficient is positive and indicates that a one-unit increase in the alliance index adds 5.3 extra hours of paid employment during the course of a year.
Table 6 Linear regressions. The influence of the working alliance on number of working hours during the course of a year. Including only respondents above the age of 30

*significant at 0.05 **significant at 0.01 *** significant at 0.001
In Table 6 above, we also use the number of working hours as the dependent variable, but we include only respondents above the age of thirty. In model 2, the p-value of the alliance variable is 0.07. It is thus significant at a 0.1 level. The coefficient is positive and indicates that a one-unit increase in the alliance index adds 9.1 extra hours of paid employment during the course of a year. Going from a very weak alliance (a value of 1) to a very strong alliance (a value of 45), corresponds to 405 extra hours of employment during a year.


