
Compared to their first language (L1), people typically not only have less knowledge of their second language (L2) but also are considerably less fluent using what L2 knowledge they have (Segalowitz, Reference Segalowitz2010). Fluency constitutes a critical aspect of understanding L2 performance and proficiency (e.g., Bosker, Pinget, Quené, Sanders, & de Jong, Reference Bosker, Pinget, Quené, Sanders and de Jong2013; Cucchiarini, Strik, & Boves, Reference Cucchiarini, Strik and Boves2002; Housen, Kuiken, & Vedder, Reference Housen, Kuiken, Vedder, Housen, Kuiken and Vedder2012; Iwashita, Brown, McNamara, & O'Hagan, Reference Iwashita, Brown, McNamara and O'Hagan2008; Skehan, Reference Skehan1998). For instance, Iwashita et al. (Reference Iwashita, Brown, McNamara and O'Hagan2008) showed that fluency had a stronger impact on distinguishing overall levels of L2 speaking proficiency than any other linguistic features of spoken L2 production such as grammatical accuracy and complexity, vocabulary, or pronunciation.
Fluency relates to how easily and smoothly speech is delivered (Lennon, Reference Lennon1990), and Segalowitz (Reference Segalowitz2010) distinguished the three different notions of fluency: cognitive, utterance, and perceived fluency. Cognitive fluency is about the speaker's capacity to utilize the underlying cognitive processes that are responsible for speech production. Utterance fluency refers to the temporal, pausing, and repair characteristics of utterances, and perceived fluency has to do with how listeners make inferences about the speaker's cognitive fluency based on the utterance fluency. The relationship between utterance fluency and perceived fluency is the topic of the current study.
UTTERANCE FLUENCY AND PERCEIVED FLUENCY
In order to identify speech features that affect the perception of fluency, a number of previous studies investigated the relationship between utterance fluency and perceived fluency by relating fluency ratings to acoustic characteristics of L2 speech (e.g., Bosker et al., Reference Bosker, Pinget, Quené, Sanders and de Jong2013; Cucchiarini, Strik, & Boves, Reference Cucchiarini, Strik and Boves2000; Cucchiarini et al., Reference Cucchiarini, Strik and Boves2002; Derwing, Rossiter, Munro, & Thomson, Reference Derwing, Rossiter, Munro and Thomson2004; Freed, Reference Freed and Riggenbach2000; Kormos & Deńes, Reference Kormos and Deńes2004; Rossiter, Reference Rossiter2009). The common findings suggest that speed and pause phenomena are strongly associated with L2 perceived fluency. However, when closely examined, previous findings on pause phenomena show a complicated picture. For instance, in Bosker et al. (Reference Bosker, Pinget, Quené, Sanders and de Jong2013), both pause frequency and pause length were negatively correlated with fluency ratings. However, in Kormos and Deńes (Reference Kormos and Deńes2004) fluency ratings did not correlate with pause frequency but did correlate with pause length. By contrast, in Cucchiarini et al. (Reference Cucchiarini, Strik and Boves2002), the opposite pattern was found; in other words, fluency ratings correlated with pause frequency but not with pause length.Footnote 1 Furthermore, the effect of pause location on the perception of L2 fluency has not yet been investigated.
Another issue on the relationship between utterance fluency and perceived fluency is that although L1 speakers also produce disfluencies (e.g., pauses and repairs) and 6 in every 100 words are estimated to be affected by disfluency (Bortfeld, Leon, Bloom, Schober, & Brennan, Reference Bortfeld, Leon, Bloom, Schober and Brennan2001; Fox Tree, Reference Fox Tree1995), L1 speakers tend to be perceived as fluent by default (Davies, Reference Davies2003; Riggenbach, Reference Riggenbach1991). Studies investigating the relationship between utterance fluency and perceived fluency of L1 speakers are rare. One of the few studies was done by Bosker, Quené, Sanders, and de Jong (Reference Bosker, Quené, Sanders and de Jong2014b), and they compared the way raters evaluate fluency of L1 and L2 speech. They manipulated L1 and L2 speech in terms of pauses, by constructing no pause, short pause, and long pause conditions, and speed, by speeding up L2 speech and slowing down L1 speech. The results showed that the ratings of manipulated L1 and L2 speech were affected in a similar fashion, suggesting that listeners evaluate fluency characteristics of L1 and L2 speech in a similar way. Bosker et al. (Reference Bosker, Quené, Sanders and de Jong2014b) also has methodological implications. Many previous studies used correlational analyses to explore the relationship between utterance fluency and perceived fluency (e.g., Bosker et al., Reference Bosker, Pinget, Quené, Sanders and de Jong2013; Cucchiarini et al., Reference Cucchiarini, Strik and Boves2002; Derwing et al., Reference Derwing, Rossiter, Munro and Thomson2004; Kormos & Dénes, Reference Kormos and Deńes2004; Rossiter, Reference Rossiter2009). However, as Bosker et al. (Reference Bosker, Quené, Sanders and de Jong2014b) point out, the correlational approach would be unsuitable to compare the perception of L1 and L2 speech because they differ in many respects. Hypothetically, if pause frequency is found to be more strongly correlated with ratings of L2 speech than with ratings of L1 speech, then it could be because L2 speech had more pauses as compared to L1 speech, and not because of a difference in relative weight of pausing. Therefore, using phonetic manipulations is a way to ascertain that the effects on fluency ratings could be directly attributed to the fluency characteristics manipulated, and to compare how the same modification in L1 and L2 speech affects perceived fluency.
DISTRIBUTION OF DISFLUENCIES
In examining pause phenomena, the majority of studies on L2 utterance fluency focused on the frequency and duration of pauses only. However, some studies included pause distribution in their analysis and found that fluent speech tended to have pauses at grammatical junctures, whereas nonfluent L2 speech often had pauses within clauses or utterances (e.g., Davies, Reference Davies2003; de Jong, Reference de Jong2016; Freed, Reference Freed and Freed1995; Kahng, Reference Kahng2014; Lennon, Reference Lennon1990; Tavakoli, Reference Tavakoli2011; Towell, Hawkins, & Bazergui, Reference Towell, Hawkins and Bazergui1996; cf. Riazantseva, Reference Riazantseva2001). As Bosker (Reference Bosker2014) points out, native and nonnative disfluency production are different in terms of not only quantity but also quality (i.e., distribution). Kahng (Reference Kahng2014) demonstrated that one of the biggest differences between L1 and L2 utterance fluency was found in the number of pauses within a clause. It has been argued that in fluent speech, language is encoded a clause at a time (Pawley & Syder, Reference Pawley, Syder and Riggenbach2000), and pausing within clauses seems to reflect difficulties in planning or encoding speech (Cenoz, Reference Cenoz1998; Lennon, Reference Lennon, Dechert, Mohle and Raupach1984; Wood, Reference Wood2010). However, the effects of pause location on the perception of L2 speech fluency have not yet been fully examined.
L1 literature has a longer history on pause phenomena (e.g., pausology, a specialized field in psycholinguistics, the study of temporal variables in speech pioneered by Goldman-Eisler in the 1950s) and can provide insights into L2 research (Griffiths, Reference Griffiths1991). Schnadt (Reference Schnadt2009) points out that one of the major issues for the study of silent pauses has been distinguishing a “hesitant” pause from a pause based on a speaker's natural prosody. Hesitant pauses (or performance-based pauses; Ferreira, Reference Ferreira1993, Reference Ferreira2007) are related to delays in planning and production processes, whereas prosodic pauses (Ferreira, Reference Ferreira1993, Reference Ferreira2007) separate utterances into intonational phrases (i.e., a speech segment that occurs with a single prosodic contour), and thus are part of the rhythmic structure of speech. In L1 speech, most pauses tend to occur at clause boundaries (Boomer, Reference Boomer1965; Hawkins, Reference Hawkins1971; Holmes, Reference Holmes1988; MacGregor, Reference MacGregor2008). Prosodic pauses typically occur at intonational phrase or clause boundaries; however, hesitant pauses can occur at any point where a speaker needs to plan upcoming speech or encounters difficulty. Studies show that hesitant pauses and disfluencies in L1 speech tend to occur before more complex content, such as open-class words (Maclay & Osgood, Reference Maclay and Osgood1959), unpredictable words (Beattie & Butterworth, Reference Beattie and Butterworth1979), or low-frequency words (Levelt, Reference Levelt1983).
EFFECTS OF DISFLUENCIES WITHIN A CLAUSE ON LISTENERS
L1 research on disfluency has also suggested its important role in speech perception and comprehension. The traditional view was that disfluencies interrupt speech perception (Martin & Strange, Reference Martin and Strange1968) and pose a continuation problem for listeners (Levelt, Reference Levelt1989), requiring them to edit out disfluencies during speech perception. However, recent psycholinguistic studies show that disfluencies may have certain functions and help listeners. For instance, Fox Tree (Reference Fox Tree2001) demonstrated that uhs increased word recognition speed whereas ums did not, and argued that uh signals a short upcoming delay and um signals a long upcoming delay. Brennan and Schober (Reference Brennan and Schober2001) showed that listeners responded to target words after filled pauses faster than when without them. In a series of eye-tracking experiments, Arnold and colleagues showed that when a target was presented with a disfluent utterance, listeners were biased to look at a discourse-new referent (Arnold, Fagnano, & Tanenhaus, Reference Arnold, Fagnano and Tanenhaus2003; Arnold, Tanenhaus, Altmann, & Fagnano, Reference Arnold, Tanenhaus, Altmann and Fagnano2004) and an unknown object as compared to a known object (Arnold, Hudson Kam, & Tanenhaus, Reference Arnold, Hudson Kam and Tanenhaus2007). Using event-related potentials, Corley and his colleagues showed that disfluent utterances with filled pauses (Corley, MacGregor, & Donaldson, Reference Corley, MacGregor and Donaldson2007) and silent pauses (MacGregor, Corley, & Donaldson, Reference MacGregor, Corley and Donaldson2010) attenuated context-driven predictions about upcoming words and improved recognition memory. Corley and Hartsuiker (Reference Corley and Hartsuiker2011) further argued that delays of any kind help word recognition based on their findings in which word recognition was faster when target words were preceded by any type of delay, such as a filled pause, a silent pause, or an artificial tone. However, in the above studies that found positive effects of disfluencies on listeners, the listeners were presented only with a short couple of sentences and not a stretch of speech, and whether the disfluency advantages remain the same with a longer stretch of speech is less clear (cf. Fraundorf & Watson, Reference Fraundorf and Watson2011). Furthermore, the studies had disfluencies within a clause only, which makes it difficult to discuss the effects of disfluency location on listeners.
Although disfluencies have been found to have the aforementioned positive effects on listeners, Brennan and Schober (Reference Brennan and Schober2001) point out that “a disfluency advantage does not suggest that it is better for speakers to be disfluent than fluent” (p. 295), as in their findings fluent utterances had lower error rates overall and in general comprehending disfluent utterances as a whole would tend to take longer than comprehending fluent utterances. Christenfeld (Reference Christenfeld1995) also showed that filled pauses made speech sound less eloquent, and silent pauses made a speaker seem more anxious. In Fox Tree (Reference Fox Tree2002) when speakers used silent and/or filled pauses, they were thought to have production difficulty, be less honest, and be less comfortable with topics at hand.
There are a few studies that seem to suggest that pauses within a clause and between clauses may have differential effects on listeners. They argue that silent pauses at grammatical boundaries may help listener comprehension as they enable them to understand and keep pace with the utterance by indicating the boundaries of speech to be analyzed, and providing cognitive processing time (Arons, Reference Arons1993; Griffiths, Reference Griffiths1991; Reich, Reference Reich1980, Sugito, Reference Sugito1990). Pauses at grammatical junctures are claimed to be important for comprehension, and eliminating them can interfere with comprehension (Lass & Leeper, Reference Lass and Leeper1977). However, Arons (Reference Arons1993) maintains that only pauses between clauses or structural pauses (i.e., pauses between items of information in lists of meaningful trigrams such as IBM [pause] KGB [pause] PHD) are useful; pauses within clauses or nonstructural pauses (e.g., DIB [pause] MKG [pause] BPH) can interfere with speech perception processing (Bower & Springston, Reference Bower and Springston1970; Griffiths, Reference Griffiths1991; Reich, Reference Reich1980; Sugito, Reference Sugito1990). In Reich (Reference Reich1980), propositions were recalled more accurately in sentences containing pauses between clauses than in sentences containing pauses within clauses. It has also been reported that silent pauses between clauses have beneficial effects on listeners under conditions of cognitive complexity in auditory speech processing. In Aaronson (Reference Aaronson1968), pauses enhanced the speed and accuracy of digit recall, but their effects on digit monitoring were not statistically significant. Reich (Reference Reich1980) showed that pause location did not significantly affect the speed of word detection but did affect the speed and accuracy of sentence recall.
Further support for the differential effects of pauses within a clause and between clauses on listeners comes from the fact that silent pauses are one of the acoustic cues to clausal units along with pitch and vowel duration (Seidl & Cristià, Reference Seidl and Cristià2008). In language development of infants, by 6 months of age, infants show a preference for sentences containing pauses between clauses to sentences containing pauses within clauses (Hollich & Houston, Reference Hollich, Houston, Slater and Lewis2007).
As discussed above, disfluencies within a clause have been reported to have both positive and negative effects on listeners, and it is unclear whether and how pause location influences the perception of fluency. In addition, whether pause location influences the perception of L2 speech in the same way as it does that of L1 speech remains unknown. In investigating the effects of native and nonnative disfluencies on listeners, Bosker, Quené, Sanders, and de Jong (Reference Bosker, Quené, Sanders and de Jong2014a) found that native ums elicited prediction of low-frequency referents, whereas nonnative ums did not, suggesting native and nonnative disfluencies can have different effects on listeners, and listeners adapt their predictive strategies based on speaker identity. Conversely, in Bosker, Tjiong, Quené, Sanders, and de Jong (Reference Bosker, Tjiong, Quené, Sanders and de Jong2015), both native and nonnative disfluencies enhanced recall accuracy, and in Bosker et al. (Reference Bosker, Quené, Sanders and de Jong2014b), when L1 and L2 speech were manipulated in terms of number and length of pauses, their fluency ratings were affected in a similar way.
THE CURRENT STUDY
Taken together, although results of utterance and perceived fluency show that pause phenomena are related to the perception of L2 fluency, both the relative contributions of the frequency, length, and distribution of silent pauses to perceived fluency and the role of pause location in perceived fluency have not been fully examined. Studies on L1 disfluency show that prosodic pauses typically occur at intonational phrase or clause boundaries; however, hesitant pauses occur when a speaker encounters difficulties in speech processing. In particular, recent studies have identified pauses within clauses or utterances as major characteristics of nonfluent L2 speech (de Jong, Reference de Jong2016; Kahng, Reference Kahng2014). However, the effects of pause location on L2 perceived fluency are unknown.
As discussed earlier, perceived fluency relates to a listener's inferences regarding a speaker's cognitive fluency (i.e., capacity to utilize the underlying cognitive processes that are responsible for speech production) based on their utterance fluency. Previous studies suggest that listeners seem to be sensitive to disfluencies, to have a general understanding that disfluency occurs when speakers are planning speech or experiencing processing difficulties, and to use the information on disfluency distribution for speech perception and comprehension. For instance, upon hearing disfluencies, listeners anticipated an upcoming short or long delay (Fox Tree, Reference Fox Tree2001), new as compared to given information (Arnold et al., Reference Arnold, Fagnano and Tanenhaus2003, Reference Arnold, Tanenhaus, Altmann and Fagnano2004), and an unknown object as compared to a known object (Arnold et al., Reference Arnold, Hudson Kam and Tanenhaus2007). Nevertheless, the studies that found disfluency advantages used pauses within a clause only and did not include pauses between clauses, leaving the effects of pause location on listeners unclear. A few studies on digit/word monitoring and recall in L1 suggest that pauses within clauses or nonstructural pauses may interfere with speech processing and comprehension; however, it is not yet known whether pause location influences the perception of L1 and L2 fluency. If listeners are sensitive to pause location and have an understanding that pauses within a clause tend to reflect reduced cognitive fluency (Bosker, Reference Bosker2014b), pause location is predicted to influence fluency ratings.
Building upon the previous studies, the current study aims to address the gaps and extend the body of research on perceived fluency through two experiments. Experiment 1 investigated the relative contributions of frequency, duration, and distribution of pauses to the perception of L2 fluency using multiple regression analysis. Experiment 2 examined a causal relationship between pause location and perceived fluency by constructing three conditions (no pause, pauses between clauses, and pauses within clauses conditions) through phonetic manipulations and compared fluency ratings of L1 and L2 speech in the three conditions.
EXPERIMENT 1
Experiment 1 investigated the relative contributions of frequency, duration, and distribution of silent pauses to fluency ratings. The research questions for Experiment 1 are as follows:
1. Which acoustic measures of pause phenomena (frequency, duration, and/or distribution of silent pauses) are significantly related to fluency ratings?
2. Does the distribution of pauses explain significantly additional variance of fluency ratings that is not explained by frequency and duration of silent pauses?
Based on previous studies on perceived fluency, frequency and duration of silent pauses are predicted to be correlated with fluency ratings. However, the relationship between the distribution of silent pauses and L2 perceived fluency has not been investigated; therefore, it is the main focus of Experiment 1. If listeners are sensitive to pause location and have an understanding that pauses within a clause tend to reflect reduced cognitive fluency, fluency ratings are likely to correlate not only with frequency and duration of silent pauses but also with distribution of silent pauses. In addition, if the regression model with the variable of pause distribution explains significantly larger variance of fluency ratings than the model without the variable of pause distribution, the result can be interpreted to reflect its critical role of pause distribution in perceived fluency.
In Experiment 1, English native listeners rated L2 speech samples on fluency level. The speech samples were also acoustically analyzed in terms of frequency, duration, and distribution of silent pauses. The relative contributions of the three aspects of pause phenomena to fluency ratings were examined through multiple regression analyses.
Method
Raters
Forty-six native English speakers (16 male, 30 female) participated in the experiment as raters. They were undergraduate students at a large university in the United States (M age = 21, SD = 2.3) and reported having normal hearing. Their mean familiarity with Korean accented English was 3.4 (SD = 1.7) on a scale of 1 (not familiar at all) to 9 (extremely familiar).
Stimulus description
Seventy-four L2 speech samples from 37 Korean speakers (10 male, 27 female) and 6 L1 speech samples from 3 English speakers (1 male, 2 female) were used. The mean age of the Korean speakers was 31.5 (SD = 6.5). Their length of residence in English-speaking countries ranged from 1 month to 8 years (M = 2.1, SD = 2.1). The Korean speakers also had a wide range of English proficiency levels, ranging from students in ESL beginner classes to graduate students in the United States who earned close to perfect scores on the internet-based Test of English as a Foreign Language. The 6 L1 speech samples served as reference points to which the listeners could compare the L2 speech. The 3 English speakers were undergraduate or graduate students at a large university in the United States. The speech samples were responses to two questions, one about their major field and the other about their free time activities. For presentation to the raters, 20-s excerpts were taken from approximately the middle of the original recordings (Bosker et al., Reference Bosker, Pinget, Quené, Sanders and de Jong2013; Derwing, Munro, & Thomson, Reference Derwing, Munro and Thomson2007). Each excerpt started and ended at a clause boundary. All the speech samples were normalized in Praat (Boersma & Weenink, Reference Boersma and Weenink2012) to have a mean intensity of 70 dB.
Procedure
The raters heard 80 speech samples in random order over headphones and rated their level of fluency using a 9-point scale with labeled extremes (1 = extremely disfluent, 9 = extremely fluent). The speech excerpts and the scale were presented to raters using Praat (Boersma & Weenink, Reference Boersma and Weenink2012). The scale appeared on the screen after each sample excerpt had been played; therefore, raters could rate each excerpt only after they heard the whole excerpt. Following Skehan and Tavakoli's (Skehan, Reference Skehan2003, Reference Skehan2009; Tavakoli & Skehan, Reference Tavakoli, Skehan and Ellis2005) taxonomy of utterance fluency (i.e., speed fluency, breakdown fluency, and repair fluency), the raters were asked to rate how easily and smoothly speech was delivered, focusing on features of fluency such as speed, pause, and repair phenomena, rather than in terms of overall proficiency (see Appendix A for the instructions). Before the actual experiment, each rater completed a practice session to ensure familiarity with the task. During the interactive practice session, 3 speech samples that were not included in the actual experiment were used to show them an example of extremely fluent, extremely disfluent, and medium fluent speech in all three aspects of utterance fluency (i.e., speed, pause, and repair phenomena).
In the experiment, speech samples were completely randomized for each rater. The experiment was conducted in a quiet room with a group of at most four raters per session. The rating experiment took about 40 min, and the raters were able to take a short break after rating half of the speech excerpts. After completing the rating experiment, the raters filled out a short questionnaire on their background information, familiarity with Korean accented English, and L2 learning and teaching experience.
Acoustic analysis of speech excerpts
In order to investigate relationships between fluency ratings and pause phenomena in speech, the L2 speech materials were analyzed acoustically. All speech excerpts were transcribed in detail including information regarding silent pauses. In the present study, any silence equal to or longer than 250 ms was identified as a silent pause and included in the analysis following de Jong, Groenhout, Schoonen, and Hulstijn (Reference de Jong, Groenhout, Schoonen and Hulstijn2015) and Goldman-Eisler (Reference Goldman-Eisler1968). Further support for 250 ms over 400 ms, which is another popular choice in L2 fluency studies, came from recent studies by de Jong and Bosker (Reference de Jong and Bosker2013) and Kahng (Reference Kahng2012). In de Jong and Bosker (Reference de Jong and Bosker2013), a lower cutoff point for silent pauses of 250–300 ms led to the highest correlation between the number of silent pauses and L2 proficiency scores. Kahng (Reference Kahng2012) compared the results of the analysis based on the two cutoff points for silent pauses and found that 400 ms missed 12% of the pauses identified by 250 ms. More important, 77% of the pauses that 400 ms missed were pauses within clauses. As pause distribution is the main focus of the present study, 250 ms was selected so as not to lose potentially important information.
The length of silent pauses was measured in milliseconds by listening to each speech excerpt and examining the waveform and spectrogram using Praat (Boersma & Weenink, Reference Boersma and Weenink2012), and the duration was added to the transcript. Pauses were also categorized, depending on their locations, as either within clauses or between clauses. A clause was required to consist minimally of a finite or a nonfinite verb with at least one other clause element such as a subject, object, or complement (Foster, Tonkyn, & Wigglesworth, Reference Foster, Tonkyn and Wigglesworth2000). Next, the frequency and duration of silent pauses were measured by number of silent pauses per minute (number of silent pauses/total spoken time including disfluencies, following Bosker et al., Reference Bosker, Pinget, Quené, Sanders and de Jong2013; de Jong et al., Reference de Jong, Groenhout, Schoonen and Hulstijn2015) and mean length of silent pauses, respectively. The distribution of silent pauses was operationalized by silent pause rate within a clause (number of silent pauses within clauses/number of clauses/number of words per clause) and silent pause rate between clauses (number of silent pauses between clauses/number of clauses/number of words per clause). The two distribution measures capture on average how often a speaker pauses within a clause and between clauses, respectively, and are normalized per word to take into account length of clauses. Between the two distribution measures, silent pause rate within a clause was of particular interest of the current study as hesitant pauses (vs. prosodic pauses) tend to reflect a speaker's reduced cognitive fluency.
Statistical analysis
To analyze the relative contributions of frequency, length, and distribution of silent pauses to fluency ratings, multiple regression analyses were conducted with fluency ratings as a dependent variable and the four measures on pause phenomena (i.e., number of silent pauses per minute, mean length of silent pauses, silent pause rate within a clause, and silent pause rate between clauses) as predictor variables. A log transformation was performed on mean length of silent pauses, silent pause rate within a clause, and silent pause rate between clauses so that the data could closely approximate the normal distribution.
Results of Experiment 1
The 46 raters evaluated 80 speech excerpts in terms of their level of fluency, and the interrater reliability and interrater agreement was high. The Cronbach α coefficient was 0.98 and the intraclass correlation coefficient (absolute agreement) was 0.93. I report both Cronbach α coefficients and intraclass correlation coefficients because the former measures internal consistency and reliability of the measure (treating the raters as items; Carr, Reference Carr2011) and the latter measures the extent to which the individual raters agree with one another in their ratings (Field, Reference Field, Everitt and Howell2005). For the intraclass correlation, I used a two-way random model as both the speakers and the raters were random effects (Larsen-Hall, Reference Larson-Hall2010). Table 1 shows the descriptive statistics of number of silent pauses per minute, mean length of silent pauses, silent pause rate within a clause, and silent pause rate between clauses and fluency ratings of L2 speech excerpts. As expected from a wide range of L2 proficiency, the L2 speakers demonstrated a range of performance in terms of frequency, duration, and distribution of silent pauses in Table 1.
Table 1. Descriptive statistics of pause phenomena and fluency ratings of second language speech

Table 2 shows Pearson correlations between the measures and fluency ratings. The correlation analysis shows that the frequency and length measures are not correlated with each other but the frequency and distribution measures are correlated, which seems natural considering that silent pause rate within a clause and silent pause rate between clauses are related to the number of silent pauses. Correlations between pause phenomena and fluency ratings demonstrated that all four measures are negatively correlated with ratings. In particular, silent pause rate within a clause exhibited the highest correlation with fluency ratings and number of silent pauses per minute had a moderately strong correlation with ratings.
Table 2. Correlations between the measures of pause phenomena and fluency ratings

Note: SPmin, number of silent pauses per minute; LngSP, mean length of silent pauses; SPRwc, silent pause rate within a clause; SPRbc, silent pause rate between clauses.
*p < .05. **p < .01.
A multiple linear regression analysis was performed in order to investigate to what extent each aspect of pause phenomena can explain the variance of the fluency ratings. Based on previous findings that pause frequency and duration are related to perceived fluency, the two variables were entered first and the measures of pause distribution were entered later so as to examine whether pause distribution can explain additional variance of ratings. Table 3 shows the results of the hierarchical multiple regression analysis.
Table 3. Results of a hierarchical multiple regression

Note: SPmin, number of silent pauses per minute; LngSP, mean length of silent pauses; SPRwc, silent pause rate within a clause; SPRbc, silent pause rate between clauses.
The results of the hierarchical multiple regression show that pause frequency explained 31% of the variance of the fluency ratings, and when pause length was added, it explained an additional 12% of the variance. Finally, silent pause rate within a clause was able to explain an additional 13% of the variance of the fluency ratings, and silent pause rate between clauses was able to explain another 5% of the variance of the fluency ratings. The four silent pause measures altogether were able to explain about 62% of the variance of the fluency ratings. In addition, to see the effects of the order in which predictors are entered into the model, a stepwise multiple regression was performed to compare the results based on a mathematical criterion with the results of the hierarchical multiple regression.
Table 4 shows that with the stepwise multiple regression, as silent pause rate within a clause had the highest correlation with fluency ratings (Table 2), it was entered into the model first and was able to explain over 54% of the variance of the fluency ratings by itself. Next, silent pause rate between clauses was entered and it explained an additional 6% of the variance; however, neither pause frequency nor pause length was able to explain significantly additional variance of the fluency ratings.
Table 4. Results of a stepwise multiple regression

Note: SPRwc, silent pause rate within a clause; SPRbc, silent pause rate between clauses.
In addition, a further regression analysis was conducted to test whether the distribution variables would still play an important role in the perceived fluency when a measure of speed was included in the model. A stepwise multiple regression was run with fluency ratings as a dependent variable and articulation rate (number of syllables/spoken time excluding pause time) and the four measures on pause phenomena (i.e., number of silent pauses per minute, mean length of silent pauses, silent pause rate within a clause, and silent pause rate between clauses) as predictor variables. The result showed that silent pause rate within a clause was entered into the model first as it still had the highest correlation with fluency ratings, explaining 54% of the variance of the fluency ratings by itself (p < .001). Next, articulation rate explained an additional 6.8% of the variance (p = .001) and silent pause rate between clauses an additional 3.3% of the variance (p = .016); however, neither pause frequency nor pause length did explain significantly additional variance of the fluency ratings. The three predictors altogether explained over 64% of the variance of the fluency ratings. Furthermore, using a hierarchical multiple regression analysis, even when articulation rate was entered into the model first, R 2 = .42, F (1, 69) = 50.337, p < .001, silent pause rate within a clause explained additional 19% of the variance (p < .001), and silent pause rate between clauses an additional 3% of the variance (p = .016), suggesting a critical role of pause distribution in the perception of fluency.
EXPERIMENT 2
The results of Experiment 1 showed that silent pause rate within a clause had the strongest correlation with fluency ratings, explaining 54% of the variance of fluency ratings. Experiment 2 further tested a causal relationship between pause location and perceived fluency through speech manipulations. The experiment specifically aims to answer whether pauses within clauses decrease fluency ratings compared to pauses between clauses. The research questions are as follows:
1. Is there a difference in fluency ratings of L1 speech when the speech has (a) no pause, (b) pauses between clauses, and (c) pauses within clauses?
2. Is there a difference in fluency ratings of L2 speech when the speech has (a) no pause, (b) pauses between clauses, and (c) pauses within clauses?
In Bosker et al. (Reference Bosker, Quené, Sanders and de Jong2014b), both L1 and L2 speech in the no pause condition were rated as more fluent than the short and long pause conditions. Therefore, in Experiment 2 of the current study, both L1 and L2 speech in the no pause condition are also predicted to be rated as more fluent than the pauses between clauses and pauses within clauses conditions. It is more important that, regarding the difference in ratings between the pauses between clauses and pauses within clauses conditions, if listeners are sensitive to pause location and have an understanding that pauses within a clause tend to reflect reduced cognitive fluency, then pauses within clauses are likely to lower fluency ratings compared to pauses between clauses. In addition, if fluency characteristics of L1 and L2 speech are judged by listeners in a similar way as they were for speed, and pause frequency and length in Bosker et al. (Reference Bosker, Quené, Sanders and de Jong2014b), pause location is likely to influence perceived fluency of both L1 and L2 speech in a similar fashion.
Method
Raters
Ninety-two native English speakers (20 male, 72 female) participated in the study as raters. They were undergraduate students at a large university in the United States (M age = 21, SD = 2.0) and reported having normal hearing.
Stimulus description
Twenty-four L1 and 24 L2 spontaneous speech samples recorded by 12 English speakers and 12 Korean learners of English were used, which had been collected for Experiment 1. The speech samples were responses to two questions, one about the speaker's major field and the other about their free time activities. The samples of the L1 and L2 speech samples were comparable in terms of mean syllable duration (L1: M = 246, SD = 23; L2: M = 263, SD = 22), t (22) = 1.908, p = .07; number of silent pauses per minute (L1: M = 29, SD = 5.3; L2: M = 30, SD = 5.3), t (22) = 0.737, p = .47; and mean length of silent pauses (L1: M = 467, SD = 69; L2: M = 519, SD = 91), t (22) = 1.471, p = .16. Fragments of approximately 20 s were excerpted from the middle of the original recordings (Bosker et al., Reference Bosker, Pinget, Quené, Sanders and de Jong2013; Derwing et al., Reference Derwing, Munro and Thomson2007). Each excerpt started and ended at a clause boundary.
Three conditions (no pause, pauses between clauses, and pauses within clauses) were created to test whether pauses within clauses lower fluency ratings compared to pauses between clauses or no pause. To test for a causal relationship between pause location and perceived fluency, the speech samples in the two conditions with pauses (i.e., pauses between clauses and pauses within clauses) should be different only in terms of pause location but should have the same number of pauses with the same length. Therefore to create the no pause condition, all the silent pauses in the speech samples were shortened to the length of around 150 ms (Bosker et al., Reference Bosker, Quené, Sanders and de Jong2014b). Next, stimuli for the pauses between clauses and pauses within clauses conditions were constructed by adding the same number of pauses with the same length either between clauses or within clauses depending on the condition, to the speech samples in the no pause condition. After examining all the speech samples, it was decided to add five pauses to them. Five was the optimal number of pauses in that all the speech samples could have five pauses within and between clauses naturally, without interrupting coarticulation. The length of pauses added was around 600 ms, which was close to the average pause length of the original speech samples and the average length of English speakers’ silent pauses in Kahng (Reference Kahng2014).
Following Foster et al. (Reference Foster, Tonkyn and Wigglesworth2000), a clause was required to consist minimally of a finite or nonfinite verb with at least one other clause element such as a subject, object, or complement. Examples of pauses between clauses are I performed in several plays [pause] I believe [pause] I have some talent in acting. Examples of pauses within a clause are: learn new [pause] things; so [pause] hard, to my [pause] place (see Appendixes B and C for more examples).
The speech samples were normalized in Praat (Boersma & Weenink, Reference Boersma and Weenink2012) to have a mean intensity of 70 dB. In addition, a small subtle white noise was added (33 dB) to the speech samples using the RandomGauss function in Praat (M = 0, SD = 0.001). This was done in order to normalize the background noise throughout and across the speech samples in an attempt to mask any possible trace of pause manipulations. The level of noise was very low and sounded like part of the original recordings; therefore, none of the raters noticed that a noise had been added to the speech samples. All the manipulated speech samples were evaluated for naturalness by two native English speakers and two advanced learners of English, and corrections were made, if necessary (e.g., changing pause locations). All the locations where a pause was added originally had a silence; therefore, none of the added pauses interrupted coarticulation. The stimuli were arranged according to a Latin square design, in which raters were presented with each item in only one condition, with three groups of raters for counterbalancing. A Latin square design was used because when raters hear the same speech excerpts more than once, the familiarity with the content of the speech excerpts is likely to affect their ratings. Table 5 demonstrates how speech samples were organized according to a 3 × 3 Latin square design. Twenty-four speakers were randomly assigned to one of the three speaker groups (i.e., S1, S2, S3) and each speaker group consisted of 4 L1 speakers and 4 L2 speakers. Ninety-two raters were also randomly assigned to one of the three rater groups (i.e., R1, R2, R3). For instance, raters in R1 heard speech samples of S1 in the no pause condition, speech samples of S2 in the pauses between clauses condition, and speech samples of S3 in the pauses within clauses condition. By doing so, raters listened to each speech sample in only one condition.
Table 5. A schematic representation of the 3 × 3 Latin square design

Note: No, no pause; B, pauses between clauses; W, pauses within clauses.
Procedure
As detailed above, 92 raters were randomly assigned to one of the three rater groups for counterbalancing. Each rater heard 48 manipulated speech samples produced by 24 speakers in random order over headphones and rated the level of fluency of the speaker using a 9-point scale with labeled extremes (1 = extremely disfluent, 9 = extremely fluent). As in Experiment 1, the speech excerpts and the scale were presented to raters using Praat (Boersma & Weenink, Reference Boersma and Weenink2012). The scale appeared on the screen after each sample excerpt had been played; therefore, raters could rate each excerpt only after they heard it completely. The raters were asked to rate how easily and smoothly speech was delivered, focusing on features of fluency such as speed, pause, and repair phenomena, rather than in terms of overall proficiency (see Appendix A for the instructions). Although only pause phenomena had been manipulated, raters were asked to pay attention not only to pause phenomena but also to the rest of the features of utterance fluency (i.e., speed fluency, breakdown fluency, and repair fluency), following Skehan (Reference Skehan2003, Reference Skehan2009) and Tavakoli and Skehan (Reference Tavakoli, Skehan and Ellis2005), in order to examine potential effects of pause manipulation on the overall fluency ratings, which approximates a language testing setting where overall fluency would be assessed. As in Experiment 1, before the actual experiment, there were 3 practice items so that raters could familiarize themselves with the procedure. In the experiment, speech samples were randomized for each rater. The procedure was conducted in a quiet room with a group of at most four raters per session. The rating experiment took about 35 min, and the raters were able to take a short break after rating half of the speech excerpts. After they finished rating, they filled out a short questionnaire on their background information, familiarity with Korean accented English, and L2 learning and teaching experience. Finally, they were also asked whether they had noticed anything particular or interesting about the speech excerpts, and none of them mentioned that the speech samples sounded unnatural or manipulated.Footnote 2
Analysis
The interrater agreement within the three rater groups was high (Cronbach α coefficients: 0.94, 0.93, 0.95; intraclass correlation coefficients in terms of absolute agreement: 0.89, 0.84, 0.91Footnote 3). In order to test whether the three pause conditions affected fluency ratings of L1 and L2 speakers’ speech, mixed-effects analyses of variance (ANOVAs) were performed with fluency ratings of L1 and L2 speakers’ speech as dependent variables using SPSS Statistics 17.0 (SPSS Inc., 2008). Mixed-effects ANOVAs were performed in order to test effects of fixed variable (i.e., condition) more accurately while taking into account effects of random variables such as speaker group and rater group.
Results of Experiment 2
Figure 1 illustrates the means and standard errors of fluency ratings of L1 and L2 speech in the three conditions. The figure shows that the L1 speech excerpts were rated higher than the L2 speech excerpts. It also shows that for both L1 and L2 speech, ratings of the pauses between clauses and pauses within clauses conditions are lower than ratings of the no pause condition. Ratings of the pauses within clauses condition seem lower than those of the pauses between clauses condition for both L1 and L2 speech; however, the difference between the two conditions seems larger for L2 speech. In order to examine statistical differences between the three conditions for L1 and L2 speech, a mixed-effects ANOVA was conducted with fluency ratings of L1 and L2 speakers’ speech as dependent variables.
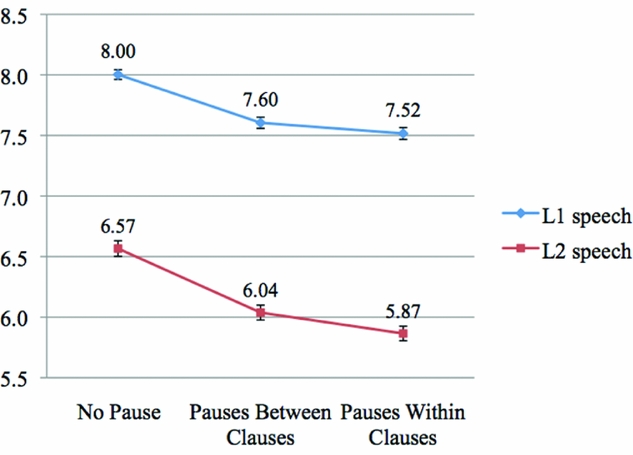
Figure 1. Means and standard errors of fluency ratings of first language (L1) and second language (L2) speech.
A mixed-effects ANOVA was run with ratings of speech excerpts as a dependent variable, condition and language as fixed variables, and speaker group, rater group, and topic as random variables. The results showed that there was a main effect of condition, F (2, 4261) = 67.809, p < .001, ηp2 = 0.031, language, F (1, 4261) = 1223.794, p < .001, ηp2 = 0.223, speaker group, F (2, 4261) = 39.138, p < .001, ηp2 = 0.018, and rater group, F (2, 4261) = 12.036, p < .001, ηp2 = 0.006, but no significant effect of topic, F (1, 4,261) = 0.910, p = .340, ηp2 < 0.001. The interaction between condition and language did not reach statistical significance, F (2, 4,261) = 2.422, p = .089, ηp2 = 0.001. To examine significant differences between the three conditions, Tukey honestly significant difference post hoc tests were performed. The results showed that speech samples in the pauses between clauses (p < .001) and pauses within clauses conditions (p < .001) were rated significantly lower than speech samples in the no pause condition. Furthermore, speech samples in the pauses within clauses condition were rated significantly lower than those in the pauses between clauses condition (p = .048). Their mean familiarity with Korean accented English was 3.7 (SD = 2.0) on a scale of 1 (not familiar at all) to 9 (extremely familiar). Raters’ level of familiarity with Korean accented English did not correlate with their fluency ratings (r = .04).
DISCUSSION
In order to find the speech features that influence L2 perceived fluency, a number of studies have investigated the relationship between utterance fluency and perceived fluency (e.g., Bosker et al., Reference Bosker, Pinget, Quené, Sanders and de Jong2013; Cucchiarini et al., Reference Cucchiarini, Strik and Boves2000, Reference Cucchiarini, Strik and Boves2002; Derwing et al., Reference Derwing, Rossiter, Munro and Thomson2004; Kormos & Deńes, Reference Kormos and Deńes2004; Rossiter, Reference Rossiter2009) and suggested importance of silent pauses on perceived fluency. However, both the relative contributions of the frequency, length, and distribution of silent pauses to perceived fluency and the role of pause location in perceived fluency have not been fully examined. The current study aimed to fill these gaps and extend the body of research on perceived fluency using two experiments.
Experiment 1 examined the relative contributions of frequency, length, and distribution of silent pauses to perceived fluency. The first research question of Experiment 1 was which acoustic measures of pause phenomena (frequency, duration, and/or distribution of silent pauses) are significantly related to fluency ratings. The distribution of silent pauses was operationalized by silent pause rate within a clause and silent pause rate between clauses, which reflect on average how often a speaker pauses within a clause and between clauses, respectively, and are normalized per word to take into account length of clauses. Between the two distribution variables, silent pause rate within a clause was of particular interest of the current study as hesitant pauses (vs. prosodic pauses) tend to reflect a speaker's reduced cognitive fluency. The results showed that fluency ratings were significantly correlated with all measures: frequency (r = –.555), duration (r = –.339), and distribution of silent pauses: silent pause rate within a clause (r = –.745) and silent pause rate between clauses (r = –.447). It is especially noteworthy that silent pause rate within a clause exhibited the strongest correlation with fluency ratings among the pause variables. The second research question of Experiment 1 was whether pause distribution explains significantly additional variance of fluency ratings that is not explained by frequency and duration of silent pauses. The hierarchical multiple regression analysis showed that the regression model with pause frequency and length explained 43% of the variance of fluency ratings and silent pause rate within a clause, and silent pause rate between clauses were able to explain about 13% and 5% of additional variance of fluency ratings, respectively. The explanatory power of silent pause rate within a clause was confirmed by the results of the stepwise regression analysis; it was able to explain 54% of variance of fluency ratings alone, whereas frequency and duration of silent pauses did not explain additional variance of the fluency ratings. Furthermore, it was also tested whether the distribution, in particular, silent pause rate within a clause, would still play an important role in the perceived fluency when another strong predictor of perceived fluency, measure of speed or articulation rate (e.g., comparable to mean length of syllables in Bosker et al., Reference Bosker, Pinget, Quené, Sanders and de Jong2013) was included in the model. Even when articulation rate was entered into the model first, silent pause rate within a clause explained an additional 19% of the variance, suggesting a critical role of pause distribution in the perception of fluency.
Experiment 2 examined whether pause location influences perceived fluency of L1 and L2 speech. In order to test a causal effect of pause location on fluency ratings of L1 and L2 speech, three conditions were constructed: no pause, pauses between clauses, and pauses within clauses conditions. To examine effects of pause location on perceived fluency directly, the speech samples in the pauses between clauses and pauses within clauses conditions were prepared by adding the same number of pauses with the same length, either within clauses or at clause boundaries depending on the condition, to the speech samples in the no pause condition. The research question was whether there is a difference in fluency ratings when the L1 and L2 speech had (a) no pause, (b) pauses between clauses, and (c) pauses within clauses. The results showed that both L1 and L2 speech in the no pause condition were rated to be more fluent than those in the pauses between clauses and pauses within clauses conditions. It is more important that, regarding the main focus of Experiment 2, the effect of pause location on fluency ratings, both L1 and L2 speech in the pauses between clauses condition were rated to be more fluent than those in the pauses within clauses condition.
The findings of both Experiments 1 and 2 suggest a significant role of pause location in perceived fluency. In Experiment 1, silent pause rate within a clause was the strongest predictor of perceived fluency, and in Experiment 2, pauses within clauses lowered fluency ratings of L1 and L2 speech compared to pauses between clauses. The findings suggest that listeners are sensitive to pause location and seem to have an understanding that pauses within a clause tend to reflect reduced cognitive fluency. The results are consistent with L1 research on pause phenomena that suggests that pause location affects speech perception. Silent pauses are one of the acoustic cues to clausal units along with pitch and vowel duration (Seidl & Cristià, Reference Seidl and Cristià2008). Silent pauses at grammatical boundaries are claimed to help listener comprehension by indicating the boundaries of speech to be analyzed, and by providing cognitive processing time (e.g., Arons, Reference Arons1993; Griffiths, Reference Griffiths1991; Reich, Reference Reich1980, Sugito, Reference Sugito1990), whereas pauses within clauses may be disrupting. In Reich (Reference Reich1980), propositions were recalled more accurately in sentences containing pauses between clauses than in sentences containing pauses within clauses.
The results might appear contradictory to previous studies that found positive effects of disfluencies on listeners. Disfluencies have been shown to have positive effects on listeners’ attention to upcoming words (Bosker et al., Reference Bosker, Tjiong, Quené, Sanders and de Jong2015), word recognition speed (Corley & Hartsuiker, Reference Corley and Hartsuiker2011), syntactic parsing (Brennan & Schober, Reference Brennan and Schober2001; Fox Tree, Reference Fox Tree2001), recognition memory (Corley et al., Reference Corley, MacGregor and Donaldson2007; MacGregor et al., Reference MacGregor, Corley and Donaldson2010), and predictive strategies (Arnold et al., Reference Arnold, Fagnano and Tanenhaus2003, Reference Arnold, Tanenhaus, Altmann and Fagnano2004, Reference Arnold, Hudson Kam and Tanenhaus2007). However, it should be noted that disfluencies have been shown to have negative effects on general impressions about the speaker. In Christenfeld (Reference Christenfeld1995), filled pauses made speech sound less eloquent, and silent pauses made a speaker seem more anxious. In Fox Tree (Reference Fox Tree2002), when speakers used silent and/or filled pauses, they were thought to have production difficulty, be less honest, and be less comfortable with topics at hand. Similarly, Bosker et al. (Reference Bosker, Quené, Sanders and de Jong2014b) showed that both native and nonnative speech samples that had fewer or shorter pauses were judged to sound more fluent. As Bosker (Reference Bosker2014) pointed out, the positive and negative effects of disfluency seem to result from different listener considerations. L1 and L2 disfluencies have negative effects on perceived fluency because listeners seem to understand that disfluencies especially within a clause are symptoms of speech production difficulty. In spite of the negative effects, listeners seem to be able to use the symptoms of speaker difficulty to expect upcoming content to be relatively more complex, such as low-frequency words, a new versus old referent (Arnold et al., Reference Arnold, Fagnano and Tanenhaus2003, Reference Arnold, Tanenhaus, Altmann and Fagnano2004), and an unknown versus known object (Arnold et al., Reference Arnold, Hudson Kam and Tanenhaus2007).
The findings of the study further have potential implications for L2 education and assessment. Finding reliable oral correlates of fluency can help to improve learners’ oral fluency and to develop a more valid assessment tool to measure oral fluency and proficiency in L2 speech. One of the novel and important findings of the current study is that pauses within clauses have a crucial impact on the perception of fluency. Based on the finding, one of the ways teachers can help L2 learners to enhance L2 fluency is to provide ample opportunities to practice collocations and formulaic language, which can enable learners to produce longer fluent runs and decrease pauses within clauses in their speech. In terms of L2 assessment, most automated speech scoring systems include measures of speed and frequency and length of pauses but not pause location (e.g., ETS's SpeechRater™; Xi, Higgins, Zechner, & Williamson, Reference Xi, Higgins, Zechner and Williamson2008). Considering a strong explanatory power of pause location for perceived fluency, including a measure that addresses the frequency of silent pauses within clauses, could further improve automatic fluency assessment.
APPENDIX A
INSTRUCTIONS FOR THE EXPERIMENT
Your task is to listen to native and nonnative speech samples and rate them in terms of their fluency using a 9-point scale:
1 = extremely disfluent to 9 = extremely fluent
In this study, fluency refers to how easily and smoothly speech is delivered, not overall proficiency. Please make your judgments based on factors such as
• speech rate
• silent and filled pauses (e.g., um and uh)
• hesitations and/or corrections
• overall flow of speech
• NOT grammar or vocabulary
The following are the two questions the speakers answered:
1. What is your major? What is it about? Do you like it? Why or why not?
2. What do you like to do in your free time?
Each stimulus is about 20 s long and was excerpted from approximately the middle of the original recordings.
APPENDIX B
Example waveforms of the speech manipulations

Figure B.1. Speech in the no pause condition.

Figure B.2. Speech in the pauses between clauses condition.
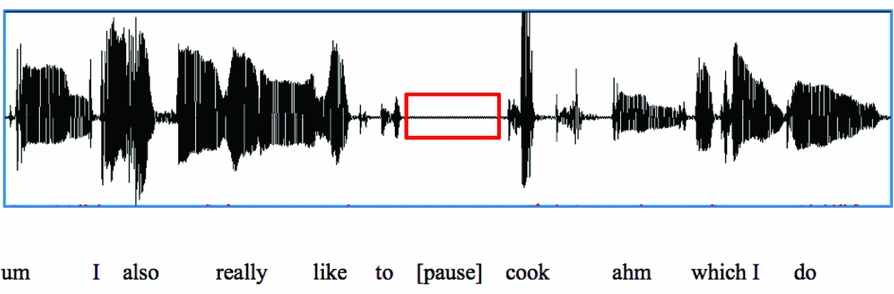
Figure B.3. Speech in the pauses within clauses condition.
APPENDIX C
An example of addition of pauses to a speech sample
In my free time, which is [PWC] very limited now that I'm a graduate student [PBC],
I [PWC] like to do yoga [PBC] ahm [PBC] or go running or biking [PBC]
Um I also really like to [PWC] cook [PBC]
Ahm which I do [PWC] almost every day but not [PWC] too much
Here [PWC] represents a pause within a clause and [PBC] represents a pause between clauses.
ACKNOWLEDGMENTS
This research was supported by a Dissertation Completion Fellowship from the Graduate School of Michigan State University and a Dissertation Grant from Language Learning. I am grateful to Debra Hardison, Susan Gass, Patti Spinner, Paula Winke, Aline Godfroid Karthik Durvasula, and the anonymous reviewers for their insightful comments.