


Introduction
Dairy farming has intensified worldwide over the last 50 years (FAO, 2019) with agricultural policy having a profound impact on both the economic returns on farms and the evolution of farming systems over time (McGregor and Houston, Reference McGregor and Houston2018; Clay et al., Reference Clay, Garnett and Lorimer2020). From its entry into the European Economic Community, hereafter referred to as the European Union (EU) in 1973 until 1984, Irish national milk production doubled (Teagasc, 2015). This growth in production was driven almost exclusively by productivity gains with milk yield increasing by 4% per annum in the decade from 1974 while the size of the national herd only increased by 1% per annum (Teagasc, 2015). Following the introduction of milk quota regulations on 1 April 1984 and up until their abolition on 31 March 2015, national milk production was effectively static while considerable structural and productivity change took place at farm level nationally. This included a 78% reduction in the number of dairy farms, a 48% increase in milk production per cow, a 350% increase in average herd size and a 470% increase in milk production per farm (Teagasc, 2015). Between the calendar years 2015 (the year in which milk quotas were abolished) and 2017, Irish dairy farmers increased milk production by 29% (FAO, 2019). Such an increase in milk production was underpinned by a 17% increase in the size of the national dairy herd, a 10% increase in milk yield per cow (CSO, 2019) and a 2% increase in farm stocking rate (Teagasc, 2019). Unlike most dairy industries worldwide where such intensification resulted in a shift to more confinement-based production models (Clay et al., Reference Clay, Garnett and Lorimer2020), the Irish dairy industry has remained a traditional pasture-based dairy production system throughout this transition (Teagasc, 2019).
From a grassland production perspective, the shift to more intensive livestock systems has put more pressure on grasslands used for pasture (Plantureux et al., Reference Plantureux, Bernués, Huguenin-Elie, Hovstad, Isselstein, McCracken, Therond and Vackar2016). The optimal management protocol for grazing systems has been well documented (Roche et al., Reference Roche, Berry, Bryant, Burke, Butler, Dillon, Donaghy, Horan, Macdonald and Macmillan2017). The majority of pasture-based systems are located in temperate climatic zones and are, therefore, further complicated by the variable seasonal nature of pasture growth and feed quality (Roche et al., Reference Roche, Berry, Bryant, Burke, Butler, Dillon, Donaghy, Horan, Macdonald and Macmillan2017). To facilitate an alignment of feed supply and animal requirements, cows are calved during a short 8 to 12-week window in spring before peak pasture growth. This ensures that peak herd demand coincides with peak pasture supply and that the period of minimum feed demand for the herd coincides with the period of lowest pasture production (Dillon et al., Reference Dillon, Hennessy, Shalloo, Thorne and Horan2008). To further intensify such systems, strategies such as increasing overall operational scale (Clay et al., Reference Clay, Garnett and Lorimer2020), increasing milk production per cow via increased concentrate supplementation (Ma et al., Reference Ma, Renwick and Bicknell2018) and increasing stocking intensity (Macdonald et al., Reference Macdonald, Beca, Penno, Lancaster and Roche2011) are among the most commonly evaluated. Recent principal component analyses have highlighted the critical importance of increased pasture utilization to farm profitability in grazing systems in Ireland during the EU milk quota period (Ramsbottom et al., Reference Ramsbottom, Horan, Berry and Roche2015; Hanrahan et al., Reference Hanrahan, McHugh, Hennessy, Moran, Kearney, Wallace and Shalloo2018).
The recent abolition of EU milk quotas has created an opportunity to redesign and intensify production within Irish grazing systems, free from the confinement of milk quotas. Increasing milk production per hectare (ha) in grazing systems could, in theory, dilute costs and increase profitability, provided the costs of increased production are less than the price received for additional milk (Macdonald et al., Reference Macdonald, Penno, Lancaster, Bryant, Kidd and Roche2017). Increased production from pasture-based dairy farms can be realized by increasing stocking rate, increasing imported concentrate feed supplementation, increasing overall farm operation scale or through a combination of these strategies. During the initial period of transition to a derestricted milk production environment, the objectives of this analysis were to characterize the physical and financial trends on a matched dataset of spring calving pasture-based dairy farms and to evaluate the physical and financial impacts of different expansion approaches on Irish commercial dairy farms.
Materials and methods
Farm physical data
Data used in the present study were obtained from the Irish national dairy farm database (eProfit Monitor [ePM], Teagasc, Republic of Ireland). The database was established in 2002 and contains farm physical and financial data for the dairy and other enterprises of approximately 4000 individual dairy farmer users (Ramsbottom et al., Reference Ramsbottom, Horan, Berry and Roche2015). Dairy farmer users of ePM are, on average, larger scale, more intensive and more profitable than the average dairy farmer surveyed annually through the National Farm Survey (Hennessy et al., Reference Hennessy, O'Dwyer, Connolly, Ramsbottom and Moran2015). In the present study, farm physical and financial performance data were extracted for 868 seasonal calving dairy farmers who were continuous users of the programme during each of the years 2013–2017, inclusive.
Monthly numbers of cows, replacement heifers and non-dairy stock per farm were averaged across each calendar year to determine average livestock units (LU) for each of the three respective livestock categories (>2 years old = 1 LU; 1–2 years old = 0.7 LU and 0–1 year old = 0.3 LU). Farm stocking rate was calculated by dividing the total area (hectares; ha) of forage (pasture and forage crop area combined) utilized by the total number of LU on the farm. The percentages of each type of livestock farmed were calculated by dividing the annual average number of LU in each category by the total number of LU on the farm each year.
Total milk produced per farm (litres) was divided by the average dairy cow LU (i.e. >2 years old) present on the farm to calculate average milk yield/cow per year. Average annual milk fat and protein content were obtained from the milk processor and used to calculate the lactational yield of milk fat and protein. When referring to whole farm performance, per ha calculations were obtained by dividing the relevant value by the total number of ha farmed.
Using the farm physical data, farms were categorized into quartiles (from least to greatest) on the basis of the level of increase in total farm fat and protein production for the average of 2016 and 2017 compared to the average produced during 2013 and 2014. Further analysis identified the physical and financial performance of farms that had, over the same periods increased farm production by increasing farm stocking rate, increased milk fat and protein production per cow, increased farming scale (area farmed) or combinations of two or of all three of these methods of production expansion. For each of the three metrics, increases of >10% put them into the ‘increased’ category. So, for example, where farm stocking rate increased by >10% between the average of 2013 and 2014 compared to the average of 2016 and 2017, the farm was categorized as having an increased stocking rate.
Farm financial data
All financial data are expressed in euro (€) unless otherwise stated. Contemporary market values were used where animals were purchased or sold off farm. Where transfers from the dairy herd to the heifer or dry stock enterprises took place within the farm, standard monetary values per animal were used for all farms and years. Dairy cows were valued at €700 each; newborn replacement and beef calves transferred from the dairy enterprise were valued at €300 and €150 per head, respectively. Similarly, the standard cost of €1000 per head was used where pre-calving replacements were transferred to the dairy enterprise. Farm gross output was calculated by combining milk sales receipts, dairy and beef cattle sales and other sales such as crop or forage sales, and the standard value of calf transfers to beef and replacement heifer enterprises. The cost of purchased in-calf dairy heifers and cows or the standard value of in-calf heifers transferred from the farm's replacement heifer enterprises were deducted, and an adjustment made for stock inventory change, where applicable. This new variable will be referred to as ‘gross output’.
Variable costs include feed and fertilizer, breeding and veterinary costs, and farm contractor costs, as well as other variable costs such as milk recording, parlour expenses and bedding costs (Teagasc, 2011). Most of the other variable costs were apportioned in the ePM system on a percentage livestock unit basis. For example, if the dairy enterprise accounted for 60% of the farm's total LU, then 60% of the total variable costs were allocated to the dairy enterprise. Fixed costs include machinery running and lease costs, hired labour, repairs and maintenance, interest on short-term and long-term loans, depreciation, electricity, phone and transportation expenses, as well as the costs of leasing land and milk quota (where applicable). For all enterprises, fixed costs were allocated in proportion to the percentage of the farm's gross revenue output attributed to the enterprise.
Farm net profit was calculated as the profit remaining to reward the farm owner/operator and principal repayments after all variable and fixed costs were deducted from the gross revenue output. Farm net profit/ha was calculated by dividing total farm net profit by the total number of ha farmed. Excluded from the calculations of farm net profit were family labour cost, premia payments (the farming subsidies paid to dairy farmers from the Irish Government and the EU to support farming income) and the opportunity cost of the capital employed. The total value of these payments would not change irrespective of the expansion strategy adopted and was excluded from the calculations of farm net profit. Five geographical regions were identified based on the geographical distribution of dairy production which differ in their seasonal production of pasture and rainfall as detailed in Ramsbottom et al. (Reference Ramsbottom, Horan, Berry and Roche2015). The regions were farms from county Cork (the Cork Region); farms from counties Dublin, Kildare, Laois, Longford, Louth, Meath, Offaly, North Tipperary, Westmeath and Wicklow (the Midlands Region); farms from counties Cavan, Clare, Donegal, Galway, Leitrim, Mayo, Monaghan, Roscommon and Sligo (the Northwest Region); farms from counties Carlow, Kilkenny, South Tipperary, Waterford and Wexford (the South East Region); and farms from counties Kerry and Limerick (the South West Region).
Data analyses
The statistical methods used in this analysis have been reported previously by Ramsbottom et al. (Reference Ramsbottom, Horan, Berry and Roche2015). All analyses were undertaken using a mixed-model framework in PROC MIXED (SAS, 2005) where herd nested within the region was included as a repeated effect with a first-order autoregressive covariance structure assumed among records within the herd. The first analysis attempted to estimate the annual least-squares means and thus the longitudinal trends in physical and financial performance over time; fixed effects included in the model were year and region. The second series of analyses attempted to quantify the association between quartile of expansion in milk production and the various physical and financial characteristics; fixed effects included in the model were year, region, as well as the interaction between expansion quartile and year. A third series of analyses was conducted to quantify the association between the changes made and the various physical and financial characteristics (i.e. dependent variables); fixed effects included in the model were year, region, change category as well as the interaction between change category and year.
Results
Inter-year variability in physical and financial performance on pasture-based dairy farms
Summary statistics for a range of performance parameters for the 868 spring-calving farms over a 5-year period are presented in Table 1. There were increases in farming intensity, specialization and scale during the 5-year study period. The total area farmed and the area of the milking platform increased over the period by 12 and 14%, respectively, while the scale of the dairy enterprise increased by 27% to 170 LU. The farms also became more specialized in dairying over the study period as the proportion of dairy cows and replacements increased by 2.8 percentage units over the 5-year period and comprised 92.8% of all animals on the study farms in 2017.
Table 1. Least-squares means for measured biological characteristics for a matched sample of seasonal spring-calving, pasture-based dairy farms (n = 868) during the years 2013–2017, inclusive

Different letters in the row indicate significant differences (P < 0.05).
1 Pooled standard error.
2 Livestock units – 1 LU is the equivalent of a mature animal; one 0–1 year old animal and one 1–2 year old animal are the equivalent of 0.3 and 0.7 LU, respectively.
Production increases were evident on all farms over the study period. Stocking rate increased (P < 0.001) to 2.34 LU/ha in 2017, while milk production increased (P < 0.001) by 27% to 15 232 litres/milking platform ha. Milk fat and protein yield increased (P < 0.001) by 13.3 and 12.3%, respectively, per cow per year to 247 and 207 kg per cow, respectively. Furthermore, pasture DM utilized/ha increased (P < 0.001) to 10.0 t DM/ha and was 22% greater (P < 0.001) in 2017 than in 2013. The number of dairy cows and replacements (years 1 and 2, combined) increased by 33 and 10%, respectively, on the studied farms, while the proportion of dairy livestock as a proportion of total livestock increased by 3%. The overall genetic potential of the herd (EBI; ICBF 2020) rose substantially during the study period (from €69 in 2013 to €114 in 2017) which would have contributed to the increase in milk production per cow observed. In consequence, both milk production (per cow, per ha and per farm) and milk composition increased annually over the period culminating in a 51% increase in total fat plus protein production per farm during the study period.
Both farm output (P < 0.001) and costs (P < 0.001) increased between 2013 and 2017 (Table 2). While average milk price was 35.5 c/l during the study, it ranged from a low of 28.4 c/l in 2016 to a peak of 40.2 c/l in 2013. In consequence, gross output (c/l) peaked at 48.1 c/l in 2013, declined each year to a minimum of 35.1 c/l in 2016 and rebounded to 44.1 c/l in 2017. Similarly, both variable and fixed costs (c/l) declined by 23% between 2013 and 2016 and remained at a low level (25.9 c/l) in 2017. As a consequence, net farm profit (c/l) was highest (P < 0.001) in 2017 (18.2 c/l) and least in 2016 (9.8 c/l). Similar temporal trends are evident both per cow and per ha with the highest profit realized in 2017 (€1023/cow and €1744/ha), and lowest in 2016 (€536/cow and €878/ha). Net farm profit as a percentage of farm gross output averaged 34.2% and ranged from 27.8% in 2016 to 41.3% in 2017. Finally, overall farm net profit was highly variable during the 5-year period and was greatest (P < 0.001) in 2017 (€133 836) and least (P < 0.001) in 2016 (€65 176).
Table 2. Least-squares means for measured biological characteristics for a matched sample of seasonal spring-calving, pasture-based dairy farms (n = 868) during the years 2013–2017, inclusive

Different letters in the row indicate significant differences (P < 0.05).
1 Pooled standard error.
2 Average price paid per litre of milk sold to the milk processor.
3 Gross output was calculated by combining farm sales receipts and the standard value of calf transfers to beef and replacement heifer enterprises minus the cost of purchased in-calf dairy heifers and cows or the standard value of in-calf heifers transferred from the farm's replacement heifer enterprises with an adjustment made for stock inventory change, where applicable.
The effect of level of dairy expansion on farm physical and financial characteristics
Summary statistics for a range of performance parameters for the 868 spring-calving farms categorized into quartiles (Q1, Q2, Q3 and Q4) based on an increasing total production of fat and protein between 2013/2014 and 2016/2017 are presented in Table 3. Expansion in milk production was highly variable increasing by 7, 25, 44 and 86% for Q1 to Q4 between 2013/2014 and 2016/2017 (Table 3). Farms that subsequently had the biggest increase in milk production were originally (2013/2014) larger farms with higher total milk fat plus protein production, more dairy cows, a lower overall SR and a lower milk yield per cow in the herd. On farms with the biggest increases in milk production (Q2, Q3 and Q4), the area farmed (ha) increased by 6, 7 and 20%, respectively, whereas the area farmed reduced for Q1 farms (−1%). The farms with the greatest increase in milk production also had the greatest increase in cow numbers, farm stocking rate and milk production per cow (59, 10 and 17%, respectively) between 2013/2014 and 2016/2017 (P < 0.001). Similarly, Q1 farms had the smallest increase in cow numbers, farm stocking rate and milk production per cow (4, 2 and 2%, respectively) between the same two periods (P < 0.001). Both purchased feed and pasture utilization also varied significantly (P < 0.001) among Q groups. Though pasture utilization increased for all groups over the comparison periods, the absolute level of increase varied from 9% for Q1 to 13, 19 and 20% for Q2, Q3 and Q4, respectively. In contrast, purchased feed and forage use declined by 20, 13 and 6% for Q1, Q2 and Q3 and increased by 3% for Q4.
Table 3. Least-squares means for area farmed (ha), herd size (dairy LU/farm), farm stocking rate (LU/ha farmed), milk yield (kg fat and protein/cow), pasture utilized (t DM/ha) and purchased feed and forage (kg DM/cow) for a matched sample of seasonal spring-calving, pasture-based dairy farms categorized by an increase in production of fat and proteina (n = 868) between the periods 2013–2014 and 2016–2017, inclusive

a Ranked by quartile from least to greatest increase in production of milk fat and protein between the average of 2013 and 2014 compared to the average produced in 2016 and 2017.
b Pooled standard error.
Expansion rate (Q1–4) had a significant effect on farm financial performance (Table 4). The effect on farm gross output (€/ha) was variable ranging from a reduction of 9 and 3% for Q1 and Q2, respectively, to an increase of 7 and 17%, respectively, for Q3 and Q4. Unlike Q4 farms which experienced a 5% increase in variable costs (€/ha) over the study period, total variable costs declined on Q1, Q2 and Q3 farms (−15, −9 and −2%, respectively). In contrast, only Q1 farms experienced a reduction in fixed costs (−7%) with increases evident for Q2, Q3 and Q4 (4, 8 and 15%, respectively). Consequently, net profit (€/ha) declined for Q1 farms (−7%), was unchanged for Q2 and increased for Q3 and Q4 (17 and 32%, respectively). Similarly, total farm profit (€/farm) declined for Q1 farms between 2013/2014 and 2016/2017 (€−5257; −7%) and increased for Q2 (€3046; 4%), Q3 (€20 810; 25%) and Q4 (€51 604; 62%).
Table 4. Least-squares means for farm gross output (€/farm), total variable costs (€/ha), total variable costs (€/ha), net profit (€/ha) and net profit (€/farm) for a matched sample of seasonal spring-calving, pasture-based dairy farms categorized by an increase in milk productiona (n = 868) between the periods 2013–2014 and 2016–2017, inclusive
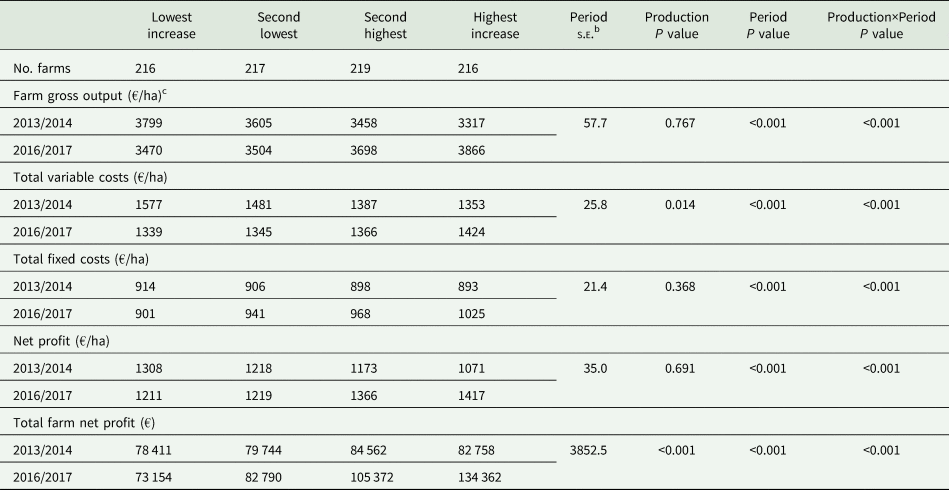
a Ranked by quartile from least to greatest increase in production of milk fat and protein between the average of 2013 and 2014 compared to the average produced in 2016 and 2017.
b Pooled standard error.
c Gross output per was calculated by combining farm sales receipts and the standard value of calf transfers to beef and replacement heifer enterprises minus the cost of purchased in-calf dairy heifers and cows or the standard value of in-calf heifers transferred from the farm's replacement heifer enterprises with an adjustment made for stock inventory change, where applicable.
Effect of milk production expansion strategy on biological and financial performance
The impact of alternative expansion strategies (SR, milk yield per cow, farming scale) or/and combinations of strategies on milk production performance between 2013/2014 and 2016/2017 is illustrated in Figs 1 and 2. A total of 675 farms (78% of study farms) had an increase of 10% in one or more of the three strategies which equated to an increase in SR of 0.22 LU/ha, in milk yield per cow of 40 kg fat and protein, or an additional 7 ha of overall farm size. Among expanding farms, 348 farms (52%) increased stocking rate; 440 farms (65%) increased milk yield per cow; and 212 farms (31%) increased area farmed. Sixty-three per cent of the expanding farms (n = 374) increased either stocking rate, milk yield per cow or area farmed alone increasing farm milk production by an average of 29, 35 and 37%, respectively (Fig. 1; P < 0.001) in 2016/2017 compared to 2013/2014. Forty-one per cent of expanding farms (n = 277) adopted two strategies to increase milk production. Increasing stocking rate and milk yield per cow (n = 161), stocking rate and area farmed (n = 26), or milk yield per cow and area farmed (n = 90) resulted in increases in farm milk production of 55, 60 and 65%, respectively (P < 0.001). Using all three strategies to increase farm milk production was practised on 5% of expanding study farms (n = 24) and resulted in an increase in farm milk production of 87% (P < 0.001).

Fig. 1. The effect of various expansion strategies on milk fat plus protein production (a) per hectare and (b) per farm in the 2 years immediately preceding (2013/2014) and following (2016/2017) European Union milk quota abolition. SR = Farms increasing milk production by increasing stocking rate only; MY = Farms increasing milk production by increasing milk yield per cow only; Area = Farms increasing milk production by increasing area farmed only; SR×MY = Farms increasing milk production by increasing both SR and MY; SR×Area = Farms increasing milk production by increasing both SR and Area; MY×Area = Farms increasing milk production by increasing both MY and Area; SR×MY×Area = Farms increasing milk production by increasing SR, MY and Area.
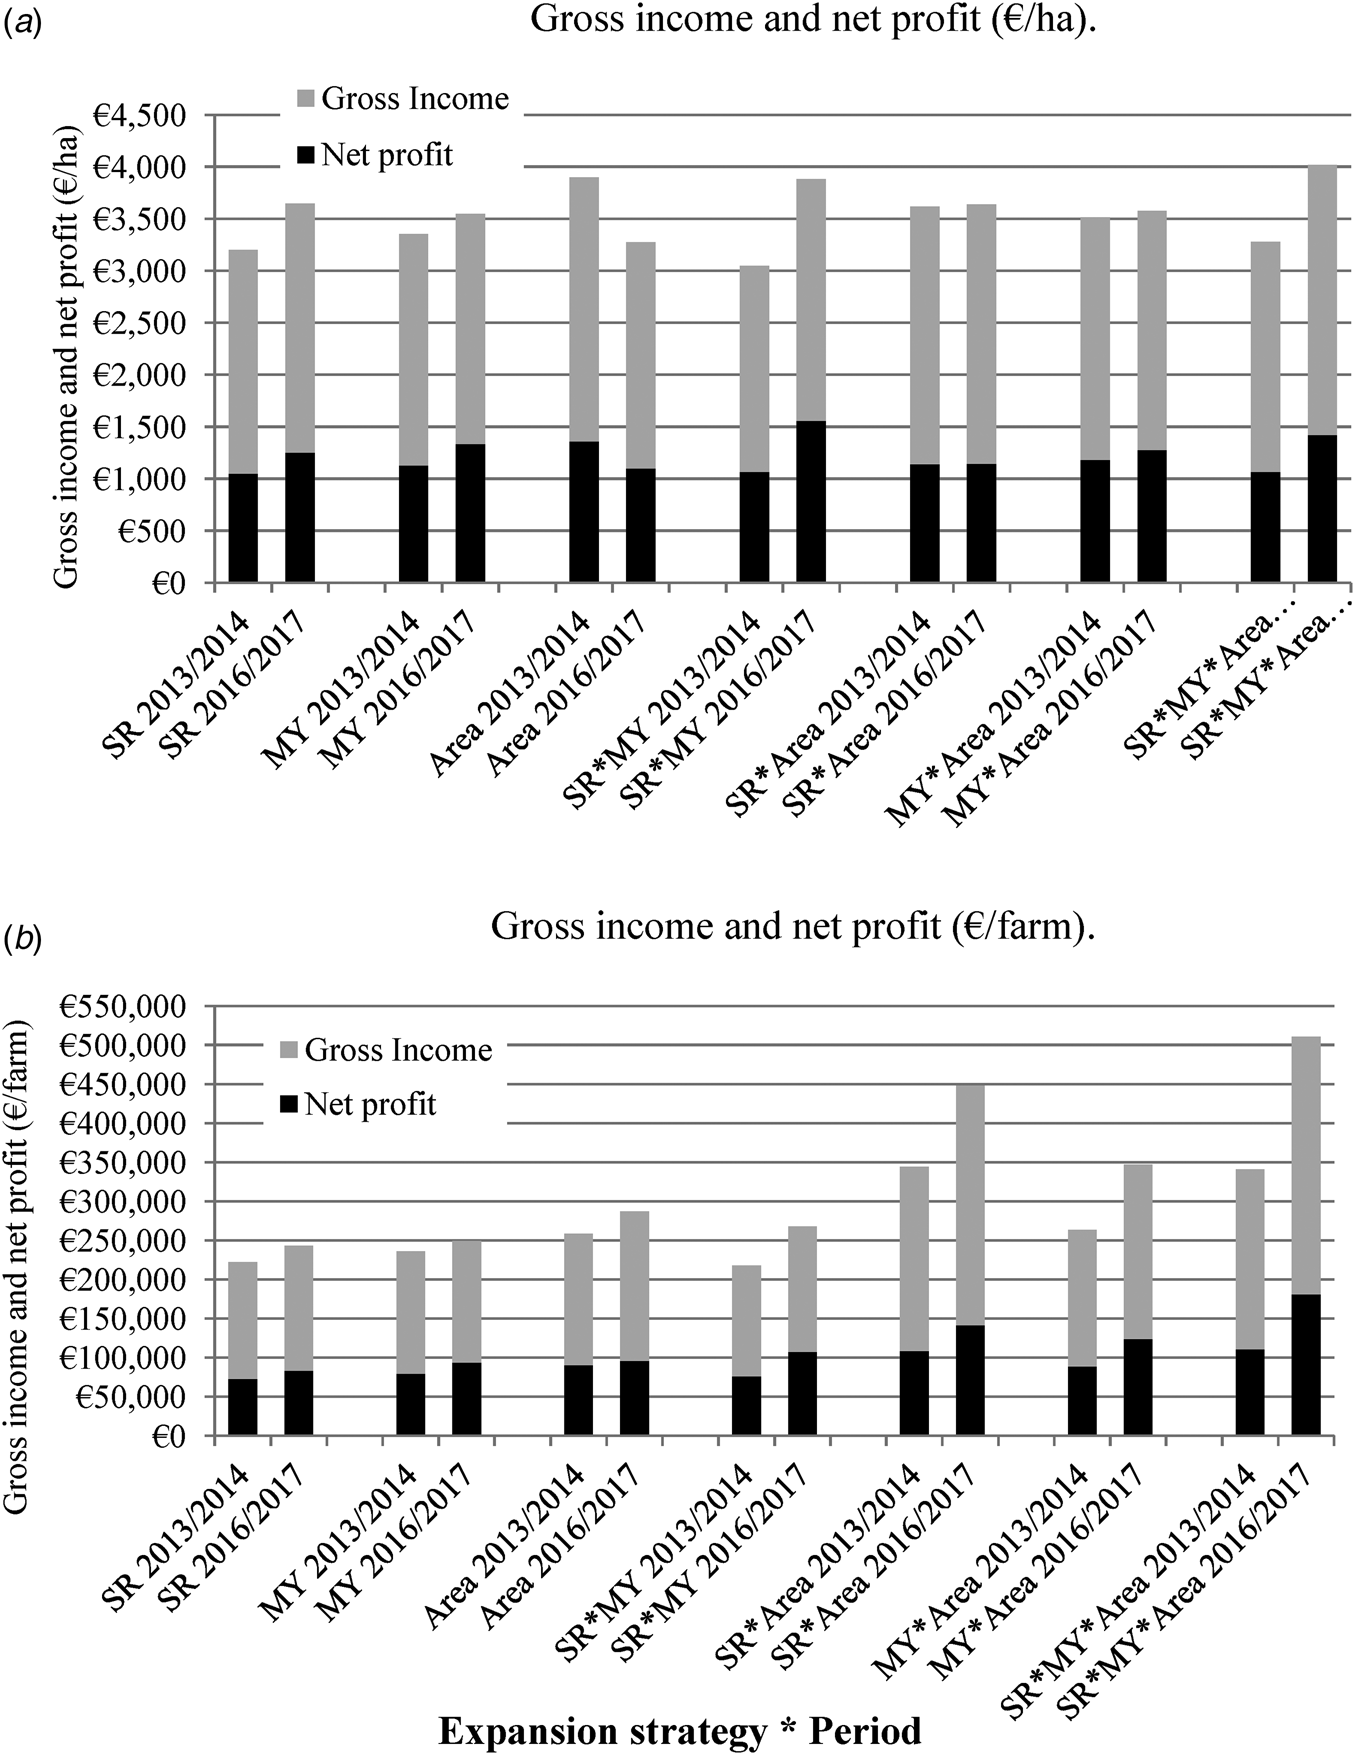
Fig. 2. The effect of various expansion strategies on (a) per hectare and (b) per farm financial performance in the 2 years immediately preceding (2013/2014) and following (2016/2017) European Union milk quota abolition. SR = Farms increasing milk production by increasing stocking rate only; MY = Farms increasing milk production by increasing milk yield per cow only; Area = Farms increasing milk production by increasing area farmed only; SR×MY = Farms increasing milk production by increasing both SR and MY; SR×Area = Farms increasing milk production by increasing both SR and Area; MY×Area = Farms increasing milk production by increasing both MY and Area; SR×MY×Area = Farms increasing milk production by increasing SR, MY and Area.
In all strategies studied, farm profit increased due to a combination of increased revenues, increased pasture utilization and a dilution of per unit production costs (Fig. 2). Among the single expansion strategies, increasing milk yield per cow had the greatest (P < 0.001) impact increasing overall farm profit by 18%, whereas increasing farm area had the least positive effect (+7%) and increasing SR was intermediate (+14%). Of farms that expanded using two strategies, increasing stocking rate and milk production, stocking rate and area farmed or milk yield and area farmed increased farm net profit by 41, 30 and 39%, respectively. Finally, farms that increased milk production using all three factors experienced the greatest increase in farm net profit (64%).
Discussion
The abolition of EU milk quotas in 2015 has provided a once-in-a-generation opportunity for Irish dairy farmers to expand milk production and the current study represents a unique first opportunity to evaluate both the biological and the financial impacts of the immediate expansion undertaken on a matched sample of commercial pasture-based dairy farms. The impacts of intensification on dairy production systems have been extensively studied (Clay et al., Reference Clay, Garnett and Lorimer2020), with the majority of these studies focused on comparisons between confined and pasture-based systems, whereas our study is uniquely focused on a matched sample of commercial dairy farms using intensified grazing dairy systems. The aim of this study was to identify different intensification strategies for grazing dairy farms and to evaluate the impact on productivity and economic performance. The overall expansion in milk production (51%) over the 5-year timeframe was greater than that achieved in national statistics (34%) (CSO, 2020) during the same period. On average, the farms studied are representative of the top 10% of farms in the National Farm Survey on farm profitability per ha (Teagasc, 2019) during the same period, typified by both higher SR, increased per animal and per ha milk production, and higher net profit margins compared to average dairy farms (Teagasc, 2019). In addition, producers likely managed their farms in a less intensive manner in the years prior to quota abolition to avoid penalties and/or less profitable production above quota limits. Subsequently, they rapidly increased stocking rate, pasture productivity and utilization as well as milk fat and protein production. Longer term, it seems probable that future gains may occur less rapidly and would need a multi-faceted approach including greater expansion of land resources.
The general trends towards intensification and increased operation scale within this study (Table 1) are similar to previous reports from both the housed dairy production systems in the USA (Brown and Schulte, Reference Brown and Schulte2011) and the UK (AHDB, 2016) and pasture-based systems of milk production in the UK (Gonzalez-Mejia et al., Reference Gonzalez-Mejia, Styles, Wilson and Gibbons2018) and New Zealand (DairyNZ, 2018). Increases in specialization, operational scale and productivity gain have previously been reported in many countries in response to dairy industry deregulation resulting in a general trend towards fewer much larger scale farms (Valdes, Reference Valdes1994; Rae and Strutt, Reference Rae and Strutt2003; Salou et al., Reference Salou, van der Werf, Levert, Forslund, Hercule and Le Mouël2017; Clay et al., Reference Clay, Garnett and Lorimer2020). The UK dairy sector exemplifies this intensification trend, with farm numbers falling by one-third, milk yield per cow increasing by 14% and concentrate feed use increasing by 17% between 2005 and 2015 (Styles et al., Reference Styles, Gonzalez-Mejia, Moorby, Foskolos and Gibbons2018). In each case, the intensification of production in terms of output per hectare has been based on increasing SR, including more concentrated feed in the diet, and improving the genetic merit of the breeds (Alvarez and Arias, Reference Alvarez and Arias2004; Shadbolt et al., Reference Shadbolt, Siddique and Hammond2017). Unlike previous studies where intensification resulted in a more marginalized role for grassland (Kristensen et al., Reference Kristensen, Søegaard and Kristensen2005), these results show further evidence of increasing pasture utilization on Irish dairy farms (Ramsbottom et al., Reference Ramsbottom, Horan, Berry and Roche2015; Hanrahan et al., Reference Hanrahan, McHugh, Hennessy, Moran, Kearney, Wallace and Shalloo2018) which is indicative of the capacity for increased milk production within comparatively extensive Irish dairy systems (Delaby et al., Reference Delaby, Buckley, McHugh, F, Horan, Hennessy, O'Donovan, Kennedy, McCarthy, Finn and O'Brien2018). In economic terms, the fluctuations observed in output, costs and profitability during the study are consistent with those reported previously on grass-based dairy farm businesses (Ramsbottom et al., Reference Ramsbottom, Horan, Berry and Roche2015; DairyNZ, 2018; Hanrahan et al., Reference Hanrahan, McHugh, Hennessy, Moran, Kearney, Wallace and Shalloo2018). The decline observed in costs of production since milk quota removal is consistent with national analysis suggesting a ‘dilution’ of costs since 2014 (Teagasc, 2019).
The majority of farmers (79%) in this analysis increased milk output following quota removal which is much greater than that expected from either farmer attitudinal surveys (56%; O'Donnell et al., Reference O'Donnell, Horan, Butler and Shalloo2011) or economic impact analysis (64%; Lapple et al., Reference Lapple, Hennessy and O'Donovan2012) undertaken prior to quota abolition. The farmers included in the current analysis have completed ePM each year for five consecutive years and are therefore more financially focused, typically have lower production costs and are larger scale than the national average representative dairy farm (Hennessy et al., Reference Hennessy, O'Dwyer, Connolly, Ramsbottom and Moran2015). They were thus more likely to increase production following quota removal. Both Van Berkum and Hemling (Reference Van Berkum and Hemling2006) and O'Donnell et al. (Reference O'Donnell, Horan, Butler and Shalloo2011) have previously observed that larger farms had more ambitious expansion plans. The results of this study now reaffirm those findings with the greatest increase in milk production realized on farms that were initially larger in terms of both herd size and farming area. Unlike most case examples of intensification, the increase in milk production both per cow and per farm in this analysis was achieved through an increase in the quantity of pasture consumed rather than purchased feeds reflecting the underutilization and latent potential productivity of existing animals and land within Irish dairy systems (O'Donnell et al., Reference O'Donnell, Shalloo, Butler and Horan2008; Kelly et al., Reference Kelly, Shalloo, Geary, Kinsella, Thorne and Wallace2012). The overall increase in farm income observed with increased milk production in this study is consistent with the increased productivity realized on Finnish and French dairy farms following quota abolition reported by Sipilainen et al. (Reference Sipilainen, Kumbhakar and Lien2014) and Salou et al. (Reference Salou, van der Werf, Levert, Forslund, Hercule and Le Mouël2017). Conversely, the decline in farm profit of those who undertook the least expansion (Q1 farms in this study; Tables 3 and 4) is stark but consistent with previous findings. Shalloo et al. (Reference Shalloo, Dillon, Rath and Wallace2004) simulated eight expansion scenarios over the period 2004–2013 (prior to quota removal) and concluded that dairy farmers who remained static over the 9-year period would suffer a 30% loss in real income. Equally, both Leddin et al. (Reference Leddin, Heard, Malcolm, Tarrant, Ho and Wales2011) and McDonald et al. (Reference McDonald, Shalloo, Pierce and Horan2013) have previously reported the necessity for expansion to protect the profitability of farm businesses.
The most common approach to increase milk production (employed by 51% of farmers) was to increase milk production per cow in the herd. On farms where no other change to the production system was undertaken, this approach resulted in an 18% increase in fat plus protein production per cow and a 19% increase in total farm profits. Unlike other studies where increased milk production per cow was derived from increased concentrate supplementation (Ramsbottom et al., Reference Ramsbottom, Horan, Berry and Roche2015; Ho et al., Reference Ho, Heard, Wales, Jacobs, Doyle and Malcolm2018), the increase in production in this study arose from a 22% average increase in pasture utilization (t DM/ha) with no additional supplements required. As milk yield per cow was constrained prior to quota abolition, an increase in production through increased lactation length was anticipated (McDonald et al., Reference McDonald, Shalloo, Pierce and Horan2013) and resulted in a large increase in farm profitability with minimal additional feed costs. This effect is consistent with the findings of Hanrahan et al. (Reference Hanrahan, McHugh, Hennessy, Moran, Kearney, Wallace and Shalloo2018) who observed that pasture utilization increased from 6.7 to 7.8 t DM/ha over the 8-year period from 2008 to 2015 and concluded that for each additional 1 tonne of pasture utilized per ha, farm net profit increased by €180/ha per year. The positive impact of increasing SR on the productivity of pasture-based milk production systems has been widely reported previously. In a meta-analysis of previous studies, McCarthy et al. (Reference McCarthy, Delaby, Pierce, Brennan and Horan2013) observed that a 1 cow/ha increase in SR resulted on average in an 18% increase in milk fat plus protein production per hectare within the database evaluated. In contrast, the response to SR increase was substantially higher (35% increase in fat plus protein/ha for a 0.42-cow increase in SR) within this study. Though previous studies in pasture-based milk production reported a 9% decline in fat plus protein production per cow for a 1 cow/ha increase in SR (McCarthy et al., Reference McCarthy, Delaby, Pierce, Journot and Horan2011), no such reduction was evident in the current analysis. The strong positive impact of SR on milk production is further evidence of the extensive nature of dairy systems during the quota period and capacity for increased production on dairy farms. Previous research (Macdonald et al., Reference Macdonald, Penno, Lancaster, Bryant, Kidd and Roche2017) confirms that intensification of such systems can be profitable provided that the additional feed required is inexpensive. In the current analysis, following quota removal, the increase in milk production substantially increased gross farm receipts (+9%), with only a modest increase in total milk production costs (+6%), thereby resulting in a substantial increase in net farm profit (14%) per hectare.
The results of the present study quantify the positive financial impacts of the initial dairy expansion undertaken on Irish dairy farm business post EU milk quotas. Approximately one-third (32%) of expanding farmers increased the area farmed by more than 7 ha during the study period. As a single strategy, increasing farming scale had only a modest impact on farm profitability (increasing net farm profit by only 4%). Previous studies have employed the strategy in tandem with either increasing stocking rate or increasing milk yield per cow or both strategies. O'Donnell et al. (Reference O'Donnell, Horan, Butler and Shalloo2011) suggested that following milk quota abolition, other factors of production could emerge to constrain overall production and postulated that the availability of land could become a major limitation to dairy expansion in Ireland. The results of the present study show the potential for the sustainable intensification of dairy system to increase production levels, maintain production costs and substantially increase overall farm profitability similar to previous studies (Álvarez et al., Reference Álvarez, del Corral, Solís and Pérez2008). Furthermore, the results highlight the central importance of the efficient use of pastures to support increased productivity on Irish dairy farms post quotas. As herd size expands, additional staff are required, additional facilities are built and, perhaps most importantly, the job of the farm manager becomes more complex (Hadley, Reference Hadley2006) – the reward for such additional effort is reflected in the change in farm net profit in this analysis. Farmers completing PM are a self-selecting cohort and therefore reflective of a more profit-focused sector of dairy farmers (Hennessy et al., Reference Hennessy, O'Dwyer, Connolly, Ramsbottom and Moran2015). Notwithstanding the significant financial gains achieved, further investigations are required to evaluate the longer term impacts of expansion, not just in terms of economic indicators, but also in terms of environmental and socio-cultural changes.
Conclusions
The overall productivity of studied farms increased by 51% during the study period through a combination of increased production per cow, increased operational scale and intensification of the production system. On average, net farm income improved following expansion with the greatest gains evident where a combination of expansion strategies was employed resulting in the greatest increase in milk production and with the additional milk production produced from increased pasture utilization. In all strategies studied, farm profit increased due to a combination of increased revenues, increased pasture utilization and a dilution of per unit production costs. Further investigation of the longer term impacts of expansion is merited, not just in terms of economic indicators, but also in terms of environmental and socio-cultural change.
Acknowledgements
No acknowledgements.
Financial support
This research received no specific grant from any funding agency, commercial or not-for-profit sectors.
Conflict of interest
The authors declare there are no conflicts of interest.
Ethical standards
Not applicable.


