


Clay mineral ‘crystallinity’ is a term used to describe the general change in the degree of ordering in the crystallographic c* direction of phyllosilicate minerals, as detected by differences in the line broadening of basal X-ray diffraction (XRD) reflections (Kübler Reference Kübler1967, Reference Kübler1968, Reference Kübler and Lagache1984; Frey, Reference Frey and Frey1987). More specifically, for the typical authigenic illite and chlorite phases that characterize the prograde transition from diagenetic (zeolite facies) to epizone (pumpellyite–prehnite and the greenschist facies) metamorphic conditions, it reflects the improved state of ordering that occurs as a function of increasing crystallite thickness and the decreasing abundance of mixed-layered phases (Warr & Nieto, Reference Warr and Nieto1998; Merriman & Frey, Reference Merriman, Frey, Frey and Robinson1999; Warr & Cox, Reference Warr and Cox2016). Zones of lattice distortion (strain) in crystals may also lead to the broadening of XRD reflections (Drits et al., Reference Drits, Eberl and Środoń1998). However, in the case of clay minerals, it remains to be demonstrated that this effect can be calculated accurately and, if present, probably has a minimal influence at low 2θ angles.
Although of an empirical nature, a straightforward measure of clay mineral ‘crystallinity’ is provided by half-peak-width values. This measure has long been used to quantify the progressive narrowing of illite and chlorite basal XRD reflections that occur during burial diagenesis and prograde low-temperature metamorphism (Kübler, Reference Kübler1967, Reference Kübler1968, Reference Kübler and Lagache1984; Árkai, Reference Árkai1991). The most commonly used reflections are the 001 illite at ~0.1 nm and the 002 chlorite at 0.07 nm, known as the Kübler index and Árkai index, respectively (Guggenheim et al., Reference Guggenheim, Bain, Bergaya, Brigatti, Drits, Eberl, Formoso, Galán, Merriman, Peacor, Stanjek and Watanabe2002). In this contribution, these terms are strictly applied to describe these measurement methods, which are used to determine the state of illite ‘crystallinity’ and chlorite ‘crystallinity’ (Frey, Reference Frey and Frey1987). Peak-widths have traditionally been measured by hand on printed XRD chart paper (e.g. Frey, Reference Frey and Frey1987; Eberl & Velde, Reference Eberl and Velde1989), but today the majority of researchers utilize computer software programs and the full-width-at-half-maximum (FWHM) parameter.
One problem of illite and chlorite peak-width-based XRD methods is their notable sensitivity to analytical variations. In the past, this has resulted in significant numerical differences between laboratories when analysing the same sample material. Such inconsistencies are emphasized when plotting the experimental 001 illite half-peak-width values of the four clay mineral ‘crystallinity’ samples circulated to 18 laboratories in the 1990s (Fig. 1a). Employing the most commonly used boundary limits of Kübler (Reference Kübler1967), 74% of the samples measured were assigned to the same grade, whereas 26% fell into different metamorphic zones. In some cases, variations were particularly extreme. Without calibration, the sample SW4 mudrock was assigned to the epizone, upper anchizone or even the lower anchizone, depending on the laboratory in which it was measured. Such variations were not sufficiently removed by the use of available polished rock sections (Blenkinsop, Reference Blenkinsop1988; Kisch, Reference Kisch1990), as these standards did not include numerical variations due to sample preparation (Krumm & Buggisch, Reference Krumm and Buggisch1991). Although less tested, such interlaboratory variation is also expected to influence metamorphic-grade determinations based on Árkai index measurements. However, this latter method is typically used in combination with the Kübler index and does not have universally recognized boundary limits for the anchizone.
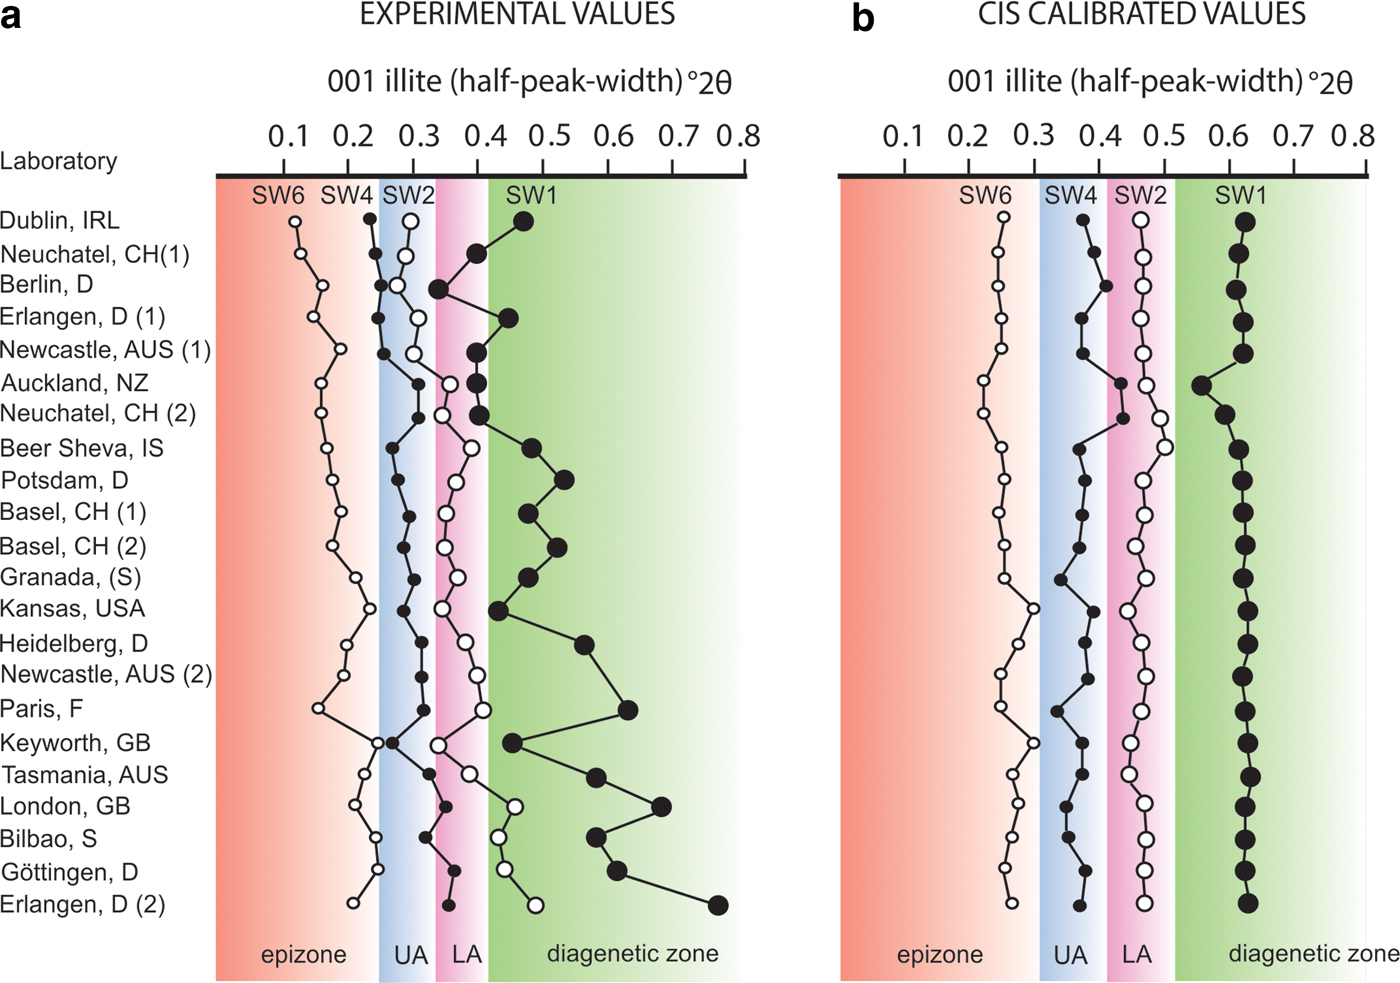
Fig. 1. Half-peak-width values of the 001 illite reflections measured on four ‘crystallinity’ index standards (CIS) of Warr & Rice (Reference Warr and Rice1994) (SW1, SW2, SW4, SW6) distributed to 18 laboratories in the 1990s. (a) Experimental values prior to calibration; (b) CIS calibrated values. The anchizonal boundaries (°2θ) marked on the uncalibrated data plot are the original limits of Kübler (Reference Kübler1967) at 0.25° and 0.42°. The CIS anchizonal boundaries for the calibrated data graph are the new Kübler-equivalent limits of Warr & Ferreiro Mählmann (Reference Warr and Ferreiro Mählmann2015) at 0.32°2θ and 0.52°2θ. After calibration, the assignment of samples to their respective metamorphic grades has a 98% success rate, with <10% mean error at the σ1 confidence level. LA = lower anchizone; UA = upper anchizone.
Warr & Rice (Reference Warr and Rice1994) introduced a solution to the problem of interlaboratory variation. They proposed a calibration approach using rock-chip standards that require full preparation by the user, and therefore numerical corrections to the peak-width values include all consistent variations that arise during preparation and analysis. These standards have been available for the past 24 years and are widely employed for calibration to a standardized scale of measurement known as the CIS. By adopting the CIS approach of standardizing data and the modified Kübler–Frey equivalent anchizonal boundary limits (Warr & Ferreiro Mählmann, Reference Warr and Ferreiro Mählmann2015), the calibrated half-peak-width values of the 18 laboratories were reduced to <10% mean error (σ1 confidence level), producing consistent metamorphic-grade determinations (Fig. 1b).
Adjustment of the CIS anchizonal boundary limits to 0.32°2θ and 0.52°2θ was necessary because Warr & Rice (Reference Warr and Rice1994) did not successfully reproduce the measurement scale of Kübler–Frey by calibration using the polished rock slabs of H. Kisch (Beer-Sheva). The CIS values turned out to be, on average, 23% broader than Kübler–Frey half-peak-width values and thus were not compatible with the well-established 0.25°2θ and 0.42°2θ boundary limits for the anchizone (Ferreiro Mählmann & Frey, Reference Ferreiro Mählmann and Frey2012; Warr & Ferreiro Mählmann, Reference Warr and Ferreiro Mählmann2015). Kisch et al. (Reference Kisch, Árkai and Brime2004) discussed a number of possible data-conversion errors as the cause of the broader CIS values. In contrast, Warr (Reference Warr2014) attributed the differences largely to sample preparation effects not included in the calibration by polished rock slabs. The correlation made by Warr and Rice (Reference Warr and Rice1994) assumed Kisch's half-peak-width measurements to be 0.04° narrower than Kübler's (Neuchâtel) values, as stated in the literature (Kisch, Reference Kisch1990). As a result, this factor was added to the conversion equation accordingly. However, after both H. Kisch and B. Kübler later presented their half-peak-width values for the CIS rock-chip standards that required sample preparation, it became clear that Kisch's experimental values were, on the whole, broader than Kübler's (Fig. 1), and not 0.04° narrower as published. This discrepancy introduced a mean error of 18% broadening to the CIS values, which accounts for most of the 23% difference in question (Warr, Reference Warr2014). Another source of error may have arisen from the linear fit of the correlation data used by Warr & Rice (Reference Warr and Rice1994) (Fig. 2), which can be more accurately fitted with a logarithmic curve (H. Kisch, 2017, pers. comm.). Following a general discussion of these issues at the Kübler index roundtable workshop of the 2014 Mid-European Clay Conference, the use of polished rock slabs is no longer recommended for standardization purposes (Warr & Ferreiro Mählmann, Reference Warr and Ferreiro Mählmann2015).
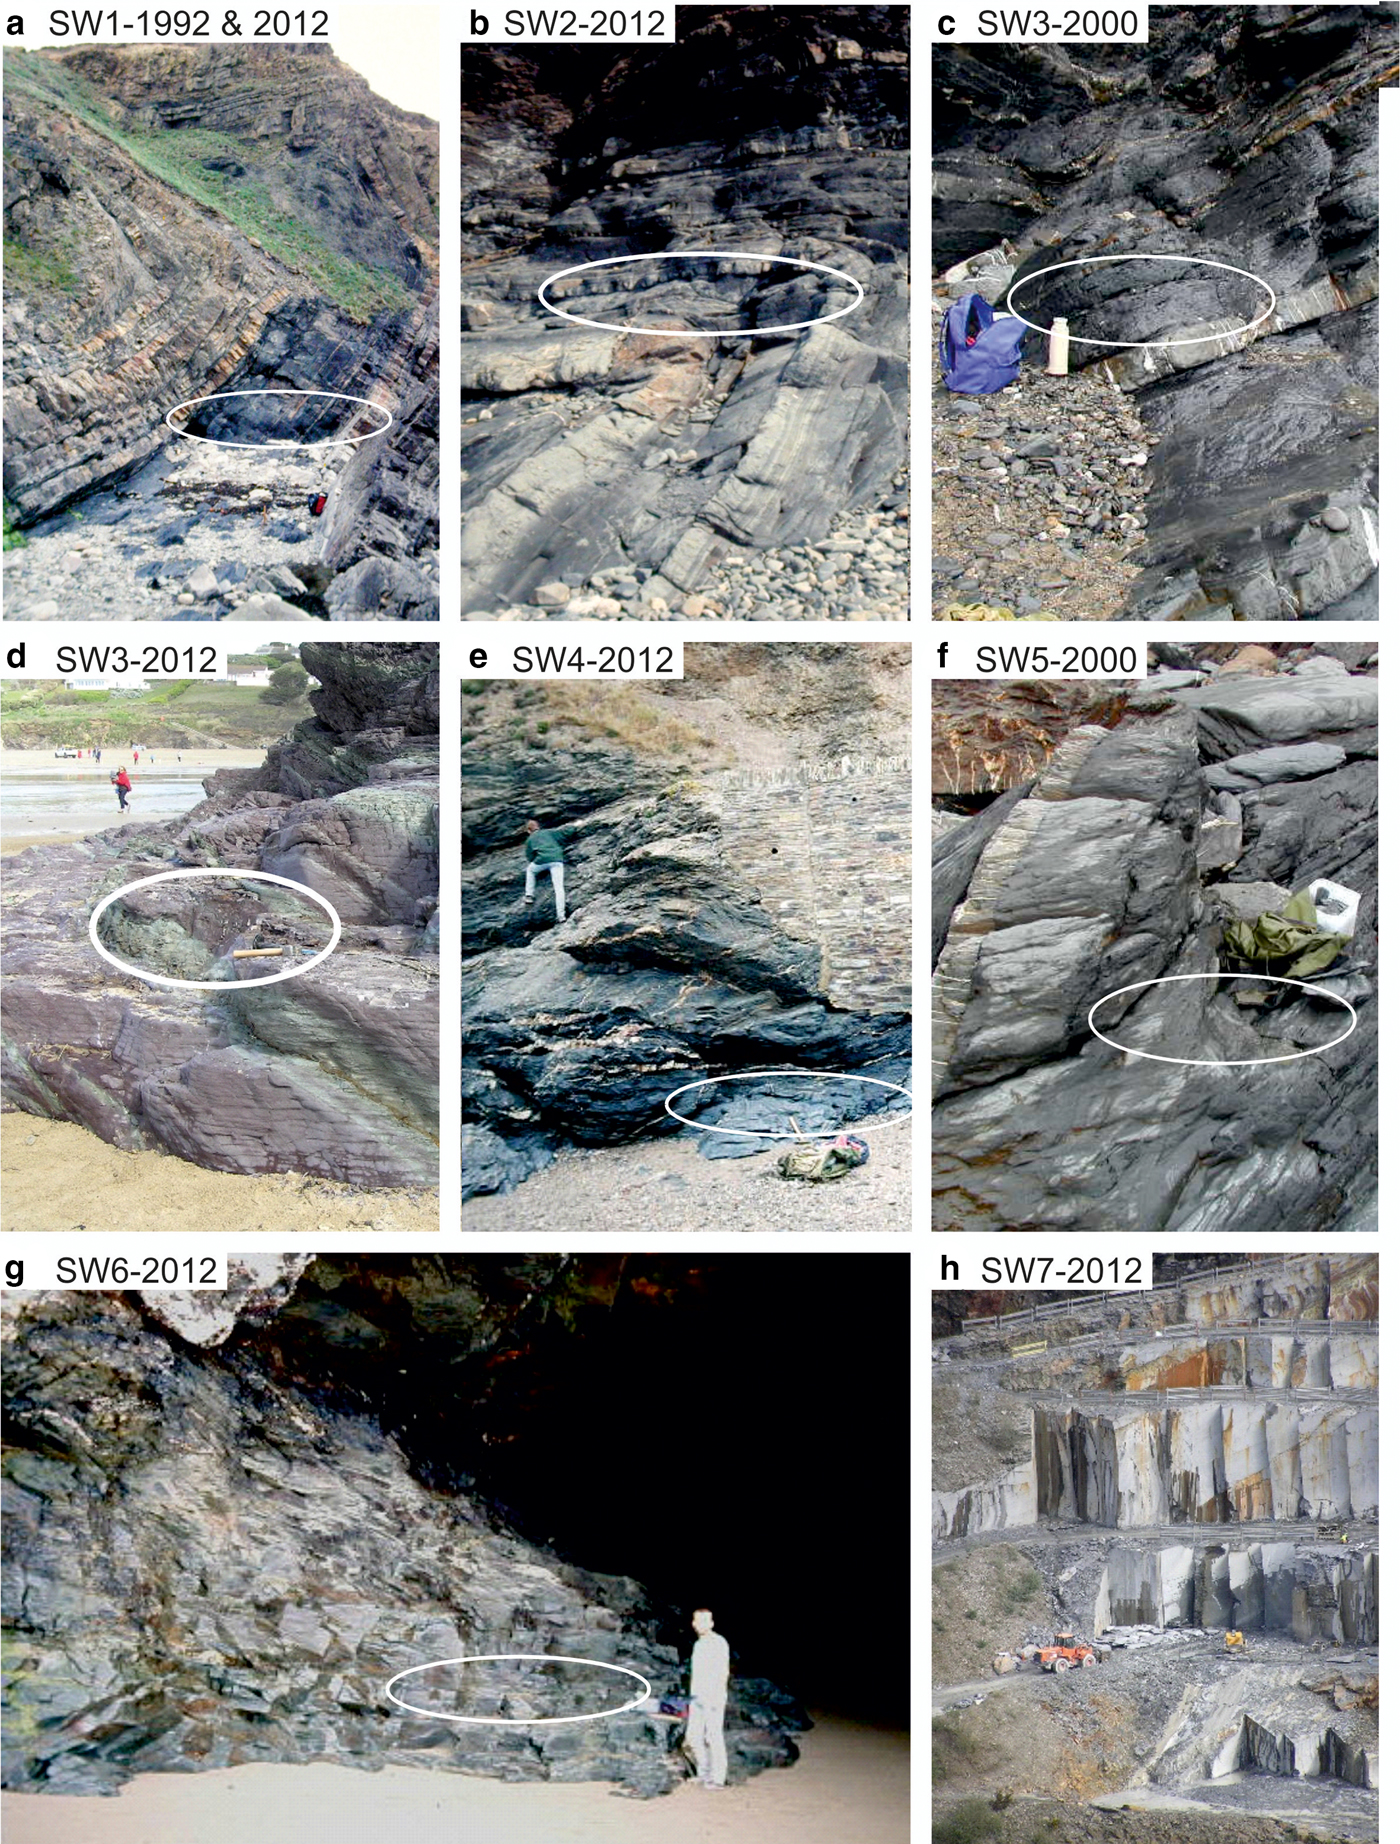
Fig. 2. Field photographs of sample locations along the coastline of north Cornwall, southwest England. (a) Widemouth Bay, north, (b) Crackington Haven, (c) Millook Haven, (d) Polzeath Beach, (e) Portgaverne (near Port Isaac), (f) Strangles Beach, (g) Trebarwith Strand, (h) Delabole Quarry (details given in Table 1).
Table 1. Locality information and geological information.

This paper presents a new collection of CIS samples that replaces the now largely depleted set introduced by Warr & Rice (Reference Warr and Rice1994). The nine argillaceous mudrocks, ranging from weakly cleaved mudstones to strongly foliated slates, were collected from the same locations, along with additional new sites selected to increase the number of diagenetic, anchizonal and epizonal samples available for calibration. The paper details how the new CIS values for the samples were determined and provides some updated guidelines on calibration using the standards based on the experience gained since the introduction of the method. Schomberg et al. (in press) report the first K–Ar age determinations and illite polytype quantifications of the fine fractions of the material.
SAMPLE COLLECTION AND PREPARATION
The sample material was collected from locations of well-exposed Palaeozoic mudrock along the coastline of north Cornwall, southwest England (Fig. 2; Table 1). The four localities of Warr & Rice (Reference Warr and Rice1994) were resampled, choosing rock portions that were as close as possible to the original sites. In the case of SW1-2012 from Widemouth Bay, north (Fig. 2a), a thin mudstone layer was sampled in the vicinity of the still available SW1-1992 standard. Due to significant changes in the height of the beach level and erosion of the cliff line, the original sedimentary mudstone bed could not be located. However, for SW2-2012 (Crackington Haven), SW4-2012 (Portgaverne) and SW6-2012 (Trebarwith Strand), the same rock exposure was resampled within of a range of a few metres (Fig. 2b,e,g).
As sufficient material remains in the laboratory from the locations sampled in the year 2000, these sites were not recollected. They consist of one lower anchizonal mudstone (SW3-2000) from Millook Haven (Fig. 2c) and one strongly cleaved upper anchizonal mudstone (SW5-2000) from Strangles Beach (Fig. 2f). However, two new locations were added to the 2012 collection with the aim of increasing the number of anchizonal and epizonal grade standards: a foliated slate sample (SW3-2012) collected from Polzeath Beach (Fig. 2d) and a roofing slate (SW7-2012) from Delabole Quarry, purchased from Delabole Slate Company Ltd (Fig. 2h). The precise coordinates and geological details of the sample sites are summarized in Table 1.
Approximately 100 kg of material was collected from each location and stored in sealed 30 L containers appropriate for long-term storage. The rock portions were first washed and scrubbed in tap water to remove surface contamination (organic material and beach sand). The rock was then washed in their containers over a period of 2–3 weeks using deionized Millipore water by replacing the water several times in order to reduce the concentration of sea salt present. The standards were then dried and reduced to mm to cm-sized rock fragments using a rock crusher. The crushed rock was homogenized and then placed in sample bags, each containing ~50 g of rock. The bags were labelled and sealed ready for distribution and analysis. Five sample bags were selected at random from each container in order to establish the heterogeneity of the bulk material.
Similarly, five samples from each of the original CIS standards of Warr & Rice (Reference Warr and Rice1994), labelled as SW1-1992, SW2-1992, SW4-1992 and SW6-1992, and the two additional samples, SW3-2000 and SW5-2000, were included in the study. Analysis of the original material was required in order to construct a calibration curve between the experimental FWHM values of the University of Greifswald XRD laboratory (Institute of Geography and Geology) and the established CIS scale of measurement (Fig. 3).

Fig. 3. Half-peak-width correlation plot of the 001 illite and 002 chlorite reflections using the old ‘crystallinity’ index standards (CIS) and the experimental values determined in the Greifswald laboratory measured using a D8 Advance and a LynxEye detector. Greifswald full-width-at-half-maximum (FWHM) values were determined using the MacDiff point-peak method, which are equivalent to hand-measured Kübler index values (see Fig. 4). The solid regression line (CIS-FWHM = 0.7258 × Greifswald + 0.1402, R2 = 0.97) represents the correlation based only on Kübler index values (six points). The dashed regression line (CIS-FWHM = 0.7071 × Greifswald + 0.1498, R2 = 0.97) represents a correlation of both 001 illite and 002 chlorite values (nine points), which was used to calculate the CIS values for the new collection (Table 3).
Each of the five samples per standard was prepared following a laboratory procedure in accordance with the recommendations of Kisch (Reference Kisch1991) and that used by Warr & Rice (Reference Warr and Rice1994). Fresh, non-weathered rock fragments were first sorted from the sample bag, leaving out any iron-stained pieces. The fragments were hand-crushed in a large steel basin with a metal plunger and the silt fraction was collected using a <63 µm sieve. A total of 3 g of the silt powder was then placed in a dialysis bag for cation exchange and placed in 1 N of CaCl2 solution for 24 h. For complete exchange, the solution was replaced a second time by fresh solution and left for a further 24 h. Subsequently, the silt fraction was washed in deionized (Millipore) water until all traces of Cl– ions were removed (tested using silver nitrate solution). The 3 g of the Ca-saturated <63 µm fraction was then dispersed in 1.5 L of deionized water and treated ultrasonically in a water bath for 1 h at 60 Hz. The <2 µm clay-sized fraction was then separated in a glass column by gravity settling at 21°C. In order to avoid contamination of the clay fraction by coarser particles, the clay-in-suspension was carefully drawn out from the top of the column using a large pipette. Finally, the clay fraction was concentrated by drying at 60°C.
Oriented (textured) clay films were prepared by mixing 81 mg of each clay with 4.5 mL of water in a small glass tube. The clay was allowed to hydrate for 24 h before dispersing the sample by ultrasonic treatment and then pipetting 1.5 mL of the suspension onto a 30 mm × 30 mm glass slide to give a concentration of 3 mg/cm2. This concentration is considered to represent an optimum that produces a well-oriented preparation that is not too thick to result in extensive size grading of the specimen and not too thin to detect the glass background. The sample solution was used to make three XRD glass slides, which were prepared for the five subsamples of each standard to give a total of 15 slides for percentage error analysis. After air-drying overnight, the textured slides were measured using a Bruker D8 Advance diffractometer equipped with a position-sensitive LynxEye detector using Co radiation. Diffraction patterns were collected over the range of 5–55°2θ using a step-width of 0.02° and a count time of 2° min–1. These XRD patterns were used for both mineral identification and measurement of peak-width values. Selected textured slides were also saturated with ethylene glycol and re-measured.
MINERALOGY OF THE CIS SAMPLES
The minerals identified by XRD study of the <2 µm fraction are summarized in Table 2. All diagenetic and lower anchizonal samples contain prominent illite reflections at ~0.1 nm. In the fine fractions of these samples, Schomberg et al. (in press) recognized the authigenic 1M d illite polytype together with varying quantities of detrital 2M 1 illite–muscovite. The amount of 1M d polytype generally decreases in abundance with increasing metamorphic grade. It is most abundant in the diagenetic sample of SW1-1992, less abundant in the lower anchizonal samples and present in small amounts in the upper anchizonal SW5-2000 sample. Based on the intensity change of the illite reflections following ethylene glycol treatment, Warr and Rice (Reference Warr and Rice1994) determined the interlayer smectite content to be <4%. This polytype was not identified in the other upper anchizonal samples (SW3-2012 and SW4-1992) and the epizonal samples (SW6-1992 and SW7-2012) in which the only white mica phase present is the 2M 1 illite-muscovite. Whereas the upper anchizonal mudrocks probably contain both detrital and neocrystallized 2M 1 illite-muscovite, the epizonal slates consist entirely of recrystallized white mica (Schomberg et al., in press).
Table 2. Mineral assemblages of the nine ‘Crystallinity’ Index Standards identified by XRD (<2 µm fraction), including information from Warr & Rice (Reference Warr and Rice1994), Warr & Nieto (Reference Warr and Nieto1998) and Schomberg (in press).

Ilt–Sme = illite–smectite; Ilt–Ms = illite–muscovite; Chl = chlorite; Kln = kaolinite; Sme = smectite; Qz = quartz; Ab = albite; Kfs = K-feldspar; Lpd = lepidocrocite.
The illite assemblages of diagenetic and lower anchizonal mudrocks are accompanied by mixtures of kaolinite and chlorite, as evident from the complex shape of the ~0.07 nm reflections. Chlorite is absent only in the lower anchizonal SW3-2000 sample. In contrast, all upper anchizonal and epizonal mudrocks contain chlorite and no kaolinite. Minor quantities of a discrete smectite phase occur in SW1-2012, SW3-2000, SW3-2012 and SW6-2012. This was recognized from their broad, low-angle reflections that shifted to ~0.17 nm after ethylene glycol treatment. In addition to the clay mineral phases, all mudrocks contain accessory quartz and albite. The occurrence of a small 0.325 nm reflection in samples SW2-2012, SW3-2012, SW4-2012 and SW5-2000 indicates that some K-feldspar is present in the clay-sized fraction. Minor quantities of lepidocrocite detected in SW1-2012 and SW3-2000, together with smectite, probably formed by weathering.
PEAK-WIDTH MEASUREMENTS
The half-peak-width values of the 001 illite and 002 chlorite reflections were measured and compared using four analytical procedures: (1) hand-measured Kübler index values following the method illustrated by Frey (Reference Frey and Frey1987, p. 16); (2) the point-peak method of the MacDiff program (Petschick, Reference Petschick2010); (3) the point-peak method of the EVA software (DIFFRACplus Evaluation Package Release 2008) of the Bruker D8 Advance diffractometer; and (4) the profile-fitting option of MacDiff using a Split Pearson VII function.
Hand-measured Kübler index values represent the traditional method of half-peak-width determination prior to the development of modern computer software. Historically, this was measured directly on the XRD chart paper by first drawing in the background line and then measuring the peak-width distance (in °2θ) along the horizontal axis at half the height of the 001 illite reflection (Fig. 4a). The horizontal plane was used because it was easy to read off the °2θ values from the lines of the chart paper. For comparison with computerized methods, 24 Kübler index values were hand-measured on selected XRD patterns of the standards covering the full range of diagenetic to epizonal values. Due to time limitations, only computerized methods were used to calculate the peak-widths of all XRD patterns, with more than 900 measurements utilized in this study.

Fig. 4. Half-peak-width measurements of the XRD 001 illite reflection at ~0.1 nm for the lower anchizonal SW2-2012 sample. The experimental values measured on this pattern are: (a) hand-measured Kübler index = 0.425°2θ; (b) MacDiff point-peak method, full-width-at-half-maximum (FWHM) = 0.433°2θ; (c) MacDiff profile-fitting method, FWHM = 0.455°2θ (residuum 5.62%). The angle between the vertical axis and the half-peak-width line is shown.
The two point-peak methods are quite similar and both calculate the FWHM parameter of an XRD reflection. The MacDiff program can be set to calculate a close to straight background (low parabola) by using a large number of iterations in the calculation (Fig. 4b). Then, by manually clicking on the peak, the program automatically sets two anchors on either side of the reflection, identifies the peak maximum and calculates the FWHM value (among a range of other parameters). The EVA software works by manually selecting a box that isolates the reflection on which the calculation is made. The program then calculates a flat background extending to each side of the reflection, the peak maximum and the FWHM value. In contrast to the hand-measured Kübler index, all FWHM values are determined parallel to the background level (i.e. the true half-peak-width) and not along the horizontal chart axis. The angle between the vertical axis and the half-peak-width line of the XRD reflection, therefore, exceeds 90° (Fig. 4b).
The fourth method of FWHM calculation used is the profile-fitting approach, which was applied in the original CIS study of Warr & Rice (Reference Warr and Rice1994). State-of-the-art fitting (decomposition) of clay mineral XRD reflections can be made using the MacDiff program by selecting the Split Pearson VII function and clicking on the peak maximum (Fig. 4c). The program automatically calculates the end points for the background and then searches for the best fit curve by continuously refining the calculation. The difference between the XRD reflection and the fitted curve is expressed as a residuum, which was maintained at <10% (Petschick, Reference Petschick2010). Although for the purpose of CIS calibration the 001 illite and 002 chlorite reflections need to be fitted as single peaks, this method has the advantage of being able to test for overlapping reflections and, if needed, to decompose them. Examples are the overlapping 002 illite and 003 chlorite reflections that can be decomposed and also used for clay minerals ‘crystallinity’ measurements (Warr, Reference Warr1996).
A comparison between the 24 hand-measured Kübler index and computer-measured FWHM values reveals only small differences in half-peak-width values. For the full range of CIS values, the MacDiff point-peak FWHM values are on average <2% different and fall along the 1:1 line with a regression equation, y = 0.9959x, R2 = 0.99 (Fig. 5). For all intended purposes, these can be considered as equivalent, despite the differences described in measurement procedure. The FWHM values determined by the EVA point-peak method are, on average, slightly lower by 4.5%, whereas the FWHM values obtained by profile-fitting are, on average, 4.8% higher. The latter difference is mostly attributable to the difficulty in accurately fitting the tops of the reflections, which results in slight broadening of the peak fit (Fig. 4c). As the maximum difference between hand-measured and profile-fitted peak widths in this study did not exceed 11%, this variation lies within the range of mean percentage error determined by repeat measurements of the sample material by the same method (averaging between 2.3 and 14.5%; Table 3).
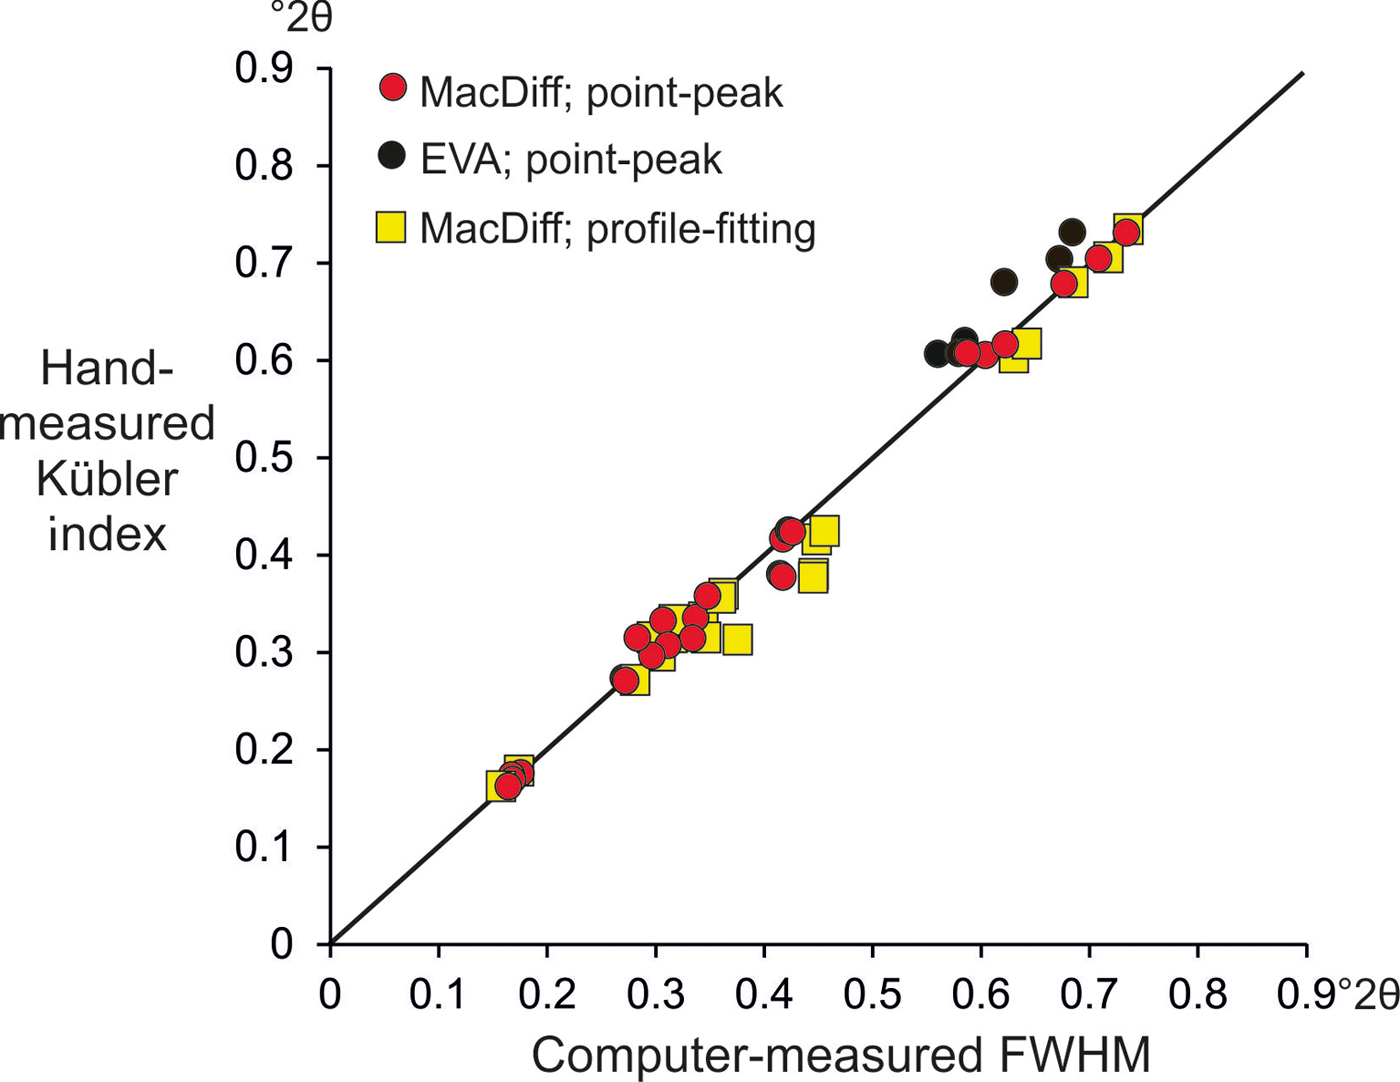
Fig. 5. Comparison of 24 hand-measured Kübler index values with the computer-measured full-width-at-half-maximum (FWHM) values used in this study. The line marks the 1:1 relationship between data sets. Regression equations for linear correlations (no shown) are: (1) MacDiff point-peak, y = 0.994x, R2 = 0.99; (2) EVA point-peak, y = 1.035x, R2 = 0.99; (3) MacDiff profile-fitting, y = 0.963x, R2 = 0.99. Due to overlapping data points, not all measurements are visible.
Table 3. Standard values for old and new ‘Crystallinity’ Index Standard (CIS) samples. Underlined numbers denote original CIS values of Warr & Rice (Reference Warr and Rice1994). % error = mean percentage error of measurements at the σ1 confidence level (n = 15). Bold numbers are for currently available standards that can be used for calibration. The new CIS values were calculated from Greifswald full-width-at-half-maximum (FWHM) values using the regression equation of Fig. 3 (001 illite reflections, n = 9).

Minor differences are also evident between the two point-peak methods tested (Fig. 6a), with an average variation of only 3.2% between the FWHM data sets (n = 180). The 180 data points were obtained by FWHM analysis of the ~0.1 nm reflections for 12 CIS standards, with three XRD slides prepared for each of the five subsamples (12 × 3 × 5). A similarly good correlation (R2 = 0.99, n = 180) occurs between the point-peak method and profile-fitting methods of MacDiff (Fig. 6b). Here, the profile-fitted values are slightly higher for the broader reflections.
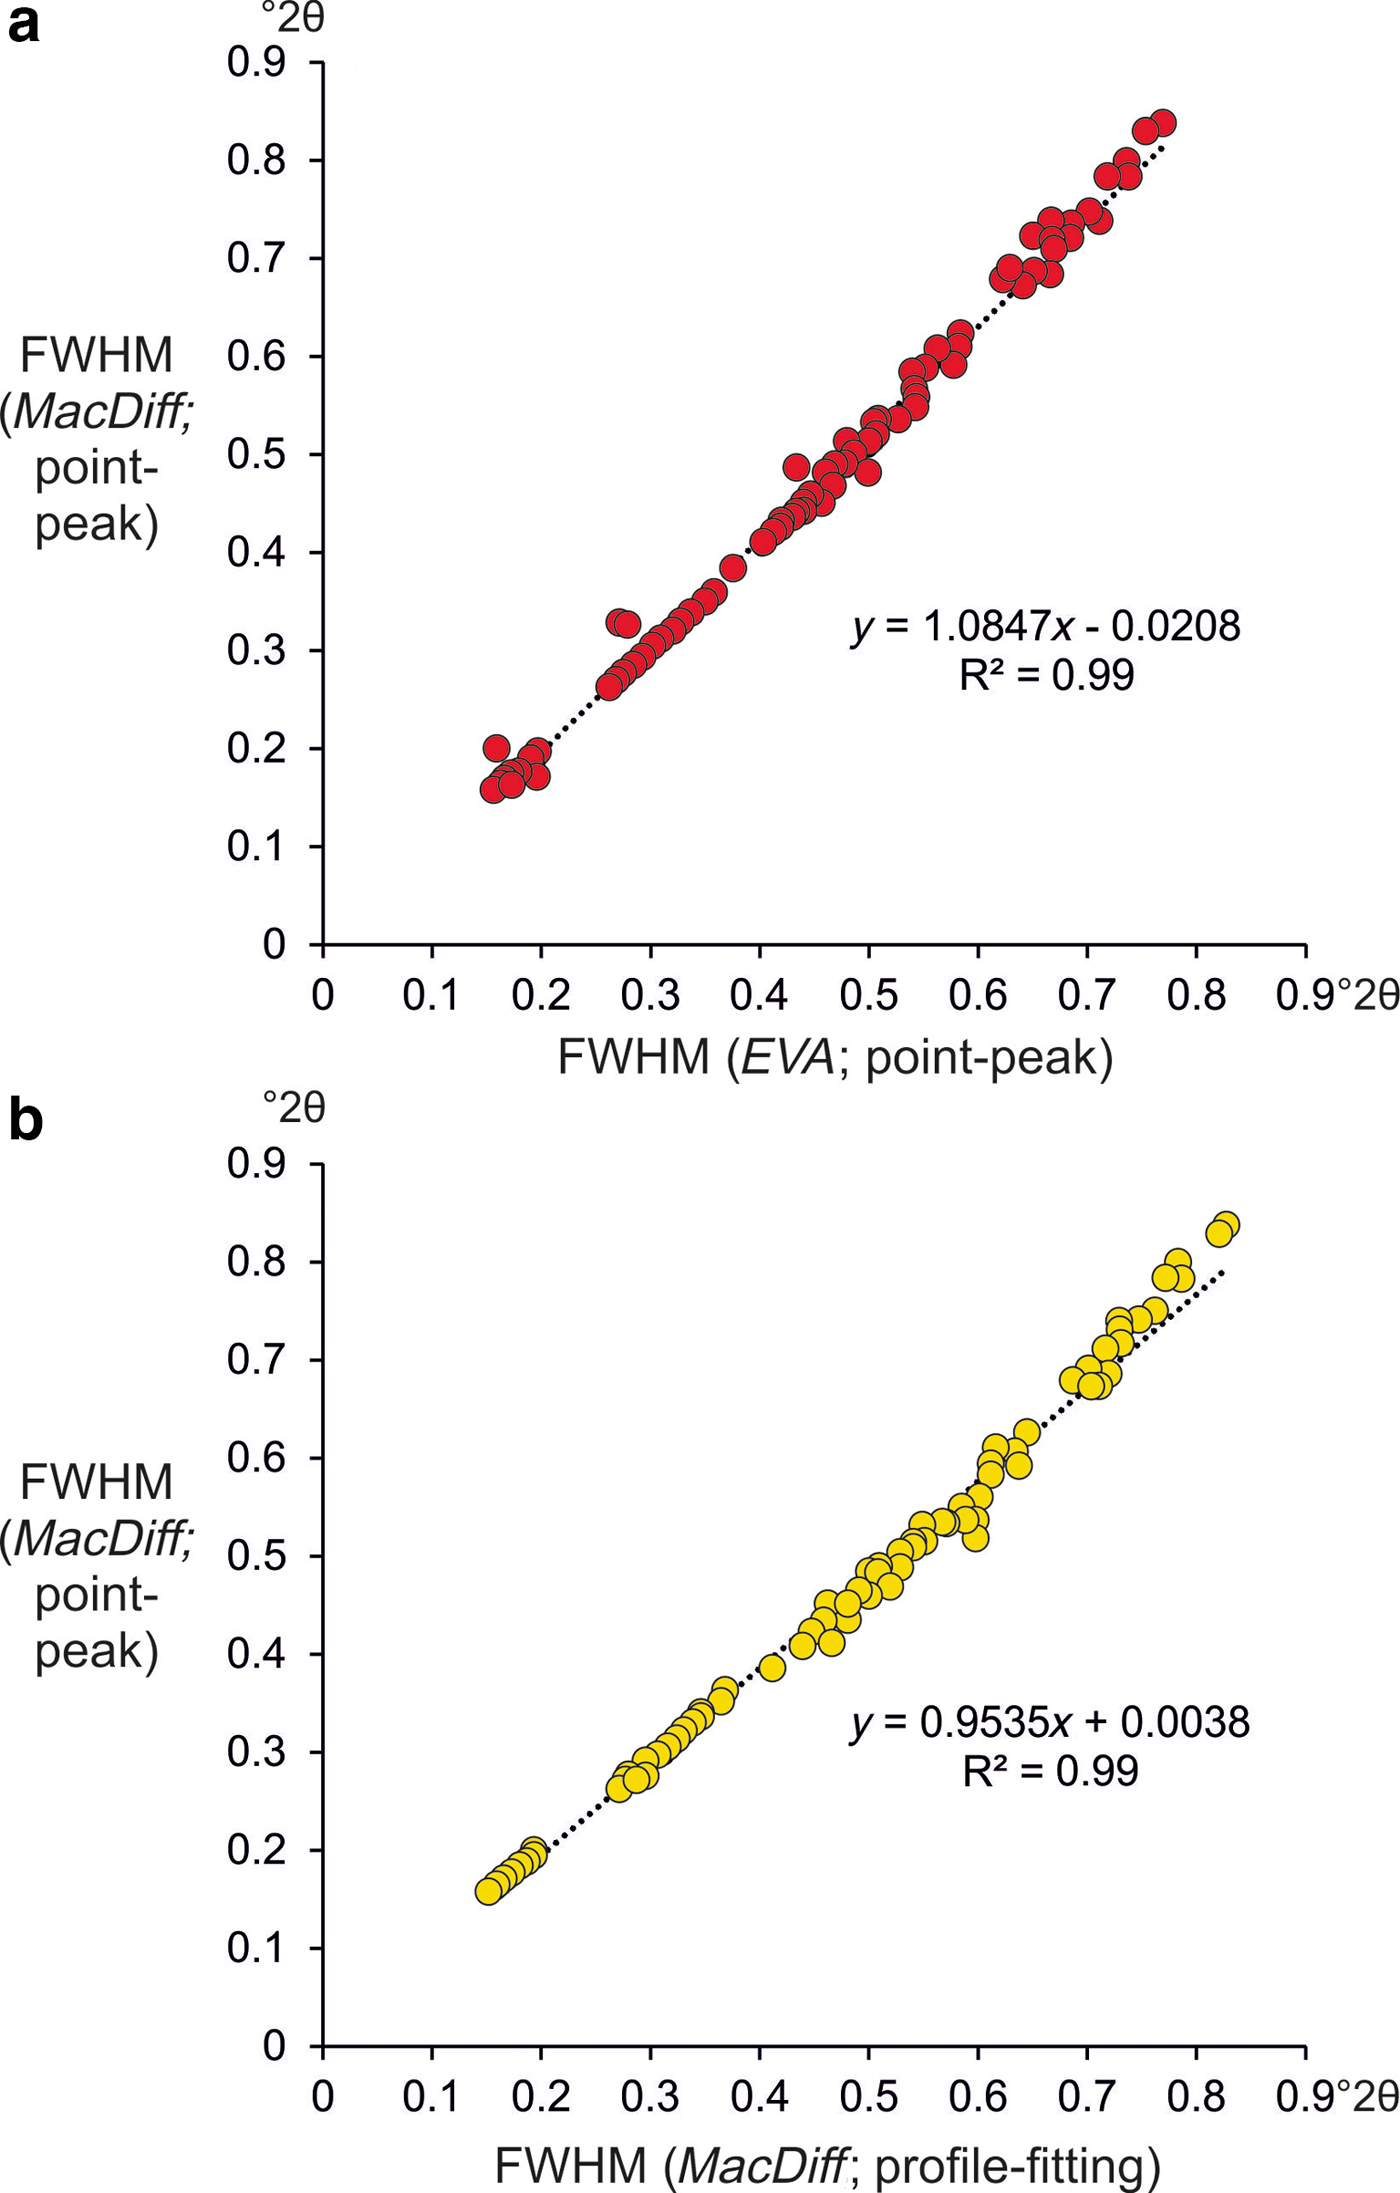
Fig. 6. Correlation of tested methods for full-width-at-half-maximum (FWHM) determinations based on the measurement of ~1.0 nm reflections (n = 180). (a) Point-peak method of MacDiff vs. the point-peak method of EVA software (from Bruker). (b) Point-peak method of MacDiff versus profile-fitting using the Split Pearson VII function.
In principle, any of the three FWHM data sets could be used for calibration purposes, as the small but consistent differences described are included in the equations used for conversion to CIS values. Each conversion was crosschecked by restudying the old set of CIS standards, and then the values were recalculated using the various measurement methods. The MacDiff point-peak method reproduced CIS values to an accuracy of 4.7%, the EVA point-peak method to 4.9% and the profile-fitting method to 5.0%. As a result of this statistical analysis and its equivalence to hand-measured Kübler index values, the point-peak method of MacDiff was the favoured data set used to produce the optimal calibration curve for determining CIS values for the new standard material.
All Greifswald FWHM values used in this study are given in Table 3, based on the selected MacDiff point-peak method. The amount of analytical variation determined by measuring the 15 XRD slides per sample gives an idea as to the heterogeneity of the standard material. The two diagenetic samples (SW1-1992 and SW1-2012) and one of the lower anchizonal samples (SW3-2000) show the highest degree of FWHM variation, with percentage errors of 14.5, 9.6 and 9.4%, respectively. This is in accordance with the nature of these lithologies, consisting of finely bedded mudstones with variable silt and sand content. All other samples appear to be more homogeneous, with errors ranging from 2.3 to 6.6%, which are in agreement with the general range of errors (3.7–7.1%) determined by Warr & Rice (Reference Warr and Rice1994). The Árkai index values have errors ranging from 2.5 to 8.4%. This range corresponds to the upper anchizone and epizonal samples characterized by chlorite-rich lithologies with no kaolinite. The FWHM values of the ~0.07 nm reflections of diagenetic and lower anchizone samples showed greater variation due to the mixture of chlorite and kaolinite assemblages (results not included in Table 3). These standards are therefore not suitable for calibrations including the Árkai index.
CALIBRATION CURVE FOR THE GREIFSWALD DIFFRACTOMETER AND DETERMINATION OF CIS VALUES FOR THE NEW STANDARDS
The mean experimental FWHM values determined by the point-peak method of MacDiff for previously used standard sets (1992 and 2000 samples) were plotted against the old CIS reference values and fitted by a linear regression curve (CIS-FWHM = 0.7259 × Greifswald-FWHM + 0.1402). The conversion equation is based on the six Kübler values and has a coefficient of determination, R2, of 0.97 (Fig. 3). Adding the three Árkai index values to the plot does not significantly change the fitted curve (CIS-FWHM = 0.7072 × Greifswald-FWHM + 0.1498). The R2 of 0.97 and the calculated CIS values were effectively the same. The latter equation with the larger number of calibration points was used to convert the experimental FWHM data to CIS-equivalent results for the six new standards (Table 3). Together with the three old standards (SW1-1992, SW3-2000 and SW5-2000) that are still available in sufficient quantities for further distribution, nine standards are now obtainable for calibration purposes: two diagenetic, two lower anchizone, three upper anchizone and two epizone-grade samples. Use of the complete collection can provide a maximum of 14 data points for calibration (bold numbers in Table 3).
RECOMMENDATIONS FOR IMPROVED CALIBRATION
Based on experience since the introduction of the calibration procedure of Warr & Rice (Reference Warr and Rice1994), the following recommendations on using the CIS sample collection are given:
• Step 1. After removing the rock chips from the bags, discard any weathered portions or fragments that are strongly stained with iron oxide/hydroxide precipitates (coloured brown).
• Step 2. Wash the standards thoroughly in deionized water prior to preparation. This is required to remove any remaining natural salts in the rock chips. Silver nitrate solution can be used to test for the presence of any Cl– ions. The remaining fresh rock chips are then ready for preparation.
• Step 3. Analyse the standards following your normal analytical procedure. They should be treated in exactly the same way as your other study samples.
• Step 4. Measure the half-peak-width values of the 001 illite (~0.1 nm) and 002 chlorite (~0.07 nm) reflections. You can do this using ‘point-peak’ methods, profile-fitting procedures or traditional hand measurement of the Kübler index. In the case of profile fitting, each reflection should be fitted using single, asymmetrical peak shapes.
• Step 5. Plot the experimental peak-width value against the CIS values given in Table 3 in an x–y plot.
• Step 6. Fit a regression curve to the data set. In most cases, the best-fit curve will be linear. It represents the difference between your experimental FWHM values and the given standard values. The correlation coefficient represents the goodness of fit and the quality of the calibration curve. Compare the regression curve using the nine 001 illite values with the combined curve using both 001 illite and 002 chlorite reflections (n = 14). If the two do not fall well along a common line, it is recommended that only the 001 illite reflections should be used for calibration (n = 9). Ideally, studies using the Árkai index should include the 002 chlorite reflection in the calibration procedure.
• Step 7. The regression equation can then be used to convert experimental half-peak-width values into calibrated CIS values using a standard spreadsheet program. Details of the regression curve should be included in your publications. It is also good practice to use the standards regularly in order to periodically check calibration curves, particularly when analytical methods and instruments are changed or adjusted.
• Step 8. Very-low-grade metamorphic grade determinations using CIS-calibrated results should be made using the Kübler–Frey equivalent anchizone boundary limits of 0.32°2θ and 0.52°2θ (Warr & Ferreiro-Mählmann, Reference Warr and Ferreiro Mählmann2015).
A set of CIS standards can be obtained from the author, and further information concerning the use of the CIS standards will be made available at www.claylab.de. Experimental results for the standards sent to the author will also be posted on that website.
CONCLUSIONS
1. Nine clay-mineral CIS samples are now available for calibrating the half-peak-width values of the XRD 001 illite (Kübler index) and 002 chlorite (Árkai index) reflections. Their usage enables consistent diagenetic and low-temperature metamorphic-grade determinations to be made despite analytical variations between laboratories.
2. The differences between hand-measured Kübler index values and FWHM measurements obtained by single point-peak or profile-fitting methods, such as the Split Pearson VII function, show only small variations that do not exceed the average percentage errors determined by repeat analyses of the same samples. The minor but consistent differences between measurement methods are included in the calibration curve for calculating CIS-equivalent values and therefore have little influence on grade determinations. The FWHM values of the MacDiff point-peak method used to calculate the new CIS values for the standards were equivalent to hand-measured Kübler index values.
3. Standardized values from the new CIS samples have been determined reliably using the original sample collection. The new values for the mudrocks collected from the same localities are consistent with previously distributed CIS data.
4. Using the CIS samples and following the recommended steps of calibration minimizes interlaboratory variation and results in reliable very-low-grade metamorphic-grade determinations.
ACKNOWLEDGMENTS
I would like to thank all of the researchers that have contributed to improving the CIS calibration method since its introduction in 1994, particularly Hanan Kisch (Beer-Sheva), Fernando Nieto (Granada) and Rafael Ferreiro Mählmann (Darmstadt) for the many useful discussions. Isabel Abad and an anonymous reviewer are thanked for their constructive suggestions that improved this contribution.


