


INTRODUCTION
At the Australian Nuclear Science and Technology Organisation (ANSTO), we routinely measure radiocarbon samples on two tandem accelerators: the 2MV STAR and the 10MV ANTARES machines. In addition, two new tandem accelerators, the 1MV VEGA machine and the 6MV SIRIUS machine, have been commissioned in the Centre for Accelerator Science (CAS) at ANSTO and both are capable of measuring 14C. More graphitization lines for the preparation of 14C samples are thus required to supply targets for these accelerator mass spectrometry (AMS) machines. The development of the microconventional furnace (MCF) increases our capability for the preparation of microgram-sized (5–100 μg C) and larger (100–2000 μg C) 14C samples (Santos et al. Reference Santos, Southon, Griffin, Beaupre and Druffel2007; Smith et al. Reference Smith, Hua and Levchenko2007a, Reference Smith, Hua, Williams, Levchenko and Yang2010a; Liebl et al. Reference Liebl, Steier, Golser, Kutschera, Mair, Priller, Vonderhaid and Wild2013).
This article describes an externally heated graphitization reaction vessel as a “conventional” furnace. We use an electrically heated tube furnace inside which the hot finger, containing 0.5–1.0 mg of iron catalyst, is placed. CO2 sample gas and hydrogen are introduced into the reaction volume, and the Bosch reaction (Manning and Reid Reference Manning and Reid1977) proceeds when the catalyst is heated to about 600°C. Filamentous graphite is precipitated out on the iron powder, which is then loaded into target holders, ready for insertion into an ion source (Vogel et al. Reference Vogel, Southon, Nelson and Brown1984). The speed and efficiency of the graphitization process are pressure-dependent. The MCFs are purpose-built to minimize the internal volume by machining the gas manifold and cold finger from stainless steel and providing integral valves. Furthermore, they can operate at nearly 3 times atmospheric pressure. Thus, they are ideal for the graphitization of extremely small CO2 samples.
We have previously described the laser heated furnaces (LHFs) developed at ANSTO (Smith et al. Reference Smith, Yang, Hua and Mann2010b; Yang et al. Reference Yang, Smith and Long2015). In both the prototype LHF-I and the improved LHF-II, the heating power is provided by a focused infrared laser and the catalyst temperature is measured by infrared thermometry. The LHFs have a smaller reaction volume than the MCFs and add only 0.05 μg of 100 pMC extraneous carbon (Yang et al. Reference Yang, Smith and Long2015); however, they are more expensive than the MCF and their use is restricted to sample sizes of less than ~100 µg C. The MCF furnaces are considerably cheaper, perform well for small samples, and can produce larger samples. Furthermore, there is no safety risk from the class 4 lasers used in the LHFs. Another motivation for developing the MCF was as an experimental platform for graphitization development and other novel applications. The MCF has been designed with this flexibility in mind.
DESIGN OF MCF
Overall System
Figure 1 shows a block diagram of the MCF setup that is comprised of three parts: (1) the core, a gas reactor with three valves that is machined from stainless steel; (2) an electrically heated “tube furnace” with a proportional–integral–derivative (PID) temperature controller that can heat to 850°C; and (3) a cold finger cooling system for trapping water produced during the graphitization reaction and for trapping CO2 gas during sample transfer (Yang et al. Reference Yang, Smith and Hua2013). Figure 2 shows details of a single MCF. In order to graphitize samples over a wide mass range, we designed two type of MCFs: the type 1 furnace with an integral stainless steel [3.2 mm outside diameter (OD), 35 mm length] cold finger, laser welded to the body, and the type 2 furnace with a Swagelok ¼-inch Ultra Torr™ fitting for changeable glass tube cold fingers.

Figure 1 Block diagram of the MCF showing three main components: gas reactor, tube furnace, and cold finger cooling system (separated by dashed lines). The light blue (gray) regions represent the vacuum manifold with pressure gauges and valves. Also provided here the part name and company of each electronic unit.

Figure 2 Photograph of a type 2 MCF with the following parts: (1) PID temperature controller of the tube heater; (2) tube heater; (3) gas reactor with three valves; (4) a spare sample vessel contacting with spare port; (5) a changeable glass cold finger; (6) sample vessel fitting in the sample port; (7) a cold finger cooling system for trapping both water and CO2 gas; and (8) temperature controller for the cold finger.
We manufactured four MCFs: two type 1 MCFs (named C1 and C2) and two type 2 MCFs (named C3 and C4). The type 1 MCF has a reactor volume of 0.9 mL and can be applied to graphitize CO2 gas containing 5 to 300 µg C. The type 2 MCF contains a reactor with a changeable volume of 1.3, 2, 5, or 10 mL depending on the type of cold finger fitted. It can be used to graphitize CO2 gas containing up to 2000 µg C. The type 2 furnaces can also be used for other applications; for example, we are investigating the combustion of methane gas and aerosol filters in these furnaces.
Gas Reactor Core
The core is machined from a block of stainless steel (64×64×26 mm) and electro-polished. Figures 3a and 3b are cross-sections of the type 1 core in the vertical and horizontal directions, respectively. Four components (stainless steel cold finger and three Swagelok ¼-in Ultra Torr fittings) are laser-welded to the block. The core has three valves. The valve in the center (see Figure 3a) connects to the hot finger (attached to an Ultra Torr fitting), a miniature pressure transducer, and to the cold finger. The other two valves are connected to the vacuum manifold/H2 feed system and to the sample vessel (see Figure 3b).

Figure 3 (a) A vertical cross-section through central of the core of type 1 MCF showing the reactor with the cold finger, 3.5-mm-diameter pressure sensor, reactor valve, and the port for the glass tube. (b) A horizontal cross-section through the core shows the interconnections between the valves and the tubes.
Before graphitization, we normally load about 1.2 mg of high-purity iron oxide powder as a catalyst into the hot finger: a disposable Pyrex® reaction tube (57 mm length, 6 mm OD), closed at one end. During graphitization, this tube is inserted into the tube furnace that is maintained at a temperature of 600°C by the PID controller. LabVIEW™ software is used to record the pressure in the gas reactor and temperature of cold finger for each of the units.
Tube Furnace
The tube furnace has two parts: the furnace body and the temperature controller. Figure 4 shows the furnace body, which is made from a central heating tube [6.5 mm inner diameter (ID), depth 35 mm, SS316] and two isolation tubes, also stainless steel. The central heating tube is wound with Ni80/Cr20 wire on the top of mica foil and provided with a K-type thermocouple to monitor the temperature. A 24-VAC power supply is used to run both the heater and the PID temperature controller (Omega CN9512-C4-LV). This tube furnace can heat from room temperature (RT) to 850°C within 15 min. This is sufficiently hot to combust methane in the presence of CuO, which is important for other applications. It consumes only ~30 W of power while maintaining the temperature at 600°C due to its effective thermal isolation. The PID controller is attached to the tube furnace and together they slide along a 20-mm-OD aluminum bar over the hot finger.

Figure 4 Photograph of an opened tube heater: (1) stainless steel cover; (2) bottom plate; (3) thermocouple wire; (4) stainless steel foil; (5) quartz wool; and (6) central heating tube. Items (1), (2), (4), and (5) provide very good thermal isolation of the heater.
Vacuum System
The vacuum manifold is shown in Figure 5 assembled on the work bench. This manifold has a total of 10 ports: six for connection to graphitization units (two laser-heated LHF-II and four MCFs), one to admit H2 gas, and another three ports under the bench that are connected to a turbomolecular pumping station, an MKS Baratron gauge, and a Pfeiffer PKR 251 cold cathode full range (5×10⁻⁹ to 1000 Torr) gauge. Each graphitization unit is linked to the manifold through a stainless steel bellows and a 90° angle valve.

Figure 5 The vacuum manifold of MCF and laser heated furnaces: (1) LHFa; (2) LHFb; (3)MCF C1; (4) C2; (5) C3; (6) C4; (7) H2 valves; (8) MKS Baratron gauge; (9) Pfeiffer PKR 251 gauge; (10) main vacuum valve; (11) turbomolecular pumping station; (12) system cold finger; (13) 90° angle valve link to graphitization units; and (14) vacuum manifold.
Cold Finger Cooling System
The system for refrigerating the integrated stainless steel cold fingers (and also the glass cold fingers) was described by Yang et al. (Reference Yang, Smith and Hua2013). This operates separately from the LabVIEW control system and permits the cold finger temperature to be rapidly changed between –60°C and –160°C, with modest use of liquid nitrogen.
Pressure Transducer and Thermocouples
To measure the pressure inside the reactor, we use a miniature, stainless steel, 3.5-mm-diameter, 0–3 bar absolute pressure transducer (Saiying Electronic Technology Development Inc., MTC-190). This transducer allows us to graphitize samples at a pressure near 3 bar, increasing the sample capacity and speeding the graphitization. The transducer is excited by 8.3 VDC and has an output signal of 5–100 MV that is amplified and converted to a 1–4.8 VDC signal by a Dual DIN Rail Temperature Transmitter (OMEGA Engineering Inc., TXDIN70 Series). The converted signal is linked to the LabVIEW control program through the NI USB-6221 interface. Additionally, the temperature signal of the cold finger, measured by a T-type thermocouple, is also converted to 1–4.8 VDC signals by these units and logged by LabVIEW.
GRAPHITIZATION PERFORMANCE
Graphitization Procedure
We have found that the best catalyst for use in the MCF is made by reducing high-purity iron oxide (Fe2O3, 99.999% from Sigma-Aldrich) in H2 gas. We separately reduce Fe2O3 in the MCF for each sample prior to graphitization. Efficient water trapping is important to improve the reaction speed and efficiency of graphite yield (Smith et al. Reference Smith, Petrenko, Hua, Southon and Brailsford2007b). For small samples (carbon mass<20 µg), two-step H2O trapping is used during graphitization, initially at –75°C and then at –160°C. This is possible because CO2 is quickly reduced to CO with a pressure drop to about half the initial pressure (Smith et al. 2007; Liebl et al. Reference Liebl, Ortiz, Golser, Handle, Kutschera, Steier and Wild2010). Once CO2 has been reduced, the lower trapping temperature results in a much lower water vapor pressure in the reactor. Figure 6 shows two examples of the pressure changes during graphitization as a function of time for 5- and 10-µg C samples. These data were recorded by LabVIEW.

Figure 6 Pressure versus time recorded during the graphitization of 5- and 10-µg C samples. The 10-µg sample plot shows a variation of pressure during graphitization: after 2 min, the temperature of the cold finger (TCF) was raised from –160°C to –70°C so that the CO2 was released from the cold finger; after 5 min, the pressure PCO2 was recorded, then TCF was again set to –160°C so the pressure dropped to zero; after 13 min, H2 was fed into the reactor, the isolation valve closed, and the cold finger set to –70°C; after 15 min, PCO2+H2 was recorded and the hot finger temperature set to 600°C; the pressure increased due to thermal expansion up to a peak at 16 min followed by a rapid decrease during graphitization; the reaction was complete after 29 min when the heater was pushed back to cool the hot finger to RT; after 32 min, the final pressure PEND was recorded and the manifold valve was opened, dropping the pressure to zero.
For graphitization of large samples (carbon mass>20 µg C), we normally apply one-step H2O trapping at –70°C for the entire graphitization reaction. The reaction typically takes 30 min to 4 hr depending on the mass of the sample. Figure 7 shows the graphitization of two samples containing 113 and 980 µg C, respectively. The standard graphitization procedure is as follows:
-
1. Load 1.0–1.4 mg of Fe2O3 powder into the hot finger, open all three reactor core valves to evacuate the MCF, and heat the Fe2O3 powder to 600°C for 10 min.
-
2. Set temperature of cold finger to –160°C. Fill the reactor with H2 gas to 700–800 mbar. Close isolation valve and set temperature of hot finger to 600°C and reduce Fe2O3 into the Fe catalyst for 1 hr.
-
3. Push the heater backward to cool the hot finger to room temperature. Connect the sample transfer flask to the MCF. Open all three reactor core valves to evacuate the MCF. Remove the cold finger cooler to warm up the cold finger to room temperature so trapped water can be removed.
-
4. Once the vacuum has reached 1.5×10⁻⁴ mbar or lower, set the cold finger temperature to –160°C, close the manifold valve, then open the sample transfer flask valve for 60 s to transfer the CO2 sample into the MCF reactor cold finger.
-
5. Close the isolation and sample valves, then open the manifold valve. Set the cold finger temperature to –70°C and record the pressure of the CO2 in the reactor (PCO2) (refer to Figure 6).
-
6. Set the cold finger temperature to –160°C again. Once the pressure has dropped to zero, close the vacuum station valve and open the isolation valve and H2 valve slowly, allowing H2 to fill the reactor (Figure 6). For small samples with Cmass<20 µg, fill with H2 to a pressure of (PH2) ~3× PCO2. For large samples (Cmass>20 µg), fill to PH2~2×PCO2 +50 mbar.
-
7. Close the isolation valve and set cold finger temperature to –70°C and record the pressure of the CO2 and H2 in the reactor (PCO2+H2).
-
8. Pull the heater forward to heat the hot finger to 600°C and start the graphitization; the pressure drops as the reaction proceeds. For small samples (Cmass<100 μg), when the pressure has dropped to about half that of PCO2+H2, set the cold finger temperature to –160°C. For larger samples, we keep the cold finger temperature at –70°C until the end of graphitization.
-
9. The reaction is finished when the pressure remains constant. Push the heater backward to stop the reaction.
-
10. Set the cold finger temperature to –70°C and record the pressure of the reactor as Pend. Calculate the efficiency of graphitization.
-
11. Get the MCF ready for preparation of another sample.
-
12. Press the graphite and catalyst into a 1-mm-diameter rear-loaded aluminum target for AMS measurement.

Figure 7 Pressure recorded during the graphitization of 113- and 980-µg C samples.
Efficiency of Carbon Yield
The efficiency of graphite production is calculated by using the three pressure values PCO2, PCO2+H2, and Pend, as
 $${\rm Efficiency}\,{\equals}\,0.5{\times}\left( {{\rm P}_{{{\rm CO2{\plus}H2}}} {\rm {\minus}P}_{{{\rm CO2}}} {\rm {\minus}P}_{{{\rm end}}} } \right)\,/\,{\rm P}_{{{\rm CO2}}} $$
This calculation is based on the assumption that residual gas contains only H2 and CO (Smith 2010b; Yang et al. Reference Yang, Smith and Hua2013). All three pressure measurements are made while the temperature of the hot finger is at room temperature and the temperature of the cold finger is at –70°C so that the vapor pressure of water can be ignored and the temperature gradients in the reactor are the same. Figure 8 shows the efficiency for standard and blank samples produced by the MCF. The efficiency for all the samples is near 100%, but in some cases the calculated efficiency exceeds 100%. For small samples, this is most likely because the small amount of Fe2O3 was not completely reduced to Fe in the reduction step, but was during the graphitization step; we have observed that it takes 2 hr to completely reduce 1.4 mg of Fe2O3. We reduce Fe2O3 for 1 hr instead of 2 hr to lessen the addition of 7Li and extraneous carbon to the sample and to save sample preparation time. Since 14C measurements on the ANTARES accelerator use the 14C4+ ion, 7Li2+ can also enter the detector (Loyd et al. Reference Loyd, Vogel and Trumbore1991). The results from the experiment indicate that the Fe2O3 powder is free of 7Li; however, after reduction in H2 at 600°C in the Pyrex glass tube, 7Li is present in the iron catalyst. It is an evident that 7Li is picked up from the glass during reduction of the catalyst. The degree to which this occurs depends on the concentration of Li in each individual glass tube. It is also related to the heating temperature and duration. We have found that careful selection of the Pyrex tubing and limiting the temperature to 600°C and duration to 1 hr minimizes the 7Li2+ background.

Figure 8 The efficiencies of carbon yield for graphitization of standard and blank samples with different masses.
For large samples, calculated efficiencies exceeding 100% were also observed due to incorrectly estimating the small quantity of CO2 that was initially trapped in the cold finger as a result of the higher pressure in the reactor. This means that PCO2 is less than it should be, leading to the efficiency >100%. To avoid this error, we need to set slightly higher cold finger temperature (–60°C for C mass>300 µg) and wait for a longer time for equilibrium to ensure that we get the correct PCO2 value. A higher cold finger temperature is also required during the graphitization to ensure CO2 is not trapped.
We also optimized the experimental parameters of the type 2 MCF for producing large samples. The MCF is able to completely graphitize CO2 containing 2000 μg of carbon in 4 hr with the hot finger at 650°C and the cold finger at –70°C using 1.0 mg of iron catalyst. By comparison, complete graphitization of the same amount of CO2 with our routine graphitization system takes more than 18 hr. The following factors are important for increasing the reaction speed: (1) using a higher catalyst temperature; (2) using a higher pressure (PCO2+H2 >1 bar) in the reactor; (3) using a lower cold finger temperature for effective water trapping; and (4) using a high-quality catalyst.
GRAPHITE PERFORMANCE IN AMS
13C Current
A series of blanks produced from 14C-depleted CO2 gas (0.03±0.01 pMC) over a range of carbon masses were graphitized by the MCF and were measured by the ANTARES accelerator. Table 1 summarizes the mean 13C4+ current during the first 10 min of measurement. Because the cesium flow was changed during the run, the performance of a large natural graphite sample was used to normalize the listed currents. It is interesting to note that the ratio 13C4+ current to Cmass has a maximum between 10 and 20 μg C with a Fe mass of 1 mg. By comparison, the LHF (Smith et al. 2010) has a maximum for ~5 μg C with an Fe mass of 0.5 mg. This indicates that the LHF has an advantage for making sub-10-µg C graphite targets. The difference could be caused by the different Fe mass and because graphite produced by the LHF is deposited in a small area where the laser is focused, whereas graphite produced by MCF is deposited uniformly over the catalyst. In addition, Table 1 also demonstrates that the quantity of catalyst plays a very important role. For 10-μg C samples, the current is doubled when the Fe mass is halved. Higher currents are generally desirable, but the longevity of useful measurement time is also an important consideration.
Table 1 Carbon mass, 13C current, mass of Fe catalyst (reduced Fe2O3), and current/Cmass for MCF C1 and C2. Each sample was prepared by graphitizing 14C-depleted CO2 gas. The currents were normalized to a large natural graphite target that produced mean 13C4+ current of 606 nA in the first part of the run and 660 nA after the cesium flow was increased. The listed currents correspond to the low cesium flow.

Figure 9 shows the performance of a 31.8-µg C standard sample with 1.0 mg of Fe during two 10-min periods of measurement. It can be seen that this sample gave a stable current and 14C/13C ratio over this period and could be measured for much longer if necessary.

Figure 9 Original data of a 31.8-µg C standard CO2 sample graphitized by C1 and measured by AMS using ANTARES. This sample was measured for two non-concurrent 10-min periods. Diamonds show the 14C/13C ratio, while dots show the 14C/13C current. Solid lines are the mean 14C/13C ratios for each 10-min period.
Extraneous Carbon
Extraneous carbon (Cex) is contaminant carbon added to the sample carbon during the sample preparation steps that lead to the production of CO2 and finally in the graphitization step itself. Data reduction for small-sample 14C AMS analysis involves a correction for “procedural background,” which allows for the addition of this extraneous carbon. Santos et al. (Reference Santos, Southon, Griffin, Beaupre and Druffel2007) and Southon (Reference Southon2007) studied the sources of extraneous carbon introduced during graphitization. Complete characterization of the mass and activity of this extraneous carbon is desirable, but involves the preparation and measurements of a series of blanks along with a series of standards over a range of masses. A simpler procedure involves just producing a series of blanks and assuming that the extraneous carbon has an activity of 100 pMC. The mass of this material can then be easily determined.
Figure 10 reports the results for a series of blanks produced by the MCF when reduced Fe2O3 has been used as catalyst. The data were collected from different experimental runs on the ANTARES accelerator. The data are consistent even though the runs were separated by years. This indicates the extraneous C introduced by the MCF is quite constant over time. As expected, the measured activity to scale linearly with 1/µg C (Hua et al. Reference Hua, Zoppi, Williams and Smith2004), we fit pMC versus 1/µg C by the equation Y(pMC)=0.03 + a × X(1/µg C); the intercept is the measured activity for large samples of the 14C-depleted CO2. The results are consistent with 0.083±0.03 µg (R=0.96), 0.085±0.04 µg (R=0.95), 0.087±0.04 µg (R=0.95), and 0.099±0.06 µg (R=0.97) of extraneous 100 pMC carbon for MCFs C1, C2, C3, and C4, respectively. Within error, the four MCFs add similar Cex, although the type 1 furnaces add slightly less. This is attributed to the cold finger design. The type 1 MCF is designed for graphitizing small samples and has the stainless steel cold finger welded to the reactor. The type 2 MCF has changeable glass cold fingers. These cold fingers have a larger surface area and a vacuum seal, which may contribute additional extraneous carbon to the sample.

Figure 10 The extraneous carbon added during graphitization by introducing 14C-depleted CO2 sample of varying mass and plotting the measured activity versus 1/mass, was fitted by the equation: Y(pMC)=0.03+a * X (1/μg C): for C1 and C2 and for C3 and C4.
By comparison, we found that the Cex for LHF-II is 0.05 µg C of 100 pMC material, about 40% lower than that of the type 1 MCF (Smith et al. Reference Smith, Yang, Hua and Mann2010b; Yang et al. Reference Yang, Smith and Long2015). We attribute this to the reduced hot surface area in the LHF-II, but it may also be a consequence of using less iron catalyst (0.5 mg for LHF-II, 1.0 mg for MCF). Our preliminary experiments show that the MCF performs well with 0.5 mg of iron for samples<300 µg C and so we will investigate this further. At ANSTO, 6 of the 24 conventional graphitization units are optimized for preparing small samples (Hua et al. Reference Hua, Zoppi, Williams and Smith2004). The volume of these reactors is 3.5 mL (nearly 4 times larger than the MCF) and Cex is significantly higher at 0.14 μg C of 100 pMC material. To compare with other systems, the National Ocean Sciences Accelerator Mass Spectrometry (NOSAMS) Facility developed an ultra-small graphitization reactor (Shah Walter et al. Reference Shah Walter, Gagnon, Roberts, McNichol, Gaylord and Klein2015). This has a reported a Cex value of 0.28±0.1 μg C with Fm=0.43±0.3. In terms of 100-pMC material, this is equivalent to 0.12 μg C, similar to our conventional furnaces but higher than for either type of MCF. This may be due to the difference in design approach or to different operating procedures or some measure of both. The compact structure of the type 2 MCF and integral cold finger should minimize opportunities for outgassing and for leakage.
We also measured a series of small OX2 samples that were graphitized in the C1 and C3 MCFs in an attempt to constrain the activity of Cex. In order to minimize the contribution of Cex from combustion, five specially designed sample splitting vessels (SSV) were utilized to obtain mounts of microgram CO2 by volumetrically splitting large gas samples. Figure 11 shows a photograph of an SSV. When V1 and V2 are opened, the CO2 sample can be cryogenically transferred to the bottom of the vessel. After equilibration, V2 is closed and the split samples can be transferred from the smaller volume into MCF. We have determined that 15 min is required to achieve equilibrium and avoid fractionation. The five SSVs have different splitting ratios (R) that range from 36 to 105. The advantages of using the SSV include (1) the contribution of combustion Cex is significantly reduced by the factor 1/R and we can obtain microgram quantities of CO2 with R times more accuracy by weighting an R times large amount of oxalic acid salt for combustion.
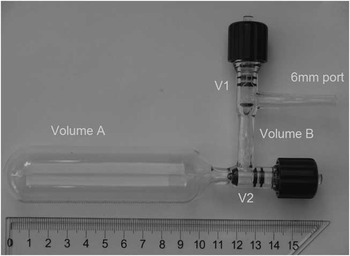
Figure 11 The SSV has two valves. It is a very important tool at ANSTO for preparing small standard samples.
For this experiment, five large amounts of OX2 were loaded and flame-sealed into ~80-mm-long, 6-mm-OD quartz tubes together with ~300 mg of CuO and Ag wire. These were combusted overnight at 900°C. After removing the water of combustion, the CO2 was transferred into five separate SSVs. To ensure we avoided fractionation, at least 40 min was allowed for equilibration before isolating the small volume by closing the V2. Each SSV was connected to an MCF and the small split was admitted for graphitization. The results are shown in Table 2. The pMC values were normalized to large OX2 standards and were corrected for machine background, determined with spectroscopic graphite samples depleted in 14C. They have been normalized to –25‰ but no other corrections have been made. The error-weighted mean for all these measurements is 131.08±0.20 pMC. There is no significant difference between the samples graphitized on furnaces C1 and C3 and there is no significant trend with carbon mass. For this reason, it appears that the actual activity of Cex must not be very different to that of OX2: 134.09 pMC. It is clear that the measured activity of these small OX2 is smaller, but this cannot be attributed to the addition of 14C-depleted material during graphitization. This decrease must be due to fractionation in the ion source or accelerator. This is in agreement with the experiments we reported in Smith et al. (Reference Smith, Hua, Williams, Levchenko and Yang2010a) where “artificial” small samples were prepared by mixing aliquots of OX1 with Fe catalyst. This result indicates that Cex blank can be ignored during the graphitization by MCF, and the assumption that the extraneous carbon has an activity of 100 pMC is reasonable.
Table 2 Experimental parameters of preparation of the small OX2 samples together with the pMC values by AMS.

Cross-Contamination
We tested cross-sample memory in the MCF by preparing a ~30-µg C blank, followed by a ~120-µg C OX2, followed again by another ~30-µg C blank; the results are given in Table 3. For all four MCFs, the second blank measured less than the first and both measurements were very low, confirming that sample memory is not an issue with the MCF. As can be seen from the table, graphitization of 30-µg C blank yielded an average value of 0.22 pMC for the four MCFs. The absence of memory is due to the internal surface area of MCF being very small and the fact that most of the internal surfaces are stainless steel, including the pressure transducer. These pressure transducers have proven to be reliable, unlike others that we have used in the conventional furnaces that failed due to hydrogen embrittlement and so developed reactor memory.
Table 3 The memory was tested in the MCF C1, C2, C3, and C4 by preparing a ~30-µg C blank (Blank pre-OX2), followed by a ~120-µgC OX2, followed again by another ~30-µg C blank (Blank Post-OX2). The result indicates that MCFs have no memory of previous samples. The pMC values of Blank Pre-OX2 are higher than the pMC values of Blank Post-OX2 due to the contamination of the transfer line during the transfer of the first set of the four CO2 samples. In addition, comparing with Table 2, it can be noted that the lower pMC of OX2 samples because the CO2 gas was obtained from directly combusted oxalic acid without further splitting by SSV to reduce the blank Cex during the combustion.

CONCLUSION
We manufactured two types of MCF of unique design. The type I MCF was purpose-built to minimize the internal volume (0.9 mL) with a welded stainless steel cold finger. It can operate with samples from 5 to 360 µg C. The type II MCF was designed for graphitizing both small and large samples and can operate with samples from 5 to 2000 μg C by changing the glass cold finger, with total reactor volume from 1.3 to 10 mL. Both types of MCFs can operate at pressures up to 2500 mbar, thus significantly reducing the reaction time and increasing the graphite yield. Both the type 1 and type 2 MCF offer compact and cost-effective solutions for producing very small graphite targets suitable for AMS from CO2 sample gas. Compared with other electrically heated graphitization systems, they add very little modern extraneous carbon and cross-contamination between samples. They are easy to operate, extremely reliable and robust, and are electrically safe as they use only 24 V.
ACKNOWLEDGMENTS
We are grateful to thank Shane Long and Michael Mann for MCF drafting and design assistance. In addition, we also thank Benjamin Hmiel and Michael Dyonisi for assistance in sample preparation and data analysis.


