


INTRODUCTION
The bluemouth, Helicolenus dactylopterus (Delaroche, 1809) (Pisces: Sebastidae), is a benthic deep-water scorpionfish found at depths of 200–1000 m. It is widespread in the eastern Atlantic Ocean, from Norway to South Africa, and around the Azores, Madeira and the Canary Islands (Hureau & Litvinenko, Reference Hureau, Litvinenko, Whitehead, Bauchot, Hureau, Nielsen and Tortonese1986). In Portuguese waters, H. dactylopterus is caught by a multispecies fishery that uses both bottom longline and trawl net (Figueiredo et al., Reference Figueiredo, Figueiredo and Moura1995) and is the most important commercial scorpaenid, with more than 2500 t landed annually in the past decade (DGPA, 2009). Despite its economic importance, very little information exists on its biology and in the early life stages in particular. Bluemouth is known to have internal fertilization the embryos being released in the early stage of development (Sequeira et al., Reference Sequeira, Figueiredo, Muñoz and Gordo2003) and larvae occur in the zooplankton.
The species live in strong association with submarine mountains in the vicinity of deep canyons (Figueiredo et al., Reference Figueiredo, Figueiredo and Moura1995) which may suggest a rather sedentary existence (Uiblein et al., Reference Uiblein, Lorance and Latrouite2003), which can help constitute the local populations. In fact, tagging experiments around the Azores archipelago strongly suggest that adult fish lead a very sedentary life style, as many tagged specimens have been recaptured, after more than one year, exactly in the same places as they were originally caught and tagged (Aboim, Reference Aboim2005). The larval behaviour however is not known. The presence of seamounts and oceanic islands in combination with several patterns of circulation flow and water masses may contribute to generate trapped parcels of water around these features (e.g. Taylor columns on seamounts) acting as larval retention mechanisms (Rogers, Reference Rogers1994). On the other hand, it is known that many deep-water species present an extensive larval phase with high levels of dispersal and, as a result, they should exhibit a lack of stock structure on oceanic, regional and sub-regional scales (Aboim, Reference Aboim2005).
The stock structure of bluemouth in the north-eastern Atlantic is unknown. Several definitions of stock concept exist (e.g. Ihssen et al., Reference Ihssen, Brooke, Casselman, McGlade, Payne and Utter1981; Hilborn & Walters, Reference Hilborn and Walters1992) but its final application is to understand the stock structure of a species in order to properly assess and manage fish resources (Begg et al., Reference Begg, Friedland and Pearce1999). Each fish stock is identified on the basis of a number of distinctive characteristics that vary due to environmental and genetic factors. Although both genotypic and phenotypic approaches should be used to analyse the stock structure of a species, phenotypic differences can provide a firm basis for separate management units (Cadrin & Friedland, Reference Cadrin and Friedland1999) in part due to the broad number of techniques that can be used to identify stocks (Begg et al., Reference Begg, Friedland and Pearce1999). Otolith shape is one of these techniques that have been successfully used in stock identification (Waldman et al., Reference Waldman, Richards, Schill, Wirgin and Fabrizio1997) and, in comparison to other stock identification methods, is less subject to short-term variability caused by changes in feeding or spawning condition (Cadrin & Friedland, Reference Cadrin, Friedland, Cadrin, Friedland and Waldman2005).
Otolith shape is species-specific and the morphology can often vary geographically within a species (Lombarte & Lleonart, Reference Lombarte and Lleonart1993). Several environmental factors alter the rate of otolith growth, which in turn may modify the otolith shape. Moreover different genotypes can also induce differences in otolith shape (Cardinale et al., Reference Cardinale, Doering-Arjes, Kastowsky and Mosegaard2004). As long as genetic or environmental differences exist and the populations remain at least partially segregated, the otolith shape might vary (Campana & Casselman, Reference Campana and Casselman1993), which strengthens the validity of shape analysis for stock identification.
Otolith shape analysis has been successfully applied in stock identification using Fourier transformations of the outline coordinates (Bird et al., Reference Bird, Eppler and Checkley1986; Campana & Casselman, Reference Campana and Casselman1993; Friedland & Reddin, Reference Friedland and Reddin1994), and more recently, the elliptic Fourier analysis (Tracey et al., Reference Tracey, Lyle and Duhamel2006; Mérigot et al., Reference Mérigot, Letourneur and Lecomte-Finiger2007; Stransky et al., Reference Stransky, Murta, Schlickeisen and Zimmermann2008).
Elliptical Fourier functions represent a precise method for describing and characterizing outlines, efficiently capturing outline information in a quantifiable manner and thus extracting a significant percentage of biological information (Lestrel, Reference Lestrel1989, Reference Lestrel1997). The utilization of elliptical Fourier analysis surpasses some of the limitations of conventional Fourier analysis: equal divisions over the interval sampled; dependency of the coordinate system; and the difficulty of dealing with the outlines that curve back on themselves (Lestrel, Reference Lestrel1989).
The main goal of this paper is to assess possible differences in the otolith shape of bluemouth caught in the Azores, Madeira and mainland Portugal using elliptical Fourier analysis and multivariate statistical analysis and therefore contribute to highlight the stock structure of this species in the north-eastern Atlantic.
MATERIALS AND METHODS
Sample collection
Bluemouth specimens were sampled from commercial landings of fishing vessels operating off mainland Portugal (Peniche), Madeira and Azores archipelagos (Figure 1) from November 2005 to March 2008. For each individual, total length (TL, ± 1 mm) and sex were recorded. Sagittal otoliths (hereafter referred to as otoliths) were taken as pairs, rinsed with water, air dried and stored in labelled plastic tubes.
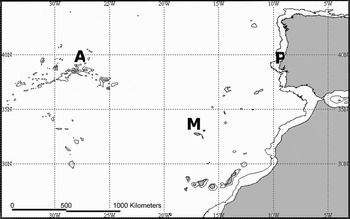
Fig. 1. Map with the sampling locations of bluemouth and the 1000 m isobath. A, Azores archipelago; M, Madeira archipelago; P, Peniche (mainland Portugal).
A total of 294 individuals were analysed, 49 females and 49 males from each area. Males ranged from 23.6 to 29.8 cm in the Azores, from 23.1 to 29.7 cm in Madeira, and 23.5 to 29.9 cm in mainland Portugal, while females varied from 23.0 to 29.9 cm in the Azores, from 23.0 to 29.7 cm in Madeira, and from 23.1 to 29.8 cm in mainland Portugal.
In order to restrict the analysis to sexually mature individuals and minimize the variability caused by size-related effects, samples were restricted to fish within 23–29 cm TL range for each sex in the three areas, and whenever possible the same number of fish for each length-class (1 cm) was sampled for each area.
Due to the limited number of specimens obtained for Madeira archipelago and to guarantee a balanced number of observations, a total of 49 otoliths per sex and area were used.
Image and shape analysis
Digitized images for each right otolith were captured using a video camera (Leica DFC290) linked to a Wild stereomicroscope (6× magnification). Otoliths were immersed in a 1:1 glycerine–alcohol solution, positioned concave side up (sulcus acusticus down) and rostrum pointing to right before image capture under reflected light.
The elliptic Fourier approximation described by Kuhl & Giardina (Reference Kuhl and Giardina1982) was used since it facilitates the analysis of two-dimensional forms (Lestrel, Reference Lestrel1989). This procedure consists of the decomposition of a curve into a sum of harmonically related ellipses. Each harmonic yields four coefficients that are used as input variables for standard multivariate analysis (Baylac & Frieβ, Reference Baylac, Frieβ and Slice2005).
The SHAPE 1.3 program (Iwata & Ukai, Reference Iwata and Ukai2002) was used to extract the elliptical Fourier descriptors (EFDs) from the contour shape of the otoliths. The ChainCoder package extracts the contour of an object from its digital image and stores the relevant information as chain-codes. The Chc2Nef package provides the normalized EFD coefficients (NEFDs) through a discrete Fourier transformation of the chain-coded contour, which causes the degeneration of the first three coefficients to fixed values: a1 = 1, b1 = c1 = 0. For each otolith, 100 harmonics were generated.
While the accuracy of the otolith shape reconstruction increases with the number of descriptors used, it is often desirable to reduce the number of harmonics for multivariate analyses. To select the minimum number of harmonics for the best reconstruction of the otolith outline, the level of 99% accumulated variance was adopted as suggested by Stransky et al. (Reference Stransky, Murta, Schlickeisen and Zimmermann2008). The variance of each harmonic is proportional to its amplitude and provides a measure of the influence of each harmonic on the outline form (Lestrel, Reference Lestrel1997). The variance for the nth harmonic is given by the expression:
where an, bn, cn and dn are the Fourier coefficients of the nth harmonic. Then the cumulated variance is calculated as  .
.
A random subsample of 10 otoliths for each sex and area was used to define the adequate number of harmonics needed for the analysis.
Statistical methods
Multivariate analysis of variance (MANOVA) was used to analyse the effect of area and sex on the NEFDs. Canonical discriminant analysis (CDA) was then performed to detect morphometric differences in the otolith of bluemouth from the three areas and to investigate if otolith shape could be used to classify samples in terms of area of origin. The stepwise method was used to choose which variables to include in the discriminant functions. Jackknife cross-validation procedures were used to calculate an unbiased estimation of classification success.
All statistical analyses were performed in Statistica 9.0 except CDA that was made with SPSS 17.0. The significance level was set at 0.05 for all the statistical tests used.
RESULTS
Image shape analysis
The mean and standard deviation of the cumulative variance of the harmonics are plotted in Figure 2. The otolith contours defined by 1, 5, 15 and 100 harmonics are also given.
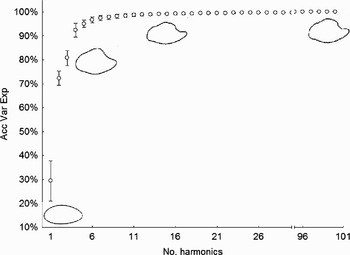
Fig. 2. Mean and standard deviation of the cumulative variance of 100 harmonics for 60 randomly selected otoliths. Acc Var Exp, accumulated percentage of variance explained by the nth harmonic. Otolith contours defined by 1, 5, 15 and 100 harmonics are also plotted.
A maximum of 15 harmonics (excluding the 1st harmonic) were needed to explain 99% of the otolith shape variation. Therefore, each individual was represented by the subsequent 61 coefficients (1 coefficient from harmonic 1 and 4 coefficients from harmonics 2–16).
Variance statistical analysis
The result of the MANOVA to compare the otolith NEFDs between the three areas and the sexes evidence statistically significant differences for both factors, but no interaction was found between them (Table 1). Since the effect of sex on the otolith shape was shown to be significant, all subsequent analyses were performed for each sex separately.
Table 1. Summary of multivariate analysis of variance (N = 294) on the otolith normalized elliptical Fourier descriptors coefficients from mainland Portugal, Madeira and Azores. Pillai, Pillai's test statistic; Wilks, Wilks's test statistic; df, degrees of freedom (numerator, nominator); P, P value.
Canonical discriminant analysis
The variables used in the stepwise discriminant analysis are given in Table 2. For the analysis of females, 14 coefficients were used, while 17 were used in the analysis of males. Lower and higher order coefficients were relevant for the discrimination for both females and males.
Table 2. Jackknifed classification matrix of the discriminant analysis applied to the three areas for females and males. Percentages in rows represent the classification into the areas given in columns (correct classification in bold). Overall classification success: 69.4%, Wilk's λ = 0.330 (females); 66.7%, Wilk's λ = 0.329 (males).

The differences among areas evidenced by the MANOVA were also supported by the CDA. An overall classification success of 69.4% and 66.7% was achieved for females and males respectively (Table 2). The highest rate classification was found for females from mainland Portugal with 76% success, while females from Madeira and males from Madeira and mainland Portugal showed less discrimination with 65%. The two discriminant functions were significant for the discrimination of sites in both females (f1: Λ = 0.330, P < 0.0001; f2: Λ = 0.684, P < 0.001) and males (f1: Λ = 0.329, P < 0.0001; f2: Λ = 0.722, P < 0.001). The score plots for the first two discriminant functions (Figures 3 & 4) show a separation between the three areas although some overlapping can be noticed. The first discriminant functions explained 70% of between group variance for females and 76% for males.
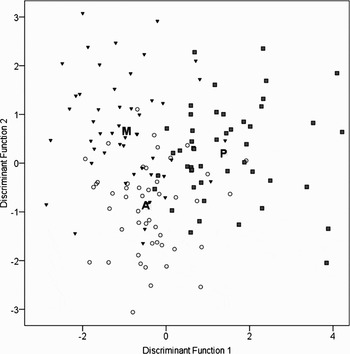
Fig. 3. Discriminant analysis function scores for female samples from the Azores (open circles), Madeira (black inverted triangles) and mainland Portugal (grey squares) based on 14 elliptical Fourier normalized descriptors of the first 15 harmonics. The letters indicate the class centroids.
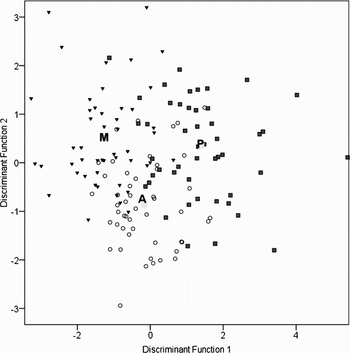
Fig. 4. Discriminant analysis function scores for male samples from the Azores (open circles), Madeira (black inverted triangles) and mainland Portugal (grey squares) based on 17 elliptical Fourier normalized descriptors of the first 15 harmonics. The letters indicate the class centroids.
DISCUSSION
The results obtained with the otolith shape analysis suggest its usefulness as a stock differentiation tool. The MANOVA performed on the bluemouth otolith shape coefficients revealed differences between sexes and among the three areas of Portuguese waters, which were subsequently supported by the discriminant analysis with moderate classification success values but highly above the aleatory ones. Stransky (Reference Stransky2005) found similar classification rates (72%–74% overall) between west, central and east regions in the North Atlantic for two Sebastes species closely related to bluemouth (Sebastes marinus (Linnaeus, 1758) and S. mentella Travin, 1951), although his study showed low discrimination when analysing the areas within these regions.
Nevertheless, some overlapping between areas can be noticed. Several confounding effects have been pointed out by Simoneau et al. (Reference Simoneau, Casselman and Fortin2000), namely: age, year-class and sex among others. In this work, the minimization of length effect was achieved restricting the length range as narrow as possible and analysing only adult individuals since Campana & Casselman (Reference Campana and Casselman1993) found that otolith shape analysis might be of negligible value to stock identification if applied to sexually immature fish. Also the elliptical Fourier descriptors were normalized for otolith size, rotation and starting point (Kuhl & Giardina, Reference Kuhl and Giardina1982; Iwata & Ukai, Reference Iwata and Ukai2002) in order to highly reduce these confounding factors in the analysis. The aggregation of data from different years is frequently used in otolith shape analysis studies (DeVries et al., Reference DeVries, Grimes and Prager2002; Tracey et al., Reference Tracey, Lyle and Duhamel2006; Farias et al., Reference Farias, Vieira, Gordo and Figueiredo2009) and although it is referred to as a possible confounding effect, Friedland & Reddin (Reference Friedland and Reddin1994) and Campana & Casselman (Reference Campana and Casselman1993) found no significance in the year effect on the otolith shape of Atlantic salmon and cod, respectively. Bergenius et al. (Reference Bergenius, Gavin, Begg and Mapstone2006) even mention that it would be good practice to compare multiple cohorts collected over several years so as to minimize confounding spatial variation in otolith shape with particular times of sampling and derive a time-averaged assessment of the spatial structure of a stock. Sexes were also analysed separately to minimize the number of sources of uncertainty and to highlight the real differences in otolith shape between the three areas.
The bluemouth stock structure in the north-eastern Atlantic is still unknown. The present results on otolith shape analysis clearly show their usefulness in supporting the existence of more than one stock unit in the southern north-eastern Atlantic (although their use in safely classifying new individuals from unknown sources to a known area is insufficient) reinforcing the evidence for a stock structure of bluemouth shown by other techniques. In fact, Aboim (Reference Aboim2005), using genetic studies with microsatellites markers, found evidence of some genetic differentiation between bluemouth of some areas in the north-eastern Atlantic. Swan et al. (Reference Swan, Geffen, Morales-Nin, Gordon, Shimmield, Sawyer and Massutí2006), using otolith chemistry, showed that Portuguese mainland samples were more similar in composition to the Mediterranean groups than to the Azorean or Rockall Trough samples, being a possible explanation for the existence of more continental material or any other characteristic of the water mass. More recently, Sequeira et al. (Reference Sequeira, Neves, Vieira, Figueiredo and Gordo2009) found significant differences for the growth rate of bluemouth populations of mainland Portugal and the Azorean waters. This probable stock differentiation is also supported by the species behaviour. Helicolenus dactylopterus dwell mostly around submarine mountains in the neighbourhood of deep canyons (Figueiredo et al., Reference Figueiredo, Figueiredo and Moura1995), and exhibit a rather sedentary behaviour (Uiblein et al., Reference Uiblein, Lorance and Latrouite2003), so the possibility of the existence of local populations constituting different management stocks is much more likely to occur.
Therefore, and as stressed by Cardinale et al. (Reference Cardinale, Doering-Arjes, Kastowsky and Mosegaard2004), otolith shape analysis can be seen as a complement technique towards an effective fisheries management. This methodology is also cheaper and/or more time efficient than several others (e.g. genetics, parasites and microchemical discrimination techniques).
Although other studies (parasites, more genetic techniques) should be implemented to clearly understand the stock structure of bluemouth in the north-eastern Atlantic, the available information indicates the existence of local populations of this species and the default management scenario should be to use a precautionary approach (e.g. to consider the three areas as separate stocks) to ensure resource sustainability and maintenance of genetic biodiversity (Begg & Waldman, Reference Begg and Waldman1999). A failure to recognize these stocks may lead to erroneous management actions, including the overexploitation of some stocks.
ACKNOWLEDGEMENT
This study was partially financed by the Fundação para a Ciência e Tecnologia (FCT) through the grant awarded to V. Sequeira (SFRH/BDD/22746/2005).


