1. Introduction
Lentil (Lens culinaris Medik. ssp. culinaris) is a short, slender, self-pollinated annual diploid (2n = 2x = 14) which exhibits a wide range of morphological variations. The cultivated species, L. culinaris, has been divided into two subspecies (Barulina, Reference Barulina1930): macrosperma (5–9 mm seed diameter (SD)) and microsperma (2–5 mm SD).
It is an important and ancient pulse crop that has been traditionally grown in West Asia, South Asia, Ethiopia, North Africa, and, to a lesser extent, southern Europe. It is also cultivated in South and North America and in Oceania (Erskine et al., Reference Erskine, Sarker, Kumar, Wrigley, Corke, Seetharaman and Faubion2016). In Argentina, it is grown in the central region of the country (Buenos Aires and Santa Fe provinces), where climatic conditions are generally very favorable for lentil production. However, since its cultivation is restricted to a single locally adapted variety (Silvina, macrosperma type), the major problem for Argentinian lentil breeders is the narrow genetic base of the current cultivated germplasm. No commercial varieties of the microsperma type are available.
The main objective of lentil breeding programs is to develop new genetically superior genotypes. To do this, different traits are taken into account, such as time of flowering, plant height (PH), stem fasciation, stipule size, color and number of flowers, pod size, pod dehiscence, seed size, seed coat color and spotting, as well as yield and its components (number of pods (NP) per plant and weight of 100 seeds (WS)).
To be used as an alternative to wheat in crop rotation schemes, the lentil varieties obtained should have short flowering cycles to allow the succeeding sowing of summer crops. For this reason, time of flowering is one of most important traits in addition to seed yield.
Bulk pedigree has been the preferred method for lentil breeding, in which crosses are advanced in bulk until F4 generation. This method is simple, requires minimal record keeping, and is used to obtain new varieties with adaptations because it includes the possibility of natural selection favoring genotypes adapted to particular environments. Nevertheless, in F4 generations it is necessary to select the best genotypes according to traits of high heritability; thereafter, F5 progenies are managed individually to increase the number of seeds (NS) to evaluate the different RILs in complex quantitative traits often influenced by environmental conditions and genotype–environment interactions. Among the quantitative traits, heritability is a highly useful parameter for the breeder because it reflects the reliability of the observed phenotypes for indicating genotypically superior individuals. A phenotype with decreased heritability becomes a poor indicator of the genotypic value due to the marked effect of environmental factors, which reduces the gain from selection.
The best linear unbiased prediction (BLUP) technique was developed by Henderson (Reference Henderson1985) to handle such highly unbalanced data in dairy cattle breeding. Plant breeders have applied this technique in wheat (Triticum aestivum L.) to predict performance of the parents (Lado et al., Reference Lado, Battenfield, Guzmán, Quincke, Singh, Dreisigacker, Peña, Fritz, Silva, Polland and Gutiérrez2017), in soybean (Glicine max (L.) Merrill) to identify the best progeny or lines in a commercial breeding program (Pereira et al., Reference Pereira, Bruzi, de Matos, Rezende, Prado and Nunes2017), in black beans (Phaseolus vulgaris L.) to evaluate the genetic potential and progress of genotypes for grain yield and plant cycle characters (Bertoldo et al., Reference Bertoldo, Nodari, Coimbra, Guidolin, Toaldo, Pinho de Morais and Elias2014), and in four grain legume crops (Pisum sativum L., Vicia faba L., L. culinaris Medik., Cicer arietinum L.) to find the most suitable genotypes based on genotype–environment interactions (Avola et al., Reference Avola, Riggi, Gresta, Sortino and Onofri2018). Tabti et al. (Reference Tabti, Laouar, Rajendran, Kumar and Abdelguerfi2018) used BLUP to identify new desirable mutants in quantitative traits of lentil; however, to the best of our knowledge, BLUP has not been used either to select the best genotypes in a breeding program or to estimate the genetics parameters in this crop.
BLUP is used to provide a better fit of the phenotypic value to the non-genetic effects by shrinkage effect toward the expected genetic values. Chiorato et al. (Reference Chiorato, Carbonell, Dias and Resende2008) proved that BLUP was effective for estimating genetic parameters and predicting genotypic values and concluded that the method can be used routinely in genetic improvement programs for the common bean.
The aims of this study were to (i) identify, through breeding values and molecular markers, the genotypes with the highest merit that could become potential commercial varieties or be used as parental lines in future lentil hybridization programs and (ii) estimate, using BLUP, the genetic parameters such as heritability, genetic variance, and genetic correlations to know the genetic control of morphological traits in lentil.
2. Materials and Methods
2.1 Development and selection of RILs
This study was carried out from 2011 to 2016 at the Experimental Field ‘J. F. Villarino’ of the College of Agriculture of National University of Rosario, Argentina (331’ S and 6053’ W).
In our breeding program the methodology was based on a bulk selection method from F2 population to F4 families with single plant selection at F5.
In 2012, 20 F4 lentil families of the subspecies macrosperma and 10 of the subspecies microsperma derived from the grain legume breeding program of the College were planted in the Experimental Field ‘J. F. Villarino,’ following a randomized complete block design (RCBD) with 2 replications of 20 plants per family in each replicate. Spacing between plants and rows was 0.10 and 0.70 m, respectively.
The following characters were recorded in single plants of each F4 family: NP per plant, PH in cm, SD in mm, pod length in mm (LP), and pod width in mm (WP), number of nodes at the first pod (NNFP), and total number of nodes per plant (NTN). NNFP and NTN are morphological traits connected with precocity and PH, respectively. Days to flowering (DF) was measured as numbers of days from sowing to 50% of plot flowering.
The average data collected in each replicate of F4 families were analyzed by analysis of variance (ANOVA) to determine significant differences among the 30 families, and a dispersion diagram was also carried out using InfoGen software (Balzarini and Di Rienzo, Reference Balzarini and Di Rienzo2003). Six best families were selected based on independent culling levels for precocity and high NP. Twenty-two F5 plants within each of the six selected families (132 plants in total) were analyzed based on flowering days and NP per plant through a dispersion diagram generated with InfoGen, and 25 F5 recombinant inbred lines (RILs) were selected. These materials were multiplicated for 2 years to increase the NS. In 2015 and 2016, the RILs were sown in 5-dm3 pots (1.2 kg soil/pot) filled with a mixture of sterile soil, peat, and perlite (1:1:1) as substrate. Plants were grown in a greenhouse with natural light without temperature regulation, and supplemental irrigation was applied throughout the growing period. The commercial variety ‘Silvina’ was used as tester. In 2015 and 2016, the RILs and the tester were sown in the field in plots of 40 plants, with a spacing of 0.70 m between rows and 0.05 m between plants under rainfed conditions. Agronomic and plant protection management practices were applied uniformly across the plots throughout the experiment. Thus, four environments were defined: Environment 1 (ENV 1): Greenhouse 2015; Environment 2 (ENV 2): Greenhouse 2016; Environment 3 (ENV 3): Field 2015; Environment 4 (ENV 4): Field 2016. In the four environments all materials were sown in a completely randomized design with three replications, considering as experimental units the pot in the greenhouse, and the plot in the field. The following observations were recorded: NP per plant; NS per plant; PH (cm); DF, measured as numbers of days from sowing to 50% of plot flowering; SD (mm); yield per plant (Y) (g); and WS (g) measured at the dry seed stage.
2.2 RILs phenotypic evaluation
The values of the different traits were compared by a combined ANOVA. Previously, the normality of the variables and the residuals were determined by the Shapiro and Wilk test (Reference Shapiro and Wilk1965). Homoscedasticity was established by the Bartlett’s test (Reference Bartlett1937). Climate data were collected from the Pegasus meteorological station (Tecmes) located in the premises of the College of Agriculture, National University of Rosario, Villarino, Zavalla, Santa Fe.
2.3 RILs genotypic evaluation
MetaR software (Alvarado et al., Reference Alvarado, López, Vargas, Pacheco, Rodríguez, Burgueño and Crossa2016) was used to estimate breeding values through BLUP, heritability in the broad sense for each trait, and genetic correlations between traits. For all traits, it calculates variance components by restricted maximum likelihood (REML), least significant difference, coefficient of variation, and broad-sense heritability using a mixed model. For calculating BLUPs and broad-sense heritability, all effects were considered random except for the intercept. The model for the RCBD was
 $${Y_{ijk}} = \mu {\rm{ + Lo}}{{\rm{c}}_i} + {\rm{Re}}{{\rm{p}}_j}\left( {{\rm{Lo}}{{\rm{c}}_i}} \right) + {\rm{Ge}}{{\rm{n}}_k} + {\rm{Lo}}{{\rm{c}}_i} \times {\rm{Ge}}{{\rm{n}}_k} + {\varepsilon _{ijk}}$$
where Y is the trait of interest, μ is the overall mean (intercept), Loci is the location effect, Rep j (Loc i ) is the effect of the jth replicate within the ith location, Gen k is the effect of the kth genotype, Loc i × Gen k is the effect of the location × genotype interaction, and ε ijk is the error associated with the jth replication, ith location, and kth genotype. Broad-sense heritability of a given trait at an individual location is calculated as
 $${{\it{h}}^2} = {{\sigma _{\rm{\,\,\,g}}^2} \over {\sigma _{\rm{\,\,\,g}}^2 + \sigma _{\rm{\,\,\,e}}^2/{\rm{nreps}}}}$$
where
 $\sigma_{\rm{\,\,\,g}}^2$
and
$\sigma_{\rm{\,\,\,g}}^2$
and
 $\sigma _{\rm{\,\,\,e}}^2$
are the genotype and error variance components, respectively, and nreps is the number of replicates. For the combined analyses, heritability was calculated as
$\sigma _{\rm{\,\,\,e}}^2$
are the genotype and error variance components, respectively, and nreps is the number of replicates. For the combined analyses, heritability was calculated as
 $${{\it{h}}^2} = {{\sigma _{\rm{\,\,\,g}}^2} \over {\sigma _{\rm{\,\,\,g}}^2 + {{\sigma _{{\rm{\,\,\,ge}}}^2} \over {{\rm{nlocs}}}} + \sigma _{\rm{\,\,\,e}}^2/({\rm{nlocs}} \times {\rm{nreps}})}}$$
where the new term
 $\sigma _{{\rm{\,\,\,ge}}}^2$
is now the genotype × environment interaction variance component and nlocs is the number of locations in the analysis. Genetic correlations between traits were calculated following the equation:
$\sigma _{{\rm{\,\,\,ge}}}^2$
is now the genotype × environment interaction variance component and nlocs is the number of locations in the analysis. Genetic correlations between traits were calculated following the equation:
 $$\rho g = {{\overline {\sigma g(JJ')} } \over {\overline {\sigma g(J)\sigma g(J')} }}.$$
where
 $\overline {\sigma g(JJ^{\prime})}$
is the arithmetic average of all pairwise genotypic covariances between trait j and j´, and
$\overline {\sigma g(JJ^{\prime})}$
is the arithmetic average of all pairwise genotypic covariances between trait j and j´, and
 $\overline {\sigma g(J)\sigma g(J^{\prime})}$
is the arithmetic average of all pairwise geometric means among the genotypic variance components of the traits (Vargas et al., Reference Vargas, Combs, Alvarado, Atlin, Mathews and Crossa2013).
$\overline {\sigma g(J)\sigma g(J^{\prime})}$
is the arithmetic average of all pairwise geometric means among the genotypic variance components of the traits (Vargas et al., Reference Vargas, Combs, Alvarado, Atlin, Mathews and Crossa2013).
For each trait a ranking of the various genotypes was assigned. Since high breeding values are desirable for the traits PH, NP, NS, SD, WS, and Y, a score of 1 was assigned to the genotype with the highest breeding value. On the other hand, for the trait DF a score of 1 was assigned to the genotype with the lowest breeding value. With these scores, the average of rankings was calculated for each genotype taking into account all the traits. Based on these average rankings, a final ranking of the genotypes was estimated. The genetic advance as percent of tester was calculated as: GA
 $ (\%) = {{100\,k\,\sigma _{\rm g}^2} \over {\overline {Xt} {\sigma _{\rm ph}}}}$
, where
$ (\%) = {{100\,k\,\sigma _{\rm g}^2} \over {\overline {Xt} {\sigma _{\rm ph}}}}$
, where
 $\sigma _{\rm g}^2$
is the genetic variance, k is the selection intensity (the selection intensity used was 0.97, which corresponds to a selected proportion of 40%), σph is the phenotypic standard deviation, and
$\sigma _{\rm g}^2$
is the genetic variance, k is the selection intensity (the selection intensity used was 0.97, which corresponds to a selected proportion of 40%), σph is the phenotypic standard deviation, and
 $\overline {Xt} $
is the mean of the tester.
$\overline {Xt} $
is the mean of the tester.
2.4 Molecular analysis of RILs using sequence-related amplified polymorphism
To perform DNA extraction and sequence-related amplified polymorphism (SRAP) procedure, about 100 mg of fresh leaf tissue were ground in liquid nitrogen and the total genomic DNA was extracted using the CTAB method (Smýkal et al., Reference Smýkal, Horacek, Dostalova and Hybl2008). The amplifications were carried out in a thermo-cycler MyCyclerTM (BIO-RAD). At the beginning of the PCR reaction, the annealing temperature was set at 35 °C and run for 5 cycles. Then, the temperature was raised to 50 °C for a further 35 cycles. Denaturing was done at 94 °C for 1 min, while extension was carried out at 72 °C for 1 min in all cycles. Four forward primers and four reverse primers were used at random, originating nine SRAP combinations (me1-em1, me1-em2, me2-em1, me2-em5, me4-em1, me4-em4, me5-em1, me5-em2, me5-em5).
Primers ‘Forward’
me1, 5’-TGAGTCCAAACCGGATA-3’
me2, 5’-TGAGTCCAAACCGGAGC-3’
me4, 5’-TGAGTCCAAACCGGACC-3’
me5, 5’-TGAGTCCAAACCGGAAG-3’
Primers ‘Reverse’
em1, 5’-GACTGCGTACGAATTAAT-3’
em2, 5’-GACTGCGTACGAATTTGC-3’
em4, 5’-GACTGCGTACGAATTTGA-3’
em5, 5’-GACTGCGTACGAATTAAC-3’
The amplified fragments were separated in denaturing acrylamide sequencing gels and stained with silver. Presence or absence of SRAP fragments were scored as 1 and 0, respectively. Genetic distances were calculated with SRAP data according to Dice’s similarity index. A minimum cost spanning tree using Prim’s algorithm was performed using the InfoGen program (Balzarini and Di Rienzo, Reference Balzarini and Di Rienzo2003).
3. Results
3.1 Phenotypic evaluation of F4 and F5 generations
The ANOVA of F4 families showed significant differences between genotypes for all the traits evaluated, with 29 and 526 degrees of freedom for genotypes and experimental error, respectively. The traits NP, PH, DF, SD, LP, WP, NNFP, and NTN showed high discriminating values (p < 0.001) (F = 22.4; F = 22.8; F = 83.1; F = 105.3; F = 21.9; F = 14.8; F = 6.4; F = 8.4, respectively). These data point to the feasibility of selection due to the existence of genetic variability between families.
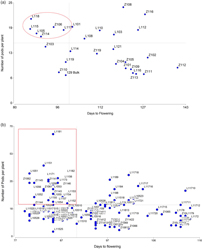
Since precocity and high NP are the most important traits for lentil selection, these values were plotted in a dispersion diagram. The best six families were selected because they were both above average in NP and below average in DF, based on independent culling levels (Figure 1a). The families L115, L105, Z114, and Z106 belong to the macrosperma type, and L117 and L118 to the microsperma type.
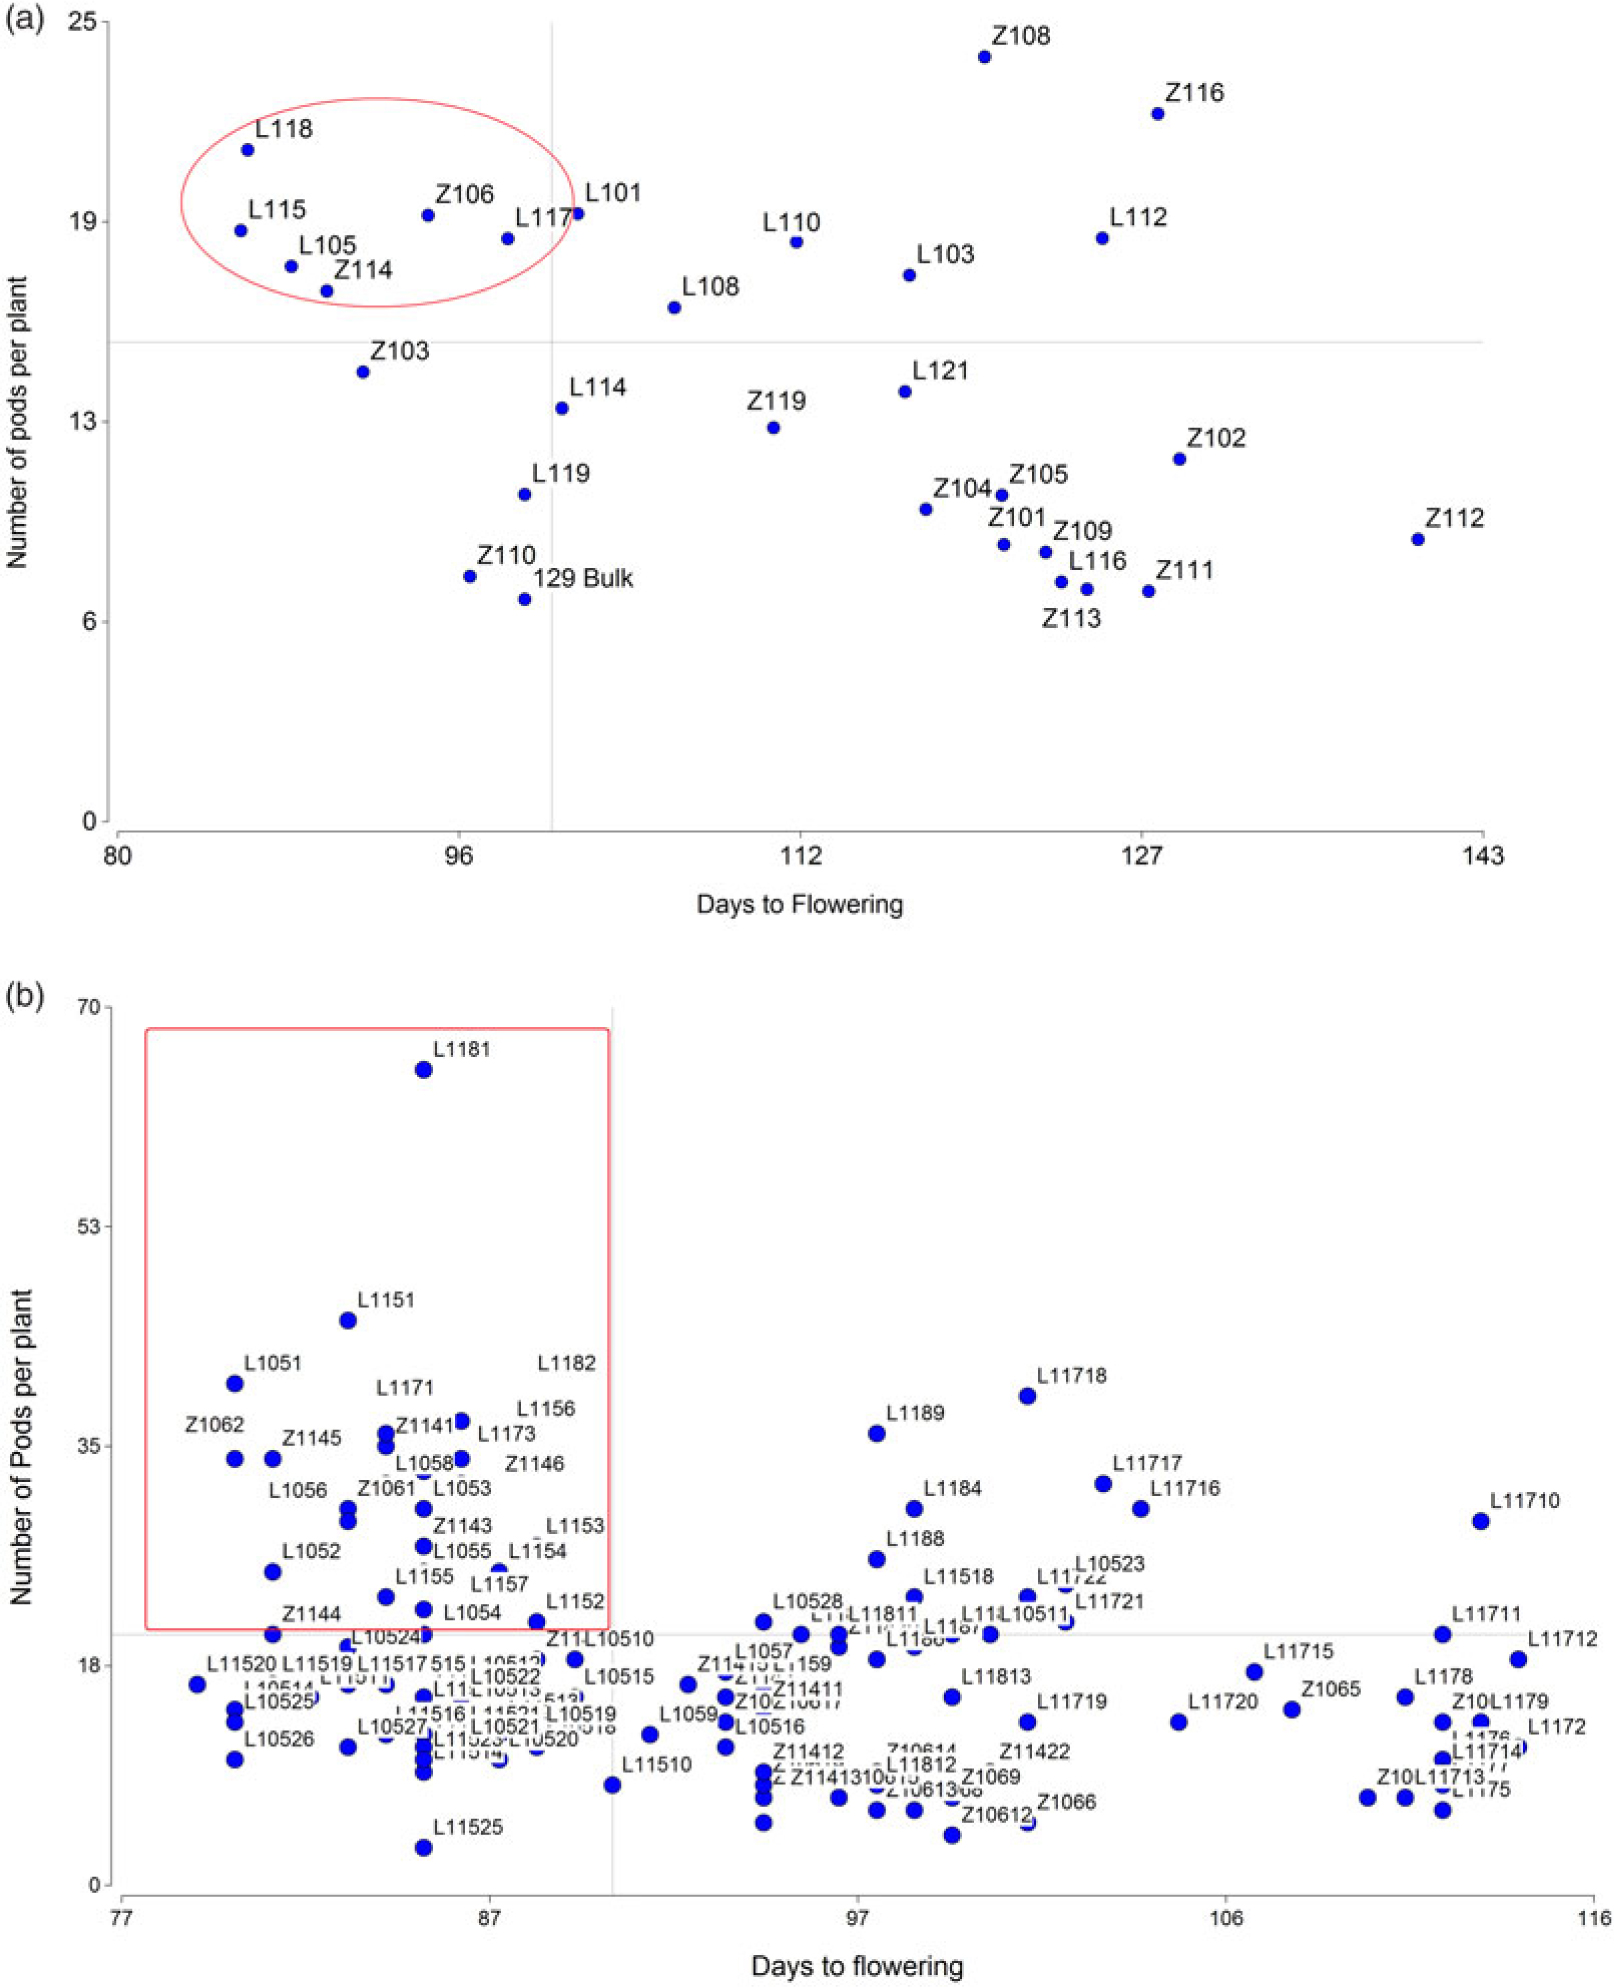
Figure 1. Scatter diagrams based on NP per plant vs. DF (a) Distribution of 30 F4 families showing the selection of the best six families based on independent culling levels (<100 DF and >15 pods per plant) (indicated within a circle) (b) Distribution of 132 F5 plants from the six selected families showing the selection of the best 25 RILs based on independent culling levels (< 95 DF, > 20 pods per plant) (indicated within a rectangle).
Figure 1b shows the distribution of 132 F5 plants from the six selected families, taking into account the same traits used in the F4 generation. Twenty-five F5 RILs were selected (<95 DF, >20 pods per plant).
The ANOVA of the 25 RILs and the tester sown in four environments showed significant differences between genotypes, environments, and genotype–environment interactions for all the traits (Table 1). Significant variations among the genotypes indicate the differences in the inherent genetic potential of the RILs that make selection possible, whereas differences among environments showed the different expression of variability. In greenhouse (ENV 1 and 2), the genotypes presented higher PH, lower NP and NS per plant, and seeds with higher weight which led to higher yield per plant compared with field-grown plants (ENV 3 and 4). SD did not show significant differences; however, there was a slight tendency to higher values in the greenhouse. With regard to DF, the genotypes presented similar cycles in all environments (Table 2). Rainfall amounts and average temperatures varied among cropping seasons. In 2015 and 2016, rainfall amounted to 67 and 50 mm in the sowing period (June–July), 9 and 13 mm in the flowering period, (September) and 85 and 139.4 mm in the grain-filling period (October–November), respectively. Significant differences were observed between greenhouse and field average temperatures. The average temperatures in the greenhouse were 17 and 15 °C in the sowing period, 25 and 28 °C in the flowering period, and 35 and 33 °C in the grain-filling period, in 2015 and 2016, respectively. In the field, temperatures were lower: 5 and 10 °C in the sowing period, 18 and 16 °C in the flowering period, and 25 and 19 °C in the grain-filling period, in 2015 and 2016, respectively.
Table 1. ANOVA of 26 RILs showing the effect of genotype (G), environment (E), and the interaction GE on PH (cm), DF, NP per plant, NS per plant, SD (mm), 100 seeds weight (WS) (g), and yield per plant (Y) (g)

df = degree of freedom; F = F value; Prob = Probability.
Table 2. Effect of the different environments (ENV) on the PH (cm), DF, NP per plant, NS per plant, SD (mm), 100 seeds weight (WS) (g), and yield per plant (Y) (g) for the 26 RILs. Means ± SE of 3 replicates

ENV 1 and 2 = greenhouse experiments; ENV 3 and 4 = field experiments.
Note: Mean values with the same letter within a column are not significantly different at p = 0.05 according to Fisher’s LSD procedure.
3.2 Breeding values and genetic parameters
As mentioned before, the genotype–environment interaction was significant for all the traits; so, in order to select the best genotypes excluding the environmental influence, it was necessary to obtain the genotypic values or breeding values for each character. The breeding values and average ranking of the different RILs for all the traits are shown in Table 3. Genotype L1051 ranked first, followed by L1052, L1053, L1054, Z1062, and Z1145, and they were better than the tester (‘Silvina’). Regarding the microsperma genotypes, L1171 and L1173 ranked poorly due to high DF and lowest yields, whereas L1181 and L1182 ranked in a better position due to higher yields. All these genotypes had a good performance both in field and in greenhouse conditions.
Table 3. Breeding values and genetic parameters for traits PH (cm), DF, NP per plant, NS per plant, SD (mm), 100 seeds weight (WS) (g), and yield per plant (Y) (g) using BLUP in lentil

Breeding values, ranking of each trait, and a new ranking of the different genotypes (rank) based on mean of the rankings (Average rank). Average rank is the average of the rankings assigned to each genotype taking into account all the traits. h
2 = heritability in the broad sense across environments;
$\sigma _{\rm{\,\,g}}^2$
= genetic variance;
$\sigma _{\rm{\,\,e}}^2$
= environmental variance;
$\sigma _{{\rm{\,\,ge}}}^2$
= genotype x environment interaction variance;
 $\sigma _{\rm{\,\,r}}^2$
= residual variance; LSD = least significant difference; CVg = genotypic coefficient of variation; GA = Genetic advance.
$\sigma _{\rm{\,\,r}}^2$
= residual variance; LSD = least significant difference; CVg = genotypic coefficient of variation; GA = Genetic advance.
Low genotypic coefficients of variation (CVg) were observed for PH and DF (5.80 and 6.85, respectively). In contrast, CVg showed high genotypic variability for NP, NS, and WS (22.03, 31.67, and 25.64, respectively) among lentil RILs (Table 3). This genetic variability is a prerequisite for selecting the best genotypes. On the other hand, high heritability values were recorded across environments for all traits (Table 3). Regarding heritability by environment, the values were high for all traits in ENV 1, 2, and 4, whereas the values for NP, NS, and Y in ENV 3 were of low and moderate magnitude because of the low expression of the genetic differences between RILs (
$\sigma _{\rm{g}}^2$
) (Table 4).
Table 4. Heritability in the broad sense (h
2) and genetic variances (
$\sigma _{\rm{\,\,g}}^2$
) by environment (ENV) for PH (cm), DF, NP per plant, NS per plant, SD (mm), 100 seeds weight (WS) (g), and yield per plant (Y) (g) using BLUP in lentil

As shown in Figure 2, two big groups of RILs (macrosperma and microsperma) could be differentiated according to the breeding values for DF, macrosperma genotypes being more precocious than microsperma genotypes (L1181, L1182, L1171, and L1173). In addition, within each group, genotypes were differentiated by their yield breeding values. All the macrosperma genotypes showed higher yields than the tester ‘Silvina.’ Within the macrosperma type, the selected RILs were L1051, L1052, L1053, L1151, Z1062, L1153, and Z1145, whereas L1181 and L1182 were selected within the microsperma type.
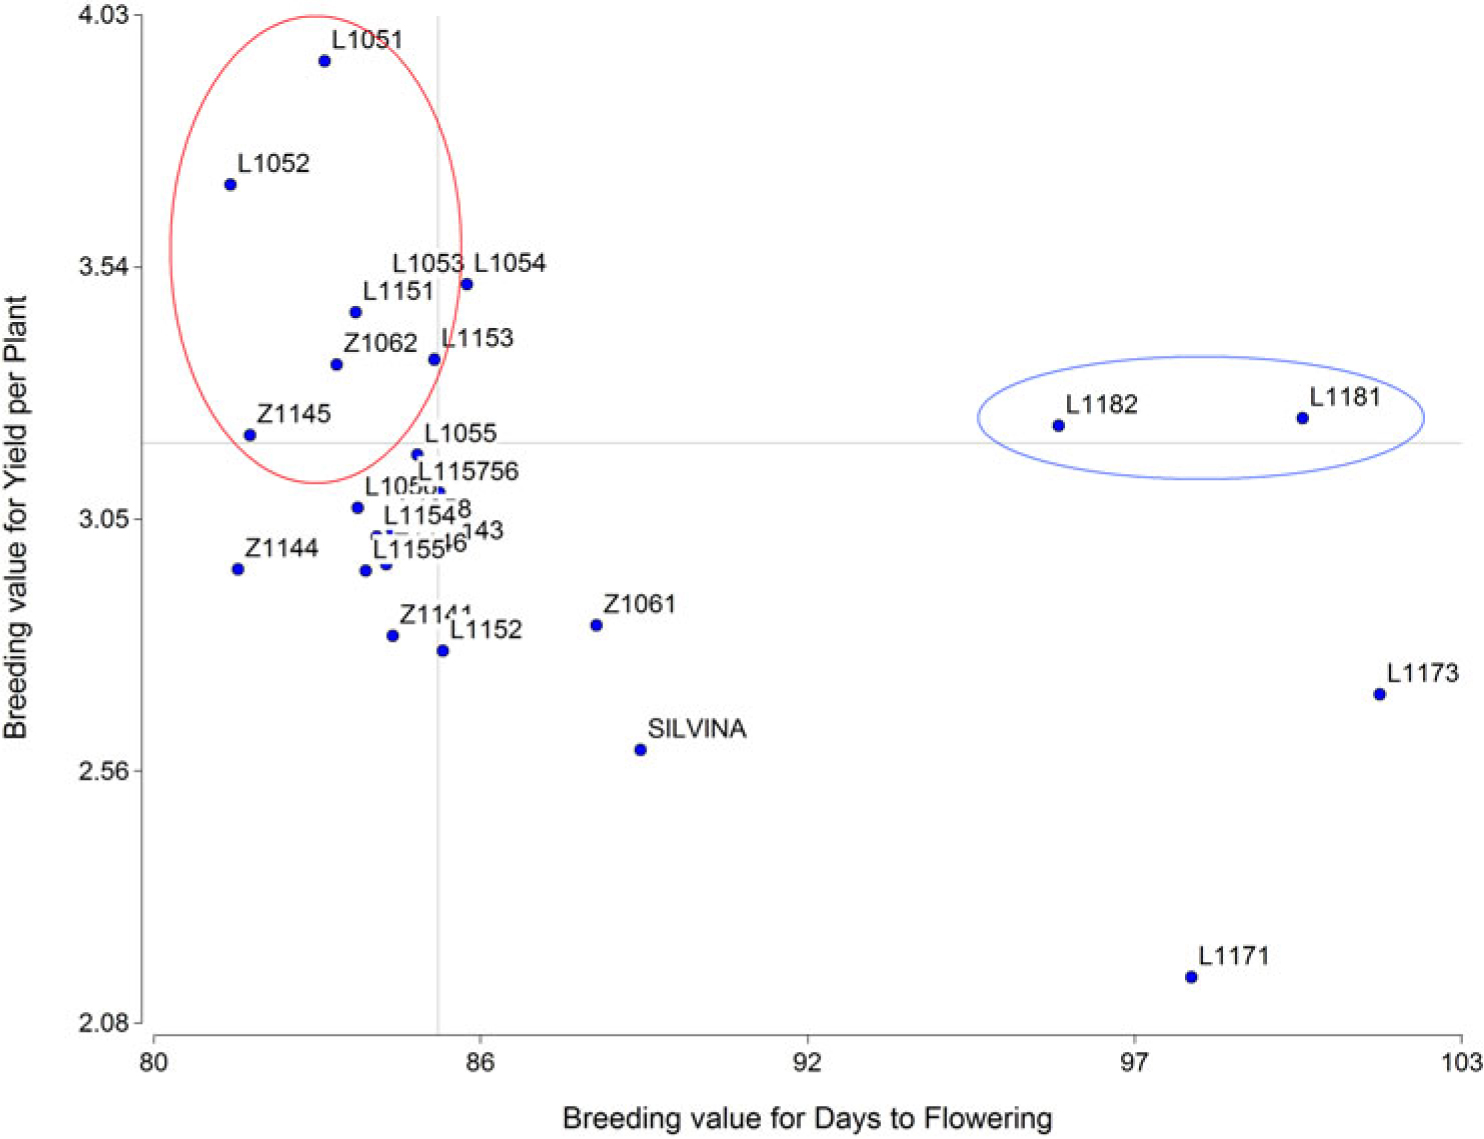
Figure 2. Best linear unbiased predictors (BLUPs) of breeding values for Yield per Plant vs. Days to Flowering for 26 lentil genotypes. The selected macrosperma and microsperma genotypes are indicated in a circle to the left and right respectively.
The genotypic correlation coefficients calculated among the traits examined are shown in Table 5. For macrosperma genotypes, a significant and positive correlation was found between PH and DF, SD, WS, and Y, whereas for microsperma there was a negative correlation between PH and DF and SD. Regarding seed yield, macrosperma types showed highly significant and positive correlations with NP and NS and negative correlation with DF, whereas seed yield of microsperma types had highly significant and positive correlations with NP, NS, WS and negative correlation with SD, but no correlation with DF.
Table 5. Genotypic correlations coefficients among different traits PH (cm), DF, NP per plant, NS per plant, SD (mm), 100 seeds weight (WS) (g), and yield per plant (Y) (g) for macrosperma and microsperma genotypes using BLUP in lentil

*significance at p < 0.05, **significance at p < 0.01, ***significance at p < 0.001.
3.3 Molecular analysis of RILs
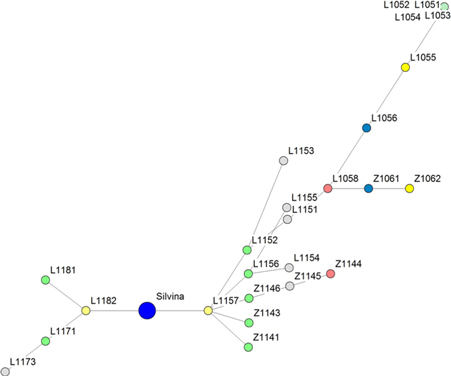
A minimum cost spanning tree using Prim’s algorithm is shown in Figure 3. The SRAP markers allowed allocating the RILs according to their phylogeny, thus partitioning the plot in two groups: macrosperma and microsperma types, with the tester being the principal node. Genotypes L1051, L1052, L1053, and L1054 could not be discriminated and were included in the same node.

Figure 3. Cost spanning tree compiled by Prim’s algorithm showing the phylogenetic relationships among 25 lentil RILs and the tester Silvina (principal node) based on SRAP data using Dice’s distances.
4. Discussion
A plant breeding program is a cyclical process aimed at the development of new cultivars, each cycle of which consists of three major phases: (i) generating genetic variability; (ii) selection and testing to identify superior recombinants, ending with the identification of potential cultivars; and (iii) release, distribution, and adoption of new cultivars: yield testing in multi-environment trials (METs) is either the last step of the second phase or the first step of the third (Ceccarelli, Reference Ceccarelli2015).
In our breeding program, the methodology was based on a bulk selection method from F2 population to F4 families. The quantitative traits for these generations were measured by phenotypic values because they were evaluated in a single environment. This method is a routine practice for lentil. Screening agronomic traits such as PH, pod number, DF, and seed yield are used usually as a selection criterion in breeding programs during early generation multiplication and evaluation phases (Rahimi et al., Reference Rahimi, Houshmand, Khodambashi, Shiran and Mohammady2016). Materne and McNeil (Reference Materne, McNeil, Yadav, McNeil and Stevenson2007) established that DF and yield-related traits such as NP and number and weight of seeds are the most important characters in lentil since they limit production. In our work, 20% of F4 families were mainly selected by precocity and high NP per plant. The cutting values were broad so as to avoid reducing drastically the genetic variance. In F5 generation, more rigorous levels were imposed because genetic variability was higher, with more precocious and productive plants.
Currently, RILs selection in breeding programs is based on phenotypic means; however, they would be best selected according to their genetic or breeding values because quantitative traits are often influenced by environments and genotype–environment interactions. For these effects, ANOVA showed significant differences for all traits (Table 1). The differences between greenhouse and field temperatures could have influenced the behavior of RILs. The grain-filling period is critical for lentil yield, since it is the stage in which the final NS per surface unit is defined (Ruiz Corral et al., Reference Ruiz Corral, Medina, González, Flores, Ramírez, Ortiz, Byerly and Martínez2013). When temperatures exceed 28–30 °C the reproductive cycle is accelerated, leading to failure in fertilization, abortion of flowers, pods with formed and unfertilized grains, and lower NP per plant with fewer grains (Ruiz Corral et al., Reference Ruiz Corral, Medina, González, Flores, Ramírez, Ortiz, Byerly and Martínez2013). The high temperatures recorded during this growth period in the greenhouse (> 30 °C) could account for the lower NP and NS per plant compared with field-grown plants. Also, lower temperatures and high humidity during crop maturation reduce grain yield (Ruiz Corral et al., Reference Ruiz Corral, Medina, González, Flores, Ramírez, Ortiz, Byerly and Martínez2013) as it happened in the field, especially in 2016.
The use of greenhouses is important in lentil breeding because it allows screening RILs for heat tolerance, identifying and developing heat-tolerant genotypes, determining if the different RILs are adapted to this culture system for later use in nodulation studies, studying the effects of different light conditions at germination on the content of polyphenolics and antioxidant properties (Świeca et al., Reference Świeca, Gawlik-Dziki, Kowalczyk and Złotek2012), and conducting studies on selenium fertilization (Thavarajah et al., Reference Thavarajah, Thavarajah, Vial, Gebhardt, Lacher, Kumar and Combs2015), salinity (Ganjeali et al., Reference Ganjeali, Khormizi, Lahouti and Shafieian2015), and drought tolerance. The varieties selected in the present study for adaptation to both field and greenhouse climatic conditions could be used later for such studies.
The best genotypes were selected using BLUP. This method allows predicting a more accurate genotypic value, which is important for the selection of new cultivars, or even the genetic values (additive effects) for the selection of genitors (Piepho et al., Reference Piepho, Möhring, Melchinger and Büchse2008).
BLUP was used for predicting the genotypic values, and estimating genetic parameters and genetic correlations (Tables 3–5).
To select a better parent candidate and for further breeding, researchers could select on the basis of the average of rankings for the desired traits or probably construct a genetic worth linear function (Soh, Reference Soh1994). In our experiment, the same RILs were selected both when the average of rankings for all the traits were taken into account (Table 3) and when only the breeding values for yield and flowering days were considered (Figure 2).
Estimates of genetic parameters, such as heritability and genetic correlations, are essential in at least three applications: (1) knowledge of the genetic control of the traits aimed at designing efficient breeding strategies, (2) prediction of the genetic values of selection candidates, and (3) determination of sample size (e.g., number of replicates) and sampling form suitable for the accurate estimation of parameters and maximization of selective accuracy (Resende et al., Reference Resende, Ramalho, Nunes, da Silva, Carneiro, da Silva, Borém, Sediyama and Ludke2017).
Genetic variability is considered an essential prerequisite for a crop improvement program aimed at obtaining high-yielding progenies. An insight into the magnitude of variability present in a crop provides the basis for effective selection. A great extent of variability was observed in the NP and NS per plant of RILs (Table 3).
Traits comparison according to the extent of genetic variation could be better judged by estimating genotypic coefficient of variation (CVg). CVg estimates were highest for NS per plant, followed by WS and NP per plant indicating that the variations observed in these traits were mostly due to genetic factors. The higher CVg for these traits indicated that genotypes could be improved by further selection.
Heritability is the portion of phenotypic variation which is transmitted from parent to progeny. The higher the heritable variation, the greater will be the possibility of fixing the character by selection methods. The heritable variation with heritability (broad sense) estimates would provide reliable indication of expected improvement through selection. According to Resende (Reference Resende2002), heritability can be classified as low (h < 0.15), medium or moderate (0.15 < h < 0.50), and high (h > 0.50). Broad-sense heritability values were high for all traits studied, indicating few environmental influences. Heritability estimates provide information on the magnitude of the inheritance of quantitative traits, but provides no indication of the amount of genetic progress that would result from selecting the best individuals. High heritability combined with high genetic advance indicates the presence of additive heritability. Regarding the main traits (DF and yield), the genetic advance as percent of tester was 6.4 and 13.4%, respectively. Similar results were found by Paliya et al. (Reference Paliya, Saxena, Tikle, Singh and Tilwari2015), who reported the highest heritability estimate for DF (92.68%) and high heritability (73.75%) for seed yield and a genetic advance as percent mean of 80% for yield/plant and 12% for DF. Based on the high heritability values and high genetic advance shown by the different characters, especially NP, NV, and WS, it could be concluded that the genetic effects determining the phenotypic expression of these traits are mostly of the additive type and that selection may be effective to improve them.
Genetic correlations provide information on whether two heritable traits share genes or not, and the information about the magnitude and direction of genetic correlations (negative or positive) can assist in selection decisions. Genotypic correlations between yield-related traits were generally favorable and of high magnitude. For microsperma types, there was no correlation, but for macrosperma types, a high correlation was found between yield and precocity (Table 5). These results have also been reported for lentil by Avola et al. (Reference Avola, Riggi, Gresta, Sortino and Onofri2018). Therefore, since the main objective of genetic breeding is to obtain new lines with increased yield, and taking into account that it is a complex character governed by minor genes, the direct selection by this character would be difficult. Therefore, yield could be modified by modifying the variables significantly correlated with it. By focusing the selection on these variables, we could have an indirect yield response, since we would be modifying the physiological factors that influence it. As a result of such indirect selection process, plants with the highest height and NP and NS would have the highest yield potential.
The relationship between RILs using molecular markers was similar to that obtained using breeding values, probably because molecular markers and breeding values are free of environmental effects. The RILs that could not be discriminated with molecular markers had a common origin (L105 family) and were morphologically similar to each other.
One of the main problems for lentil production in Argentina is the narrow genetic base of cultivated varieties, which should be widened to support a more steady production by incorporating new superior varieties of both macrosperma and microsperma subspecies since the ethnic preferences influence the market and acceptance of new cultivars.
This work allowed us to identify a group of precocious genotypes with higher yields than the tester ‘Silvina’ (seven macrosperma and two microsperma genotypes) that could be used in future yield comparison trials in different regions or as parents in new breeding programs aimed at improving yield and yield-related components. In lentil breeding programs, a large number of crosses are made every year to isolate transgressive segregants RILs. Chahota et al. (Reference Chahota, Kishore, Dhiman, Sharma and Sharma2007) found that macrosperma × microsperma crosses displayed transgressive segregants of practical utility. Thus, identification and selection of both types of lentils is one of the key steps in lentil breeding programs.
From the point of view of economics, lentil is a profitable alternative. Production in Argentina is insufficient to meet domestic market demand, which must be supplemented by imports, so it would be advantageous to replace them by lentils produced in the country.
5. Conclusions
Screening among a larger set of candidate genotypes with two different methods (genotypic and molecular) resulted in the selection of the same nine best RILs (seven of the macrosperma type and two of the microsperma type).
The genetic value of the parents would be better ranked by their breeding values than by their phenotypic value; therefore, the selection efficiency would be enhanced and the genetic gain would be more predictable.
The selected genotypes could become potential commercial varieties or be used as parental lines in future hybridization programs.
Acknowledgements
This research was supported by Consejo Nacional de Investigaciones Científicas y Técnicas (CONICET, Argentina), Instituto de Investigaciones en Ciencias Agrarias de Rosario (IICAR-CONICET), and Fondo para la Investigación Científica y Tecnológica (FONCyT, Argentina).
Financial support
None.