


INTRODUCTION
The concept of the ecological niche is that real populations will persist in a set of conditions defined by a hyper-volume of environmental variable space, which can be projected into the geographic space and express a set of biotopes (i.e. localities with environmental characteristics suitable for species occurrence; Colwell et al. Reference Colwell, Rangel, Grinnell and Elton2009). Current understanding of the processes that determine observed species distributions (Soberón & Nakamura Reference Soberón and Nakamura2009) suggests that, at large scales, climate variables such as temperature and humidity can directly affect species ranges (Thomas Reference Thomas2010), and they have been extensively used as predictors of local suitability within an ecological niche modelling (ENM) framework (Soberón Reference Soberón2007). However, the recent and frequent use of ENM for conservation issues has been challenged by some important scale issues (Carvalho et al. Reference Carvalho, Brito, Pressey, Crespo and Possingham2010; Wiens et al. Reference Wiens, Ackerly, Allen, Buckley, Cornell, Damschen, Davies, Grytnes, Harrison, Hawkins, Holt, Mccain and Stephens2010). ENMs are usually developed at a regional scale, comprising large areas within a geographic distribution. However, threats to species persistence are mostly related to smaller-scale processes, such as land-use changes (Foley et al. Reference Foley, Defries, Asner, Barford, Bonan, Carpenter, Chapin, Coe, Daily, Gibbs, Helkowski, Holloway, Howard, Kucharik, Monfreda, Patz, Prentice, Ramankutty and Snyder2005; Haddad et al. Reference Haddad, Brudvig, Clobert, Davies, Gonzalez, Holt, Lovejoy, Sexton, Austin, Collins, Cook, Damschen, Ewers, Foster, Jenkins, King, Laurance, Levey, Margules, Melbourne, Nicholls, Orrock, Song and Townshend2015). Several species, including bats (Jones et al. Reference Jones, Jacobs, Kunz, Willig and Racey2009), are exposed to a range of human-induced environmental changes in terms of climate, land use, biological invasions, pollution and water contamination (Dirzo et al. Reference Dirzo, Young, Galetti, Ceballos, Isaac and Collen2014; Murphy & Romanuk Reference Murphy and Romanuk2014). Despite the recognized effects of climate variables on bat diversity (Estrada-Villegas et al. Reference Estrada-Villegas, McGill and Kalko2012; Stevens Reference Stevens2013), landscape variables may have an even stronger predictive power (Mehr et al. Reference Mehr, Brandl, Hothorn, Dziock, Förster and Müller2011; López-González et al. Reference López-González, Presley, Lozano, Stevens and Higgins2014), and so it is reasonable to consider changes at the landscape scale when exploring bat vulnerability.
Vulnerability is a term that denotes how threatened a species is in relation to both natural and anthropogenic environmental changes with regards to the exposure to those environmental changes, the intrinsic sensitivity of the species and the adaptability of the species to a new set of conditions (Dawson et al. Reference Dawson, Jackson, House, Prentice and Mace2011; Foden et al. Reference Foden, Butchart, Stuart, Vié, Akçakaya, Angulo, De Vantier, Gutsche, Turak, Cao, Donner, Katariya, Bernard, Holland, Hughes, O'Hanlon, Garnett, Şekercioǧlu and Mace2013). Habitat loss and fragmentation are among the most impacting environmental changes affecting biodiversity in the world (Haddad et al. Reference Haddad, Brudvig, Clobert, Davies, Gonzalez, Holt, Lovejoy, Sexton, Austin, Collins, Cook, Damschen, Ewers, Foster, Jenkins, King, Laurance, Levey, Margules, Melbourne, Nicholls, Orrock, Song and Townshend2015). This means that while an area may have suitable conditions for species persistence, such as conditions related to climate, it might not guarantee species survival due to exposure to land-use pressures in the area. Still, some species could be more affected by this exposure than others (Betts et al. Reference Betts, Fahrig, Hadley, Halstead, Bowman, Robinson, Wiens and Lindenmayer2014). Differences in sensitivity (i.e. the likelihood of a species being affected by exposure to stressor agents) are probably related to the particular ecological traits of each species, which may be difficult to predict (Henle et al. Reference Henle, Davies, Kleyer, Margules and Settele2004; Cardillo et al. Reference Cardillo, Mace, Gittleman and Purvis2006). Both the level of exposure and the degree of sensitivity of a particular species may determine what conservation actions are required to mitigate any current threats to survival.
The Cerrado biome, a Brazilian savanna, has been highly impacted by land-use changes; 50% of this biome has already been converted into pasturelands, urban areas or croplands (Klink & Machado Reference Klink and Machado2005; Sano et al. Reference Sano, Rosa, Brito and Ferreira2010). The bat fauna of Cerrado comprise more than 100 species, with a variety of food habits, such as frugivory, nectarivory, insectivory, carnivory and haematophagy. However, this biome is still relatively unknown when compared to other biomes in Brazil, with only 6% of the biome having been minimally surveyed until 2009 (Bernard et al. Reference Bernard, Aguiar and Machado2011). In Brazil, seven bat species are currently at risk of extinction, with five of them inhabiting this biome and two of them being endemic.
Relationships between population persistence and habitat loss are not commonly linear, instead following an abrupt change at some threshold of habitat loss at which population persistence approximates zero (Huggett Reference Huggett2005; Swift & Hannon Reference Swift and Hannon2010). This nonlinear relationship may have many causes, including landscape configuration effects under low habitat cover, Alee effects or time lag effects (Swift & Hannon Reference Swift and Hannon2010). The relationship between bat species richness and forest loss in the Cerrado has a critical threshold at approximately 50% (Muylaert et al. Reference Muylaert, Stevens and Ribeiro2016). Considering that some bat species are more sensitive to land-use conversion than others (Duchamp & Swihart Reference Duchamp and Swihart2008; García-Morales et al. Reference García-Morales, Badano and Moreno2013; Farneda et al. Reference Farneda, Rocha, Lopez-Baucells, Groenenbert, Silva, Palmeirim, Bobrowiec and Meyer2015), it is expected that habitat loss thresholds may be different among bat species.
We assess current vulnerability in human-dominated ecosystems by exploring how suitable climatic areas for eight bat species are under pressure due to land-use changes, creating scenarios in which species would be sensitive to different thresholds of habitat loss (Fig. 1). In this sense, we are combining regional and landscape scales to gain a more accurate perception of species exposure to environmental changes. We consider that accessing suitable climatic areas for bat species is a feasible way to predict where they can reach maximum abundance (Weber et al. Reference Weber, Stevens, Diniz-Filho and Grelle2016). We looked for landscapes with suitable climates for bat species where species are more or less vulnerable due to land-use changes according to different scenarios of sensitivity. We created scenarios in which eight bat species would disappear in a landscape when 70%, 50% or 30% was deforested. This theoretical threshold represents the value of habitat loss in which population survival probability turns negative (Fahrig Reference Fahrig2001; Rueda et al. Reference Rueda, Hawkins, Morales-Castilla, Vidanes, Ferrero and Rodríguez2013). We also obtained empirically derived critical thresholds. The main aim of this study is to use the best information available about species-specific critical thresholds of habitat area to find regions with high climate suitability, but impoverished landscape structure conditions for a species. Overall, the objectives were to: (1) determine where suitable climatic areas are subject to natural vegetation loss and fragmentation; (2) determine where species would disappear first if they were sensitive to a particular threshold of habitat loss; and (3) propose the use of empirical thresholds of habitat loss in the evaluation of species’ vulnerabilities.
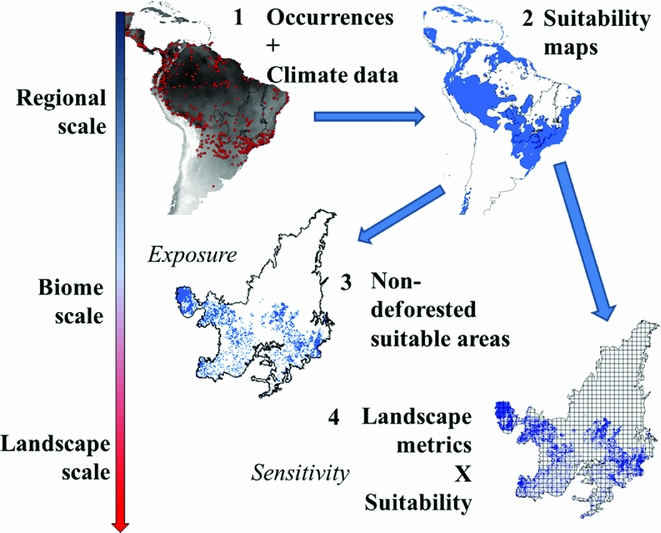
Figure 1 A conceptual model for relating species vulnerability to land-use changes using ecological niche modelling. Changes in scale are represented by an arrow on the left-hand side. At the continental scale, (1) species occurrence data and bioclimatic data were used to build ecological niche models (2) representing the suitable areas for that species. At the regional scale, (3) these suitable areas can be overlapped with deforested areas to evaluate species exposure to deforestation. At the landscape scale, (4) the biome was subdivided into landscapes and landscape metrics were calculated for each grid cell.
METHODS
Step 1: ENM
Previous studies have shown that climate variables may affect bat distribution, abundance and species richness (Estrada-Villegas et al. Reference Estrada-Villegas, McGill and Kalko2012; Stevens Reference Stevens2013), suggesting that the use of climate variables as predictors of suitable sites for bats is coherent. We selected eight bat species occurring on the Cerrado biome: Artibeus cinereus, Artibeus lituratus, Desmodus rotundus, Glossophaga soricina, Myotis nigricans, Platyrrhinus incarum, Platyrrhinus lineatus and Sturnira lilium (Table S1) (available online). We obtained geographic coordinates from occurrence data from a diversity of sources (Appendix S1). Whenever no geographical coordinates were obtained, we looked for an identifiable landmark related to that occurrence, such as the name of a conservation unit. Then, we looked for the coordinates of that landmark.
We developed ecological niche models using data from climate variables provided by WorldClim (available at http://www.worldclim.org/) at a resolution of 9.24 × 9.24 km grid cells for the entire Neotropical region (Fig. S1). We opted to use the Neotropical region because bat species have large geographic ranges there (Barve et al. Reference Barve, Barve, Jiménez-Valverde, Lira-Noriega, Maher, Peterson, Soberón and Villalobos2011). A total of 19 bioclimatic variables were used, derived from monthly temperature and rainfall data. The strong collinearity among variables may have been a problem in modelling procedures (Jiménez-Valverde et al. Reference Jiménez-Valverde, Peterson, Soberón, Overton, Aragón and Lobo2011); therefore, we ran a principal component analysis and used the principal component axis explaining 95% of the variability in order to perform species distribution modelling (Table S2). Only one occurrence per cell (9.24 × 9.24 km) was considered for species distribution modelling in order to prevent the results being affected by sampling bias. We built ecological niche models using four algorithms: maximum entropy (MaxEnt), support vector machine (SVM), random forest (RF) and generalized linear model (GLM). All methods use presence background data, and 10,000 random background units were considered in the model in order to improve suitability estimation. Suitability varies from zero to one, and we converted suitability maps into binary maps using the maximum sensitivity and specificity (Pearce & Ferrier Reference Pearce and Ferrier2000). We chose the best model by comparing the true skill statistics, using a random division in training and test samples (70% and 30%) (Allouche et al. Reference Allouche, Tsoar and Kadmon2006; Liu et al. Reference Liu, White and Newell2011). Only the best corresponding model was carried forward in the following steps.
Step 2: landscape structure
We used two sources of land cover data: one from the year 2010 from the Brazilian Institute of Environment and Renewable Natural Resources (IBAMA) (http://siscom.ibama.gov.br/monitorabiomas/cerrado/index.htm) and another from 2011–2014 from the Image Processing and Geoprocessing Laboratory (LAPIG) (http://siscom.ibama.gov.br/). IBAMA used a previous land-use dataset from the Projeto de Conservação e Utilização Sustentável da Diversidade Biológica Brasileira (PROBIO) project, dated 2002, and added deforestation data collected using the Land Remote Sensing Satellite (LANDSAT) from 2002 until 2010. LAPIG used data from the Moderate Resolution Imaging Spectroradiometer (MODIS) satellite (MOD13Q1), and validated these data by using data from the LANDSAT and China–Brazil Earth Resources Satellite (CBERS) satellites to monitor deforestation yearly. We transformed deforestation data into a grid 100-times smaller than the suitability data (0.0925 × 0.0925 km grid cells).
We calculated natural vegetation loss and the landscape shape index (LSI) for each of the 9.24 × 9.24 km cells defined in the modelling procedures (Table S3). This cell size is compatible with maximum daily movements for bats in the Neotropical region (Trevelin et al. Reference Trevelin, Silveira, Port-Carvalho, Homem and Cruz-Neto2013; Aguiar et al. Reference Aguiar, Bernard and Machado2014), so we believe that it is also a good landscape size for predicting bat responses to changes in landscape structure. Natural vegetation loss was the sum of non-forested pixels. LSI was calculated as the total edge perimeter divided by the edge perimeter if all natural vegetation in a landscape was within a single circle. Total edge was calculated as the sum of the sizes of pixel edges adjacent to a non-forested pixel or a border of the landscape.
Step 3: critical thresholds
We are aware that thresholds of habitat loss may be species specific (Rueda et al. Reference Rueda, Hawkins, Morales-Castilla, Vidanes, Ferrero and Rodríguez2013). They can also result from a number of processes, such as time lag in species responses or relationships between landscape configurations and compositions (Swift & Hannon Reference Swift and Hannon2010). Differences in reproductive rates and dispersal capacities are related to those thresholds, which can vary from 1% to 99% of habitat amount in a landscape (Fahrig Reference Fahrig2001). In the south of the Brazilian Cerrado, for example, a critical threshold of 50% of forest loss has been estimated for bat species richness (Muylaert et al. Reference Muylaert, Stevens and Ribeiro2016). We used theoretical scenarios of 30%, 50% or 70% of natural vegetation loss, above which species would disappear in a landscape.
We also tested the existence of empirically derived thresholds. We used data from standardized field sampling in the Cerrado of Brazil (Appendix S1; Mendes et al. Reference Mendes, With, Signorelli and De Marco2017). To obtain empirical thresholds, we looked for a sharp threshold using a piecewise regression between habitat loss and abundance. Piecewise regressions search for a sharp change in slope in certain breakpoints that can be found via the least squares estimations (Toms & Villard Reference Toms and Villard2015). We performed a linear regression of abundance on natural vegetation loss and then tested the significance of the insertion of a breakpoint in that relationship using the Davies’ test, which shows whether there is a change in the slope of a relationship after a breakpoint (Muggeo Reference Muggeo2016). Piecewise regressions were performed using a segmented package in R (Muggeo Reference Muggeo2016). Each night was considered as one sampling unit. In accordance with the theoretical expectations (Swift & Hannon Reference Swift and Hannon2010), after a certain breakpoint in habitat loss, the slope of the relationship with biodiversity will decrease towards a negative relationship. We checked whether the slopes of the piecewise regression were compatible with this prediction.
RESULTS
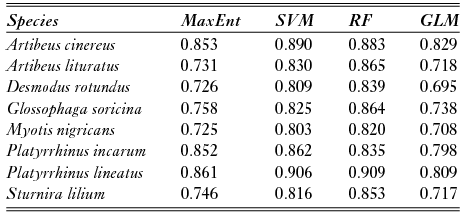
The algorithm with the best performance in modelling the climate niche of A. cinereus, P. incarum and P. lineatus was the SVM, while for A. lituratus, D. rotundus, G. soricina, M. nigricans and S. lilium, it was the RF model, although for some species both algorithms resulted in similar performance (Table 1). The first axis from the principal components analysis of suitability maps explained between 75% (for P. lineatus) and 84% (for A. cinereus) of the variation in environmental suitability, meaning that the algorithms had high congruence among them. Total suitable area (i.e. cells with suitability above the balanced threshold) ranged from 5,700,000 km2 for P. incarum to 2,800,000 km2 for D. rotundus (Fig. S2). Within the Cerrado, A. lituratus had the largest area with high suitability (1,600,000 km2). For almost all of the species, high-suitability areas were located in the southern Cerrado (Fig. S2).
Table 1 Environmental niche modelling performance compared among four algorithms: maximum entropy (MaxEnt), support vector machine (SVM), random forest (RF) and generalized linear model (GLM). Area under curve values are shown for each species and algorithm. In order to test these statistics, data were separated by train (70% of data) and test (30%).
Natural vegetation loss in Cerrado landscapes ranged from 0% to 100%, while the LSI varied from 1 to 7; higher values were obtained in more fragmented landscapes (Fig. 2). Three scenarios of critical thresholds of habitat loss were tested (Fig. S3), and M. nigricans, A. cinereus and P. lineatus were expected to lose a larger percentage of suitable areas if they responded to natural vegetation loss in any of the three scenarios (critical thresholds of 30%, 50% or 70%; Table 2). D. rotundus and A. lituratus, in turn, were predicted to be less affected. Even considering the less conservative critical threshold, in which 70% of a landscape had to be deforested for a reduction in population persistence, up to 68% of the highly suitable landscapes were above this threshold (Table 2). Species with suitable areas in the southern Cerrado were even more affected by landscape changes than species with suitable areas in the northern Cerrado (Figs 3 and S4).
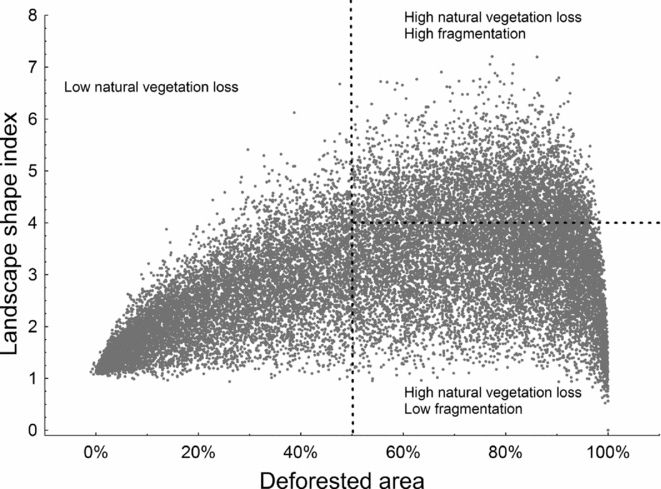
Figure 2 Distribution of natural vegetation loss and fragmentation in the Cerrado biome. The vertical line represents one possible scenario for a critical threshold of habitat loss (50% of loss). Landscapes with high natural vegetation loss could be found with high or low fragmentation, measured with the landscape shape index. The median of the variation in landscape shape index (horizontal line) was used to categorize landscapes into highly or lowly fragmented. Each unit is a landscape measuring 9.24 × 9.24 km.
Table 2 Scenarios of possible population loss thresholds of 70%, 50% and 30% in landscapes with high climatic suitability. The threshold is the percentage of habitat loss below which populations will no longer persist in that landscape. Shown values are the climatic suitable areas where species would not persist according to that scenario. Landscapes were divided into high or low fragmentation based on the landscape shape index (see ‘Methods’ section). The mean of the landscape shape index over all landscapes was used as a threshold for this subdivision. Percentages in the parentheses represent the amounts climatically suitable areas in the Cerrado that would be lost if species were sensitive to 70%, 50% or 30% habitat deforestation in a landscape.
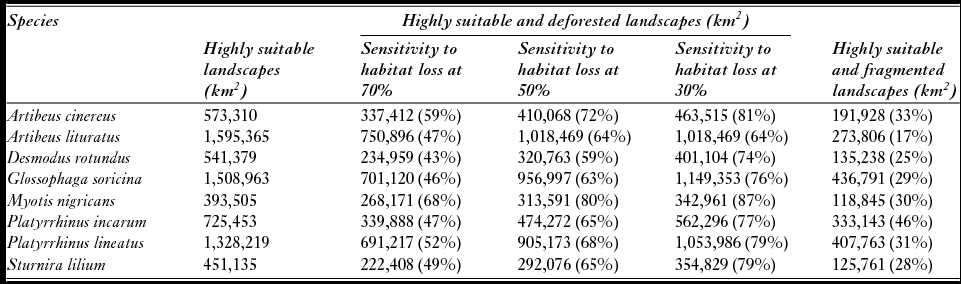
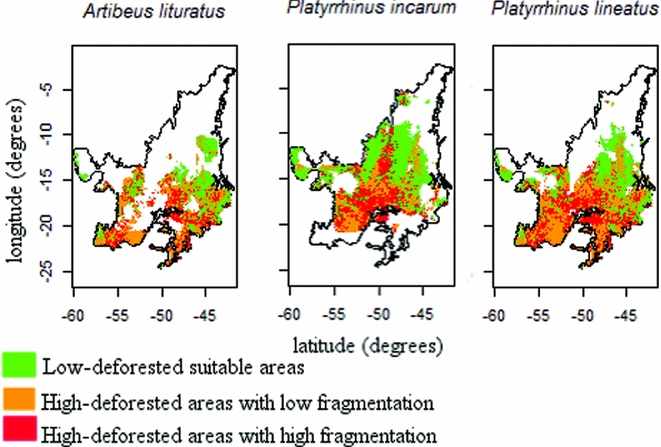
Figure 3 Spatial distribution of suitable cells and effects of land-use changes on three bat species in the Cerrado that showed empirical relationships with natural vegetation loss, considering the most realistic scenario of critical thresholds.
Empirical thresholds in the relationships between abundance and natural vegetation loss were found for A. lituratus and P. lineatus, both at 50% of natural vegetation loss (Table 3). P. incarum abundance showed a negative linear relationship with natural vegetation loss; however, no critical threshold was encountered. A. lituratus abundance was negatively related to natural vegetation loss until a breakpoint of 50%, and then the predicted abundance remained constant (Fig. 4). P. lineatus abundance, on the other hand, was negatively related to natural vegetation loss until a breakpoint of 50%, and it was positively related to natural vegetation loss after this breakpoint.
Table 3 Results of Davies’ tests showing whether there is a difference in slope in piecewise regression; the test is significant if there is a breakpoint. Regression coefficients from linear models and p-values are also shown for comparison. Bold values represent significant breakpoints and p-values (p ≤ 0.05).
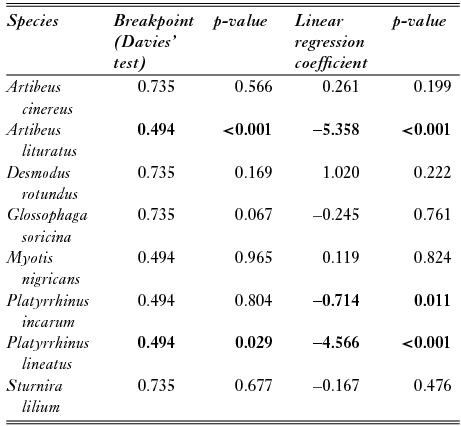
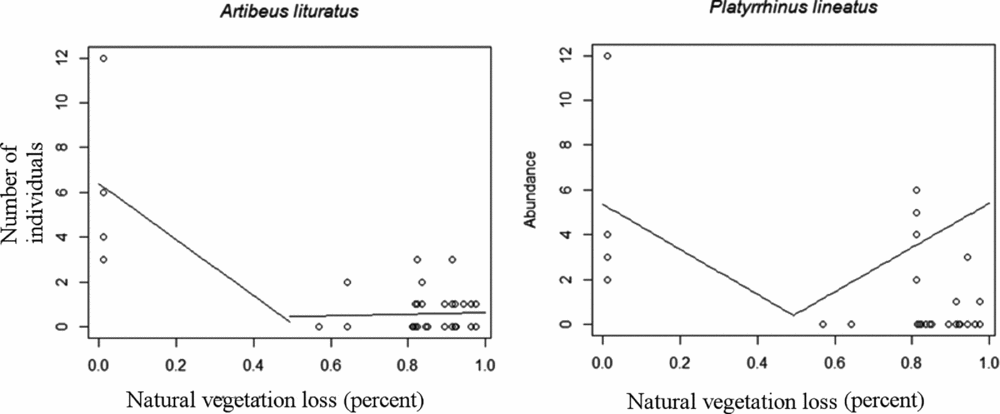
Figure 4 Predicted values from piecewise regressions with significant breakpoints calculated using the Davies’ test.
DISCUSSION
Exposure of climatically suitable areas to natural vegetation loss
Among the analysed species, M. nigricans, A. cinereus and P. lineatus were the most exposed to deforestation in suitable areas of the Cerrado. Such results may not seem to be relevant, since such species are widely distributed across a range of vegetation types (Zortéa & Alho Reference Zortéa and Alho2008; Oprea et al. Reference Oprea, Mendes, Vieira and Ditchfield2009; Talamoni et al. Reference Talamoni, Coelho, Dias-Silva and Amaral2013). However, we noted that the Cerrado biome is close to marginal areas for the distributions of P. lineatus and A. cinereus (Gardner Reference Gardner2007). While the northwest Cerrado is marginal to the distribution of P. lineatus, A. cinereus does not occur in the west of the Cerrado, except for a few occurrences in Bolivia (Gardner Reference Gardner2007). Habitat in marginal areas of a species distribution is usually less suitable, with smaller and more fluctuating populations (Brown Reference Brown1984; Cuervo & Møller Reference Cuervo and Møller2013). Additionally, for A. cinereus, M. nigricans and P. lineatus, highly suitable areas were located in the southern Cerrado, which were most affected by deforestation in this biome (Klink & Machado Reference Klink and Machado2005; Sano et al. Reference Sano, Rosa, Brito and Ferreira2010). Patterns of exposure to land-use changes among those species may be explained by the marginality of the Cerrado in terms of species distribution and the greater suitability of areas that are under human pressure.
Southern areas of the Cerrado are the most impacted by pastures and croplands due to the occupation history of this biome that began in the south, closer to major urban areas (Klink & Machado Reference Klink and Machado2005; Sano et al. Reference Sano, Rosa, Brito and Ferreira2010). Croplands, the major driver of fragmentation, are more concentrated in southern areas of the Cerrado, whereas pasturelands are distributed throughout the biome (Carvalho et al. Reference Carvalho, De Marco and Ferreira2009). Southern Cerrado areas also have greater species richness (Blamires et al. Reference Blamires, Oliveira, Barreto and Diniz-Filho2008; Diniz-Filho et al. Reference Diniz-Filho, Bini, Vieira, Blamires, Terribile, Bastos, Oliveira and Souza2008), although, for bats, the lower species richness of northern areas may also be related to disproportionately fewer bat surveys having been performed (Bernard et al. Reference Bernard, Aguiar and Machado2011). In situations in which a species has a large suitable area, exposure to impacts in one part of its geographic range would buffer the effects of that impact (Dawson et al. Reference Dawson, Jackson, House, Prentice and Mace2011). Therefore, species that are climatically likely to occur throughout the Cerrado, such as D. rotundus and G. soricina, would be less affected by an impact that varies with latitude.
Scenarios of critical thresholds to land-use changes
Simulation of different critical thresholds of natural vegetation loss is one possible approach for integrating climate suitability at a regional scale to species responses at the landscape scale. We considered those theoretical thresholds as an equivalent to a certain value of natural vegetation loss in which the persistence probability of a population would be negative, although we were not attributing a cause to the existence of this threshold (see Swift & Hannon Reference Swift and Hannon2010), such as the effect of fragmentation in landscapes with high habitat loss (Andrén Reference Andrén1994). One caveat in these scenarios is the lack of specific thresholds for different foraging guilds or according to species’ body attributes. Habitat loss thresholds for population persistence are, in general, species specific (Rueda et al. Reference Rueda, Hawkins, Morales-Castilla, Vidanes, Ferrero and Rodríguez2013), and vary with a number of parameters, such as matrix quality (Fahrig Reference Fahrig2001).
Some empirical species-specific thresholds are available for some taxonomic groups, such as birds (e.g. Rueda et al. Reference Rueda, Hawkins, Morales-Castilla, Vidanes, Ferrero and Rodríguez2013). Most such thresholds occur when at least 50% of the habitat remains in the landscape, despite varying from 1% to 99% of the remaining habitat (Swift & Hannon Reference Swift and Hannon2010). Such results have reinforced the idea that critical thresholds of habitat loss are taxon specific (Swift & Hannon Reference Swift and Hannon2010); therefore, generalizing is difficult. Scenarios are useful tools for assessing biological patterns or processes whenever realistic datasets are not available (Peterson et al. Reference Peterson, Cumming and Carpenter2003), but their interpretation requires caution, since they may well depart from reality. Regarding the scenarios created above, some species may not be sensitive to land-use changes because they are resilient to these changes, being able to find resources such as food and to roost in highly modified landscapes (García-Morales et al. Reference García-Morales, Badano and Moreno2013). Bat species are also sensitive to other environmental factors not explored here, such as pesticide use, climate change, wind turbines or lighting (Jones et al. Reference Jones, Jacobs, Kunz, Willig and Racey2009). The most realistic approach to assessing species sensitivity to land-use changes is relating species persistence, incidence or abundance to those changes, thereby making it possible to find a land-use threshold for this relationship.
Empirically derived sensitivity
Piecewise regression is a common and well-stablished method in empirical evaluations of sharp habitat loss critical thresholds (e.g. Rompré et al. Reference Rompré, Robinson, Desrochers and Angehr2009; Toms & Villard Reference Toms and Villard2015; Muylaert et al. Reference Muylaert, Stevens and Ribeiro2016). Categorical thresholds can be tested using regression trees and smooth thresholds can be tested using non-linear relationships (Huggett Reference Huggett2005; Swift & Hannon Reference Swift and Hannon2010). Any of these methods could be adequate in the proposed approach for predicting which climatically suitable landscape populations are more vulnerable to land-use changes. We opted for the most commonly used method.
Relationships between bat abundance and vegetation cover are highly variable among species. S. lilium abundance has been identified as being positively related to forest cover and negatively related to edge density, M. nigricans is fragmentation sensitive and A. lituratus is positively related to edge density (Gorresen et al. Reference Gorresen, Willig and Strauss2005; Klingbeil & Willig Reference Klingbeil and Willig2010; Avila-Cabadilla et al. Reference Avila-Cabadilla, Sanchez-Azofeifa, Stoner, Alvarez-Añorve, Quesada and Portillo-Quintero2012). We found evidence of empirical thresholds for two of the eight analysed species: A. lituratus and P. lineatus. Empirical thresholds were similar to the 50% theoretical scenario and congruent with the empirical threshold found for bat species richness in the same biome (Muylaert et al. Reference Muylaert, Stevens and Ribeiro2016). However, absence of a critical threshold does not mean that a species is not sensitive to natural vegetation loss. A linear relationship with natural vegetation cover, for example, indicates that a species is sensitive to those changes, but no critical threshold could be found, such as for P. incarum. Those specific cases would benefit from a gradient approach, in which a continuum of vulnerability might be explored further.
CONCLUSION
Comparing scenarios with empirical data is useful whenever it is possible. Our empirically derived sensitivities were compatible with scenarios; however, just two species showed a critical threshold in the empirical test. Even with those differences, we argue that scenarios of sensitivity may be useful for predicting impacts on potentially sensitive species whenever empirical data are unavailable. Our scenarios were precautionary since they assumed that all species could be potentially sensitive. Impacts on species at the landscape scale might integrate with those at a regional scale; an example of this approach would be using fragmentation and climate change data (Kerr et al. Reference Kerr, Kharouba and Currie2007; Faleiro et al. Reference Faleiro, Machado and Loyola2013; Haddad et al. Reference Haddad, Brudvig, Clobert, Davies, Gonzalez, Holt, Lovejoy, Sexton, Austin, Collins, Cook, Damschen, Ewers, Foster, Jenkins, King, Laurance, Levey, Margules, Melbourne, Nicholls, Orrock, Song and Townshend2015). We have taken a small step in this direction; our findings improve understanding of how suitable climatic areas are likely to be affected by landscape changes in the Cerrado. Overall, our results showed that small, suitable areas in the Cerrado were determinants for predicting species vulnerability to land-use changes. Therefore, a threatened species in the Cerrado is not necessarily also threatened in other biomes. While a wider approach considering the landscape of the entire country or the continent would provide a more complete picture of bat species vulnerability, we believe that regional approaches are also important for improving understanding of vulnerability (Ferrier Reference Ferrier2002) on a more feasible scale for conservation management.
ACKNOWLEDGEMENTS
We are grateful to M. Oprea and T.B. Vieira for providing occurrence data. P. Mendes received a CNPq scholarship. P. De Marco Jr was funded by a continuous productivity CNPq grant. The work was funded by International Foundation for Science (D/5288-1) and CNPq (486057/2012-7). Empirical data were obtained with partial financial help from Anglo American Brasil, CAPES and the PELD-UFG project. We thank P.H. Coelho Ramos for providing occurrence data of bat species, A. Andrade for helping with the evaluation of ecological niche modelling and developing a script for running environmental niche models, S. Villen for commenting on our analysis and figures, C.H.G. Cezare for helping with land-use data and L.M.O. Laureto, P.H.P. Braga and C.E.A. Soares for helpful comments on the text. We also thank A.P. Paglia, D.C.S. Brito, M.C. Ribeiro and R.D. Loyola for review and helpful comments, and B.J.C. Unwin for reviewing the English syntax. We thank S. de Jesus, P.V.S. Bernardo, L.M. Camargos, P.H.P. Braga, B.C. Gomes, C. Sobral, P. Coelho and A. Bispo for help with the sampling design and fieldwork; landowners, National Forest of Silvânia and Emas National Park for site access; and ICMBio for providing the necessary permits to sample the bats.
Supplementary material
To view supplementary material for this article, please visit http://doi.org/10.1017/S0376892917000194


