


Shih’s commitment to push his company to add value through the ‘smiling curve’ saved Acer from the fate of dozens of other Taiwanese electronics suppliers that became captive suppliers of OEM goods to major computer companies (Bartlett & Ghoshal, Reference Bartlett and Ghoshal2000: 136).
The smiling curve, shown in Figure 1, was coined by Stan Shih, co-founder of Acer. It highlights ‘the declining importance of assembly and the increasing importance of technology and marketing’ in Taiwan’s personal computer (PC) industry from the late 1990s (Hung & Whittington, Reference Hung and Whittington2011: 534), that is, in the PC industry, the margins at both ends of the value chain are higher than the margin in the middle of the chain. Therefore, to improve performance, firms in the PC industry should follow the smiling curve and migrate from segments in the middle of the chain that add less value (i.e., assembly) to the ends of the curve, which add more value (i.e., brand and technology) (Hon, Tarng, & Chu, Reference Hon, Tarng and Chu2000). Acer has become one of the top PC brand names primarily because it follows the smiling curve (Lundquist, Reference Lundquist2007). The smiling curve reflects the evolution and competition of the PC industry (Hon, Tarng, & Chu, Reference Hon, Tarng and Chu2000). This further suggests that ‘in many industries profitability at various stages of value chain has come to follow a U-shaped curve high at the upstream and downstream processes and low at the midstream processes’ (Chen, Reference Chen2004: 346), as shown in Figure 2. In other words, as both Figures 1 and 2 show, the smiling curve represents ‘the pattern of value added along the value chain’ and predicts the ‘firms most likely to profit in global value chains’ (Shin, Kraemer, & Dedrick, Reference Shin, Kraemer and Dedrick2012: 90). Thus, it is important to navigate the value curve and find a more profitable point in the supply chain (Bartlett & Ghoshal, Reference Bartlett and Ghoshal2000).
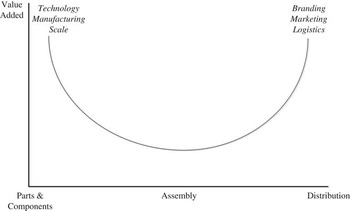
Figure 1 Smiling curve – the value-added curve for the personal computer industry. Based on Stan Shih’s ‘reengineering acer’ (Reference Shih1996, Reference Shih2004b) (Chinese version)
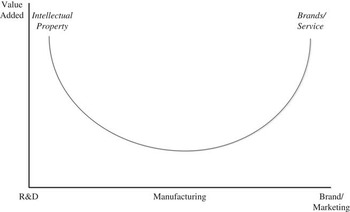
Figure 2 Smiling curve – the value-added curve. Based on Stan Shih’s ‘millennium transformation: change management for new acer’ (Reference Shih2004a) (Chinese version), and ‘smile and beat your own path’ (Reference Shih2012) (Chinese version)
Contractual arrangements such as original equipment manufacturing (OEM) link enterprises in emerging countries to firms in developed countries that own brands and technology (Luo & Tung, Reference Luo and Tung2007). Taiwan-based Acer serves as an example of an emerging market enterprise’s efforts to shift away from its less profitable OEM business in order to improve performance (Chen, Reference Chen2005). Acer’s strategy of following the smiling curve in the PC industry has moved the firm from the low-end point of contractual assembly to the high-end points of brand and technology. Similar trends can be seen in firms in other industries, such as China’s television industry (Xie & Wu, Reference Xie and Wu2003), mobile phone industry (Sun, Chen, & Pleggenkuhle-Miles, Reference Sun, Chen and Pleggenkuhle-Miles2010), and textile industry (Yang, He, & Zhang, Reference Yang, He and Zhang2010). Thus, the smiling curve can be applied to explain the evolution of enterprises in emerging economies and to illustrate how firms can improve performance by embracing profitable segments in the value chain without relying solely on contractual arrangements, that is, investing in owning brands or building technological capabilities is important for bettering the performance of emerging countries’ enterprises. Thus, following a smiling curve should contribute to the success of emerging countries’ enterprises, and downsizing on such efforts could negatively affect their performance.
In recent decades, the macroeconomic environment has been uncertain, and significant events (e.g., the 1997 Asian financial crisis, the 2007 financial tsunami) have made firms aware of excessive investments and given them a tendency to be risk averse. In the face of an economic downturn, a firm may opt for organizational downsizing to keep costs down. Firms have widely used this downsizing strategy in practice and regard it as a useful tool to survive difficult times (Muñoz-Bullón & Sánchez-Bueno, Reference Muñoz-Bullón and Sánchez-Bueno2011), and downsizing is believed to improve firm performance (Leung & Chang, Reference Leung and Chang2002), that is, firms should downsize their operations and investments to reduce costs to make it through an economic downturn. However, a downsizing strategy may actually decrease a firm’s competitiveness by reducing its resources, which can result in inflexibility and an inability to expand through mergers and acquisitions during a recession when firms are often undervalued in general. Furthermore, evidence shows that repeated layoffs tend to negatively affect firm profitability, casting doubt on the efficacy of downsizing strategies (Andrews, Reference Andrews2001).
Therefore, downsizing strategies can be a double-edged sword. During an economic downturn, managers can implement a variety of strategies to secure and sustain growth, and organizational downsizing is one of the most important strategies for managers to adopt among these various strategies (Fisher & White, Reference Fisher and White2000; Cascio, Reference Cascio2002). However, a firm’s efforts to lower costs through reducing its resources or investments may cause it to miss opportunities to merge with or acquire undervalued firms or assets (i.e., brands or technologies) or may lead to failure to regain momentum when the economy recovers. Thus, a firm that adopts downsizing strategies may actually harm its future development.
Take for example management practices implemented in response to the 2007 financial crisis. Certain Taiwanese companies proactively undertook mergers and acquisitions and increased open-source capital expenditures to take advantage of the opportunities offered by the economic downturn. During such a period, the market value of many companies is undervalued, enabling firms to purchase others at far lower prices than normal. For example, Taiwanese notebook manufacturer Compal increased its investment in a spare parts factory and acquired several excellent small companies, internalizing and strengthening its value chain. While some firms saw growth opportunities, other firms adopted a passive approach during the 2007 financial crisis, applying downsizing strategies to be cost-effective. These firms chose to reduce unnecessary investments through various activities (including layoffs, pay reductions, and lower capital expenditures) to remain competitive or simply survive the economic downturn. For example, United Microelectronics Corporation, a global Top 5 semiconductor foundry based in Taiwan, announced a capital reduction, encouraging a rise in its stock price and increasing the owners’ equity.
The aforementioned practices represent the opposite ends of the spectrum and serve as a basis for investigating the relationship between downsizing and firm performance to maintain corporate profits (Tsai & Shih, Reference Tsai and Shih2007). Facing an economic downturn, certain companies in Taiwan’s electronics industry opted for open resources (continuous investment), while others did not. When the macro environment is full of uncertainties, how firms respond to environmental uncertainties raises the question of the puzzles and paradoxes of investments or divestments on firm performance. Therefore, this article attempts to answer the following two main questions: (1) does a firm following the smiling curve perform better? and (2) should the smiling curve frown to enhance firm performance during an economic downturn? That is, this study will further examine whether downsizing is an appropriate strategy to improve firm performance and how downsizing can affect firm performance differently during an economic downturn.
This study makes four contributions. First, it provides evidence as to whether the concept of the smiling curve can be realized in reality. Second, it assists firms in assessing whether downsizing is an effective strategy to improve their performance and whether it can lead to rightsizing. Third, this study provides firms with evidence about whether they can increase their core competence by investing in assets for future development amid a relatively unstable market environment. Fourth, this study examines how evidence-based findings support or challenge the conventional wisdom on the merits of investments and divestments. It also provides academics, businesses, and the government with a new research avenue for how firms should strategize the smiling curve or downsize in order to avoid wrong-sizing for better performance.
Literature and Hypotheses
The smiling curve encourages firms to improve their performance by constantly finding more profitable segments in the value chain. Especially for firms in emerging countries, these firms should seek more profits by internalizing their marketing efforts or by enhancing their research and development (R&D) efforts than by OEM arrangements in the global value chain to strengthen their competitiveness (Sun, Chen, & Pleggenkuhle-Miles, Reference Sun, Chen and Pleggenkuhle-Miles2010). Therefore, following the smiling curve should benefit firms in emerging markets through improved profitability, and downsizing on these efforts should negatively affect firm performance. However, during an economic downturn, firms generally use downsizing strategies to survive and appease stakeholders. Thus, it is imperative to determine whether firms should follow the smiling curve by internalizing and enhancing brand and technological developments to improve firm performance. It is also important to analyze whether the smiling curve should frown through downsizing activities for better performance, as well as whether downsizing activities have different effects on firm performance during an economic downturn.
Smiling curve and firm performance
The smiling curve, based on the practical concept and practices in the PC industry, was introduced in the 1990s by Stan Shih, who used this concept to motivate his team to move toward segments with more added value in the global value chain (Chen, Reference Chen2008). Specifically, the smiling curve emerges from an X-axis that represents the three segments of the value chain structure – components, assembly, and distribution – and a Y-axis that displays the profit margins of business activities (Hon, Tarng, & Chu, Reference Hon, Tarng and Chu2000). The top-left curve represents segments such as technology, and the top-right curve represents segments such as brand operation (Zhang, Reference Zhang2010). The added value at the two ends of the curve is noticeably higher than the added value in the middle of the curve, which represents segments that characterize the OEM operations commonly adopted by enterprises in emerging economies, such as assembly (Zhang, Reference Zhang2010; OECD, 2014). The shape of this curve looks like a smiling face, and therefore it is named the smiling curve. Firms should carefully navigate the curve and move toward the points at both ends of the value chain with higher profit margins. That is, firms that expand to the top-right and top-left ends of the smiling curve should perform better. Thus, in emerging countries, firms that follow the smiling curve should internalize their advertising, marketing, and R&D efforts and move from contractual agreements to brand and technology development in order to improve performance and enhance capabilities. Therefore, firms should benefit from following the smiling curve, and in emerging economies, firms should aim to develop brands and technological capabilities in segments that have more added value than the OEM segments.
‘Brands have long been an essential component of the for-profit, marketing discipline, driven primarily by a need to create and maintain a point of difference in an increasingly competitive environment’ (Hankinson, Reference Hankinson2001: 231). According to the American Marketing Association, a brand can be defined as a ‘name, term, design, symbol, or any other feature that identifies one seller’s good or service as distinct from those of other sellers’ (AMA, 2013a: 1). Owing to globalization, a global brand embodies ‘special credibility, value, power, and enhanced preference’ (Hsieh, Reference Hsieh2004: 28) through customers’ global recognition. Since a brand is formed through consumers’ recognition and awareness, advertising and marketing efforts play important roles in the establishment of a successful brand and should have positive impacts on firm performance. According to the smiling curve, firms should benefit more from owned brands than OEM businesses.
From a theoretical perspective, Coase argued that ‘there were transaction costs in effecting exchanges through the market, and that the firm would emerge if the costs of organizing these exchanges within a firm were lower’ (as cited in Buckley & Strange, Reference Buckley and Strange2011: 461). That is, economizing transaction cost involves efficiency and is central to the study of the boundary of the firm, which determines what activities are performed within or outside the firm (Williamson, Reference Williamson1981). Extended from these arguments on transaction costs, internalization theory further deliberates on the benefits, relative to costs, of coordinating economic activities externally via the market or internally within the firm (Buckley & Strange, Reference Buckley and Strange2011). While internalization theory may lack dynamism to deliberate on firm growth (Buckley & Casson, Reference Buckley and Casson1991; Cantwell, Reference Cantwell2000; Buckley & Strange, Reference Buckley and Strange2011), the resource-based view perspective stresses firm-specific resources and capabilities as sources of advantage for firm growth (Barney & Hesterly, Reference Barney and Hesterly2010; Buckley & Strange, Reference Buckley and Strange2011). That is, based on resource-based view, a firm can be regarded as ‘a collection of productive resources’ (Penrose, Reference Penrose1959: 24), and these resources are ‘drivers of firm heterogeneity’ (Kor & Mahoney, Reference Kor and Mahoney2000: 114), whereas firm growth can be attributed to dynamic management and resources. Hence, resources, which are valuable, rare, and costly to imitate and can be exploited by organizations, can help sustain a competitive advantage (Barney & Hesterly, Reference Barney and Hesterly2010). Evolved from resource-based view, the dynamic capability perspective furthermore emphasizes discussions over how a firm’s resources can be created and refreshed in changing environments for sustained competitive advantage (Ambrosini & Bowman, Reference Ambrosini and Bowman2009; Ambrosini, Bowman, & Collier, Reference Ambrosini, Bowman and Collier2009). Thus, based on the aforementioned theoretical perspectives, internalizing brand developments through advertising and marketing efforts can help a firm such as a contract manufacturer not only to reduce transaction cost but also to gain resources for superior performance and sustained competitive advantage.
In particular, advertising plays a central role in the development of a brand image (Meenaghan, Reference Meenaghan1995) and the increase of a product’s perceived trustworthiness (Li & Miniard, Reference Li and Miniard2006). The American Marketing Association defines advertising as the ‘placement of announcements and persuasive messages in time or space purchased in any of the mass media by business firms, non-profit organizations, government agencies, and individuals who seek to inform and/or persuade members of a particular target market or audience about their products, services, organizations, or ideas’ (AMA, 2013b: 1). Empirical evidence also shows that consumers can be affected by different advertising strategies (Cui, Liu, Yang, & Wang, Reference Cui, Liu, Yang and Wang2013). Hence, we argue that advertising is important for the success of a brand because it affects consumers’ perceptions and attitudes. Based on the smiling curve, firms with brands in emerging economies can differentiate themselves from firms utilizing only contractual arrangement and enjoy more added values. Although advertising investment can be characterized by its ‘inflexibility and location-bound nature’ (Lee, Beamish, Lee, & Park, Reference Lee, Beamish, Lee and Park2009: 6), we argue that increased advertising efforts can positively affect firm performance. Therefore, this study puts forth Hypothesis 1 to examine the impact on firm performance of following the smiling curve to internalize advertising efforts for an owned brand.
Hypothesis 1: Following the smiling curve to increase advertising intensity can positively affect firm performance.
In terms of marketing efforts to develop an owned brand, marketing can be defined as ‘the activity, set of institutions, and processes for creating, communicating, delivering, and exchanging offerings that have value for customers, clients, partners, and society at large’ (AMA, 2013c: 1). Marketing efforts play a central role in developing a brand as well. The heart of marketing lies in the exchange process (Medina & Duffy, Reference Medina and Duffy1998), and the function of marketing depends on product advertisement and distribution channel development (Houston, Reference Houston1986; Medina & Duffy, Reference Medina and Duffy1998). Thus, advertising efforts can be regarded as influential as marketing efforts in establishing a successful brand. According to the American Marketing Association, an advertised brand is ‘owned by an organization that uses a marketing strategy usually involving substantial advertising’ (AMA, 2013d: 1). However, for this study, we examined advertising and marketing individually for two main reasons. First, advertising involves promoting the brand images of mostly finished or existing products, while marketing entails modifying ‘product lines by creating a new brand or an innovation’ (Medina & Duffy, Reference Medina and Duffy1998: 225). Hence, differences between advertising and marketing exist. Second, they are separated in the data from the Taiwan Economic Journal data bank, and we tested them separately to maintain the rigor and consistency of the present analysis. Based on the practical and theoretical viewpoints presented above, following the smiling curve to internalize marketing efforts for an owned brand should have a positive impact on firm performance, and therefore, we put forth Hypothesis 2.
Hypothesis 2: Following the smiling curve to increase marketing intensity can positively affect firm performance.
In terms of developing technological capabilities, on the top-left side of the smiling curve, the intensity of R&D efforts indicates a firm’s technological competence. Some scholars have identified R&D as one of the most valuable assets benefiting firm competitiveness (Kaplan & Norton, Reference Kaplan and Norton1992; Yu & Wang, Reference Yu and Wang2010). Kafouros and Forsans (Reference Kafouros and Forsans2012: 363) supported them by arguing that ‘in-house R&D plays a crucial role in enhancing firm performance.’ Chauvin and Hirschey (Reference Chauvin and Hirschey1993) investigated the impact of R&D on market value and found a positive relationship between R&D and firm performance. Chan, Martin, and Kensinger (Reference Chan, Martin and Kensinger1990) further indicated that stock prices positively respond to higher R&D expenditures. Although research also shows that the positive relationship between R&D and firm performance is conditional (Demirel & Mazzucato, Reference Demirel and Mazzucato2012), overall, we support the argument that reducing R&D expenditures is very likely to harm firm performance. As a result of the reduction in company expenses, the firm may also lack new products to launch and, with the lack of technical innovation, it may lose the opportunity to build its core competence in the market. A firm’s R&D expenditures should be regarded as an important investment (Kaplan & Norton, Reference Kaplan and Norton1992; Chauvin & Hirschey, Reference Chauvin and Hirschey1993). Using R&D expenditures to build a company’s core competence maintains its advantage in a dynamic market (Kaplan & Norton, Reference Kaplan and Norton1992). Thus, based on the smiling curve and theories of internalization and resource-based view, R&D intensity should have a positive impact on firm performance, and this study puts forth Hypothesis 3 to examine the impact of following the smiling curve to internalize R&D efforts for establishing technological capabilities on firm performance.
Hypothesis 3: Following the smiling curve to increase R&D intensity can positively affect firm performance.
Downsizing and firm performance
The discussion on downsizing has expanded provocatively over the past 3 decades (Gandolfi & Hansson, Reference Gandolfi and Hansson2011), and downsizing has become a significant part of organizational life (Gilson, Hurd, & Wagar, Reference Gilson, Hurd and Wagar2004). Downsizing has been called by other terms: resizing, declining, restructuring, reorganizing, re-engineering, streamlining, reduction-enforcing, rightsizing, retrenching, and slimming (Cascio, Reference Cascio2002). All these terms share certain similar meanings with downsizing. Tsai, Yen, Huang, and Huang (Reference Tsai, Yen, Huang and Huang2007) argued that downsizing can help firms reduce redundancy, while Hamel and Prahalad (Reference Hamel and Prahalad1994) further argued that downsizing can be used to implement organizational restructuring and enhance productivity. Supporters of downsizing consider it necessary to give firms the flexibility to reduce the workplace and stay competitive (Gilson, Hurd, & Wagar, Reference Gilson, Hurd and Wagar2004). According to Dial and Murphy (Reference Dial and Murphy1995), reducing the scale of the business is a specific practice of downsizing. Hamel and Prahalad (Reference Hamel and Prahalad1994) indicated that organizational restructuring can be implemented through downsizing to increase cost-effectiveness and performance, that is, downsizing may positively affect firm performance.
However, a growing firm increases its competitive advantage by setting up new departments, recruiting new staff members, and making investments to acquire resources. Therefore, downsizing may not necessarily lead to rightsizing (Luan, Tien, & Chi, Reference Luan, Tien and Chi2013), and firms that adopt downsizing strategies may fail to achieve the desired competitive advantages (Tsai et al., Reference Tsai, Yen, Huang and Huang2007) or may even face declining performance and dysfunctional behavior (Judge, Naoumova, & Koutzevol, Reference Judge, Naoumova and Koutzevol2003), that is, downsizing may negatively affect firm performance.
Although the evidence is inconclusive regarding whether downsizing can effectively contribute to better firm performance (Gandolfi & Littler, Reference Gandolfi and Littler2012), from a practical view on the smiling curve, firms that move toward the top-right and top-left ends of the smiling curve should perform better, earning more profit from both ends than from the bottom of the curve. Thus, the smiling curve should not frown (i.e., downsizing on advertising, marketing, and R&D) for better profitability. To investigate the impact of downsizing activities on firm performance, we issue the following hypotheses to examine the impact of downsizing advertising, marketing, and R&D:
Hypothesis 4a: Downsizing advertising efforts can negatively affect firm performance.
Hypothesis 5a: Downsizing marketing efforts can negatively affect firm performance.
Hypothesis 6a: Downsizing R&D efforts can negatively affect firm performance.
Economic downturn: the moderator
An economic downturn can be variously defined as ‘a significant decline in economic activity spread across the economy, lasting more than a few months’ (Regalia, Reference Regalia2008: 1) or as ‘a situation in which the economy of a country experiences a sudden downturn brought on by a financial crisis’ (Businessdictionary.com, 2013: 1). During an economic downturn, the environment can be full of uncertainties. These environmental uncertainties may cause a firm to have more difficulty predicting demands and inputs and adjusting its value chain in response to threats (Kogut, Reference Kogut1991) and negatively affect firm performance (Park, Park, & Lee, Reference Park, Park and Lee2012). Firms may fail to increase investments due to an economic downturn. Thus, during an economic downturn, downsizing becomes a top strategy that firms adopt to build an advantage (Fisher & White, Reference Fisher and White2000; Cascio, Reference Cascio2002). However, as argued earlier, an economic downturn can create an environment in which a firm can grow by taking advantage of undervalued assets through mergers and acquisitions. Downsizing strategies can not only negatively affect firm performance, but a firm that downsizes its operations or investments may also perform even worse during an economic downturn, that is, the smiling curve should not frown during an economic downturn to enhance a firm’s performance, and an economic downturn can negatively moderate the relationship between downsizing actions and firm performance. Therefore, we establish the following hypotheses:
Hypothesis 4b: During an economic downturn, a firm that downsizes advertising efforts can worsen its performance.
Hypothesis 5b: During an economic downturn, a firm that downsizes marketing efforts can worsen its performance.
Hypothesis 6b: During an economic downturn, a firm that downsizes R&D efforts can worsen its performance.
Method
Data and sample
Based on and extended from the Smiling Curve, as Figure 3 shows, we tested our hypotheses with data from 1996 to 2010 collected from the Taiwan Economic Journal data bank, the Financial Data Bank, the Market Observation Post System, and the websites of sample firms. The data yielded a sample of 436 listed companies in 11 industries: food, plastics, textiles, automotive, electronic cables, pharmaceuticals, glass, pulp, steel, rubber, and electronics. We also tracked disclosures in annual reports and the daily news records of these firms from 1996 to 2010 and compiled information from company self-descriptions to determine when firms announced downsizing. Overall, this study pooled the data for 436 firms from 1996 to 2010 and evaluated the final sample that met the data requirements. This study examined the models using cross-sectional time-series regressions. To reduce concerns about heteroskedasticity and autocorrelation, we used cross-sectional and time-series linear models that considered feasible generalized least squares in the presence of heteroskedasticity and autocorrelation across panels. This study also employed industry experts’ opinions to identify occurrences of significant downsizing, that is, downsizing occurs when the intensity of advertising, marketing, and R&D each decreased by >40%.

Figure 3 Smiling curve (adapted for the present study). Adapted from Stan Shih’s ‘reengineering acer’ (1996, Reference Shih2004b) (Chinese version), ‘millennium transformation: change management for new acer’ (Reference Shih2004a) (Chinese version), and ‘smile and beat your path’ (Reference Shih2012) (Chinese version)
Variables
Dependent variable
Firm performance
This study measured firm performance using the return on assets (ROA), or net income divided by total assets, to indicate a company’s profitability relative to its total assets. This study also considered the lag effects of investment or divestment on firm performance and therefore included firm performance from the same year, y0, and the following 3 years, y1, y2, and y3. Thus, four ratios of ROA from different years (y0, y1, y2, and y3) are employed to reflect firm performance.
Independent variables
Advertising intensity
This study used advertising expenses divided by sales to measure advertising intensity.
Marketing intensity
This study used marketing expenses divided by sales to measure marketing intensity.
R&D intensity
This study used R&D expenses divided by sales to measure R&D intensity.
Downsizing advertising
Downsizing advertising was measured by the decrease of advertising intensity between years. The value was 1 when advertising intensity decreased by >40%. Otherwise, the value was 0.
Downsizing marketing
Downsizing marketing was measured by the decrease of marketing intensity between years. The value was equal to 1 when marketing intensity decreased by >40%. Otherwise, the value was 0.
Downsizing R&D
Downsizing of R&D was measured by the decreases of R&D intensity between years. The value was equal to 1 when R&D intensity decreased by >40%. Otherwise, the value was 0.
Economic downturn
We used binary variables to distinguish periods of economic downturn and non-economic downturn in firms’ external environments as determined by decreases or increases of the gross domestic product. We used the binary variable 1 to represent an economic downturn for a year with a negative gross domestic product growth and 0 for a non-economic downturn year.
Control variables
Firm size
A firm changing its strategies and operations may encounter organizational inertia that affects its performance. Kelly and Amburgey (Reference Kelly and Amburgey1991) showed that inertia can vary with firm size. Hannan and Freeman (Reference Hannan and Freeman1984) argued that firm size is associated with resistance to change. Therefore, this study controlled for firm size and used total assets to calculate firm size. To control for the potential diminishing impact of firm size, a logarithmic transformation of the assets was used in the analysis.
Firm age
Kelly and Amburgey (Reference Kelly and Amburgey1991) showed that inertia can also vary with firm age, and Hannan and Freeman (Reference Hannan and Freeman1984) argued that inertia increases with age. Therefore, this study also controlled for firm age. To calculate firm age, we subtracted the founding year from the years tested in the study. A logarithmic transformation of firm age was used in the analyses to control for the potentially diminishing impact of firm age.
Past equity performance
Inefficient and ineffective expansion of a firm usually leads to poor equity performance, and downsizing may improve the firm’s equity performance (John, Lang, & Netter, Reference John, Lang and Netter1992). Since a firm’s prior performance is a concern to shareholders (Hitt, Hoskisson, & Ireland, Reference Hitt, Hoskisson and Ireland1994; Love & Nohria, Reference Love and Nohria2005), this study controlled for the previous year’s equity performance by including the return on equity in the models. Return on equity was calculated as net income divided by shareholder equity.
Industry
This study examined firms across 11 different industrial sectors. Some sectors are more labor oriented than others. To control for the industrial differences that may affect firm performance, we included the industry effect as a control variable. We divided firms’ revenues by their numbers of employees to measure the effect of industrial differences on labor intensity.
Results
Table 1 shows the descriptive statistics and correlation matrix. The economic downturn and the downsizing strategies for advertising, marketing, and R&D are represented by binary variables (0, 1). Firm size and age are in the logarithmic forms. In the regression analysis, collinearity among variables did not exist. Table 2 shows the breakdown of firms sampled for the present study.
Table 1 Descriptive statistics and correlation matrix

Note. R&D=research and development.
*p≤.05; **p≤.01.
Table 2 Breakdown of the sampled firms

Note. Firm size is presented by firm assets in New Taiwan Dollars; firm size, employee, and age are presented by average figures (from 1996 to 2010).
Table 3 presents the results of the regression analysis performed to test the hypothesis (Hypothesis 1) for Model 1 using four measures of firm performance: ROA over 4 years in the base year (y0) and in the next 3 years (y1, y2, and y3). The findings reveal that advertising intensity can negatively affect firm performance in the base year (y0; β=−9.2659, p<.01), the 1st year after (y1, β=−13.0092, p<.01), and the 2nd year after (y2, β=−20.6341, p<.01). However, the findings fail to support a significant relationship between advertising intensity and future performance during the 3rd year after (y3, β=3.6474, n.s.). Therefore, the findings from Model 1 fail to support Hypothesis 1, and the evidence indicates that advertising intensity does not positively affect performance. That is, following the smiling curve to increase advertising intensity does not significantly improve firm performance.
Table 3 Results of the regression models (Model 1: Hypothesis 1)

Note. N/n=number of observations/number of firms.
Note. **p≤.01.
Table 4 presents the results of the regression analysis performed to test Hypothesis 2 for Model 2 using four measures of firm performance: ROA over 4 years in the base year (y0) and the next 3 years (y1, y2, and y3). The findings reveal that marketing intensity has a negative impact on firm performance in the base year (y0, β=−3.336, p<.01) but a positive impact on firm performance in the 3rd year after (y3, β=6.848, p<.01). During the year after (y1, β=1.957, n.s.) and the 2nd year after (y2, β=0.395, n.s.), the results show no significant relationship between marketing intensity and firm performance. These mixed findings reveal limited support for Hypothesis 2, and the evidence indicates that a lag effect may characterize the positive relationship between marketing intensity and firm performance. That is, following the smiling curve to increase marketing intensity does not improve firm performance until a later time.
Table 4 Results of the regression models (Model 2: Hypothesis 2)

Note. N/n=number of observations/number of firms.
Note. †p<.10; **p≤.01.
Based on the same measures of firm performance over 4 years in the base year (y0) and the next 3 years (y1, y2, and y3), Model 3 examines the relationship between R&D intensity and firm performance. Table 5 illustrates the results of the regression analysis performed to test Hypothesis 3 for Model 3. Unlike the findings for Models 1 and 2, the results for Model 3 show significant but different relationships between R&D intensity and firm performance in all the tested years. R&D intensity has a negative impact on firm performance in the base year (y0, β=−11.340, p<.01) but positive impacts on firm performance in the next 3 years (y1, y2, and y3) (y1, β=7.863, p<.05; y2, β=13.779, p<.01; y3, β=16.988, p<.01). These findings reveal high support for Hypothesis 3, and the evidence indicates that R&D intensity may negatively affect firm performance in the year of investment but will improve firm performance in the following years. Hence, following the smiling curve to increase R&D intensity can improve a firm’s future performance.
Table 5 Results of the regression models (Model 3: Hypothesis 3)

Note. N/n=number of observations/number of firms; R&D=research and development.
Note. *p≤.05; **p≤.01.
Next, Model 4 examined the impact of downsizing strategies involving advertising on firm performance in the base year (y0) and the next 3 years (y1, y2, and y3) and whether an economic downturn moderates the relationship between downsizing strategy on advertising and firm performance. The results in Table 6 show that downsizing on advertising does not have any significant impact on firm performance (y0, β=−0.012, n.s.; y1, β=0.154, n.s.; y2, β=0.230, n.s.; y3, β=−0.148, n.s.) and thus do not support Hypothesis 4a.
Table 6 Results of the regression models (Model 4: Hypotheses 4a and 4b)

Note. N/n=number of observations/number of firms.
Note. †p<.10; *p≤.05; **p≤.01.
However, the results also show that an economic downturn can negatively moderate the relationship between downsizing on advertising and firm performance in the base year (y0, β=−1.794, p<.01) but does not moderate the relationship between downsizing on advertising and firm performance in the next 3 years (y1, y2, and y3) (y1, β=0.536, n.s.; y2, β=0.018, n.s.; y3, β=−0.182, n.s.). Thus, the findings partially support Hypothesis 4b, and the evidence indicates that downsizing on advertising can worsen firm performance during an economic downturn (when firm performance is measured by ROA from the base year, y0), as is also shown in Figure 4.

Figure 4 Regression lines for the downsizing advertising explaining firm performance for the economic downturn
Model 5 examines the impact of downsizing of marketing strategies on firm performance in the base year (y0) and the next 3 years (y1, y2, and y3) and whether an economic downturn moderates the relationship between downsizing marketing and firm performance. The results in Table 7 show that downsizing marketing activities does not have any significant impact on firm performance in the next year (y1, β=0.102, n.s.) and the 3rd year after (y3, β=0.659, p<.1). However, downsizing on marketing activities can positively affect firm performance in the base year (y0, β=1.100, p<.01) and the 2nd year after (y2, β=0.864, p<.01). These findings fail to support Hypothesis 5a, and the evidence indicates that downsizing on marketing activities does not negatively affect firm performance. The results also demonstrate that an economic downturn fails to significantly moderate the relationship between downsizing marketing and firm performance in all the years tested in the model (y0, y1, y2, and y3) (y0, β=−0.970, n.s.; y1, β=0.536, n.s.; y2, β=−1.431, n.s.; y3, β=−0.286, n.s.). Thus, the findings fail to support Hypothesis 5b, and the evidence indicates that downsizing marketing efforts fails to interact with the economic downturn to affect firm performance in all the years tested.
Table 7 Results of the regression models (Model 5: Hypotheses 5a and 5b)

Note. N/n=number of observations/number of firms.
Note. †p<.10; *p≤.05; **p≤.01.
Model 6 examines the impact of downsizing R&D strategies on firm performance in the base year (y0) and the next 3 years (y1, y2, and y3) and whether an economic downturn moderates the relationship between downsizing R&D and firm performance. The results in Table 8 show that downsizing on R&D activities does not have a significant impact on firm performance in all years tested (y0, β=0.200, n.s.; y1, β=−0.174, n.s.; y2, β=−0.026, n.s.; y3, β=0.010, n.s.). These findings fail to support Hypothesis 6a, and the evidence indicates that downsizing on marketing activities does not significantly affect firm performance. The results also show that an economic downturn fails to significantly moderate the relationship between downsizing on marketing and firm performance in all years tested (y0, β=0.030, n.s.; y1, β=−0.218, n.s.; y2, β=−0.741, n.s.; y3, β=1.086, n.s.). Thus, the findings fail to support Hypothesis 6b, and the evidence indicates that downsizing R&D efforts fails to interact with the economic downturn to affect a firm’s current and future performance.
Table 8 Results of the regression models (Model 6: Hypotheses 6a and 6b)

Note. N/n=number of observations/number of firms; R&D=research and development.
Note. **p≤.01.
In short, the empirical findings show mixed support for the hypotheses tested and reveal that following the smiling curve may not improve a firm’s current performance but may affect its future performance in different ways: a firm that internalizes advertising efforts may negatively affect its future performance, while a firm that internalizes marketing efforts and R&D efforts may improve its future performance. The popular use of downsizing practices to streamline businesses may lead to better performance only under limited circumstances, because only downsizing marketing activities can positively affect a firm’s current and some future performance. In addition, contrary to conventional wisdom, downsizing practices may not necessarily lead to significant differences in firm profitability during economic downturns and non-economic downturns, because only downsizing advertising efforts during an economic downturn can significantly worsen a firm’s current performance.
Discussion and Conclusion
Does following the smiling curve matter to firm performance? This study used Taiwanese firms to examine whether firms in emerging markets can improve their performance by following the smiling curve to internalize brand efforts and technological capabilities from OEM arrangements. The findings show mixed evidence for the effects of the smiling curve. In an emerging economy, pursuing brands through advertising efforts might not be a good strategy for firms because advertising intensity can negatively affect present and future firm performance. However, efforts to pursue brands through marketing may affect firm performance differently from advertising. Pursuing brands through marketing efforts can negatively affect the present performance of a firm, but such marketing efforts can benefit a firm’s future performance. Thus, there is a lag effect in the impact of the smiling curve on marketing’s contribution to firm performance. That is, the benefits of following the smiling curve by internalizing marketing efforts may not be realized immediately but will appear in the following years. Hence, a firm in an emerging economy that aims to pursue own-brand strategies should carefully consider investing in advertising because the return on such investments may not be optimistic. However, investing in marketing may improve firm performance in the long run, although the benefits from investing in marketing are challengeable in the short run. R&D investments made by firms in emerging economies may also improve firm performance in the long run, while the impact of such investments on short-term performance may not be preferable. Therefore, following the smiling curve matters to firm performance under some circumstances, and some benefits may take some time to be realized. The evidence-based findings of this study partially support the practical impacts of the smiling curve but further extend to highlight the theoretical lens of resources-based perspectives and the evolutionary process of design management (Erichsen & Christensen, Reference Erichsen and Christensen2013).
Can downsizing actions negatively affect firm performance and worsen it during an economic downturn? Contrary to conventional wisdom, downsizing on advertising and R&D did not affect firm performance in any year of data in this study, but downsizing on marketing positively affected firm performance in the base year and the 2nd year after. The finding of a positive relationship between downsizing marketing efforts and base-year performance is consistent with the finding of the smiling curve that marketing intensity is negatively related to a firm’s current performance. Furthermore, these evidence-based findings challenge the argument that an economic downturn can worsen the relationship between downsizing strategies and firm performance. An economic downturn only negatively moderated the relationship between downsizing advertising and firm performance in the present year and did not affect the relationship between downsizing marketing and firm performance and between downsizing R&D and firm performance in the years tested by this study. Thus, downsizing on marketing can benefit firm performance under certain circumstances, and an economic downturn fails to interact with downsizing marketing efforts to affect firm performance. An economic downturn also fails to interact with downsizing R&D efforts to affect firm performance, but can only negatively moderate the relationship between downsizing advertising efforts and a firm’s present performance. Therefore, the impacts of downsizing strategies on firm performance and their interactions with an economic downturn are not as significant as expected, and a firm should be careful when considering downsizing strategies to improve performance, especially during an economic downturn.
To sum up, some value to a firm that follows the smiling curve may take time to be realized, and a firm may frown if it expects only short-term advantages. Downsizing activities may not always be the appropriate strategy to improve firm performance, regardless of the economic conditions. That is, a smiling curve should not frown during an economic downturn because it will not enhance firm performance. These findings imply that a firm should carefully consider and evaluate downsizing strategies to ensure that downsizing leads to rightsizing.
Limitations and Directions for Future Research
This study has some limitations. First, it includes only firms publicly listed in Taiwan. Thus, the generalizability of the findings to other regions is debatable. Future research may extend the research scope to other regions to seek further evidence and validate the present findings.
Second, a firm’s R&D efforts should affect not only technological capabilities, but also brand value. In other words, the influence from the customers’ end may affect product development from the innovation’s end (e.g., Lin, Tu, Chen, & Huang, Reference Lin, Tu, Chen and Huang2013), that is, both ends of the smiling curve may jointly affect firm performance. Future research may consider including or controlling for more factors that may affect firm performance.
Finally, this study focuses on operational downsizing practices for analyzing the effect of the smiling curve, but future research may consider other non-operational strategies (i.e., human resources-related downsizing) to seek more evidence from various perspectives to enrich the related studies in this stream.
Acknowledgments
The authors would like to thank editors and reviewers for their comments and suggestions.


