1 Introduction
The impingement of streamwise-oriented vortices with aerodynamic surfaces, also known as a perpendicular vortex–surface interaction, has historically proven to be significant in a number of technical applications. One aircraft can encounter the wake of another body when flying in close proximity or harnessing energy lost by a leader aircraft in formation flight (Hummel Reference Hummel1995; Blake & Gingras Reference Blake and Gingras2004; Ning Reference Ning2011; Inasawa, Mori & Asai Reference Inasawa, Mori and Asai2012; Kless et al. Reference Kless, Aftosmis, Ning and Nemec2013; Slotnick et al. Reference Slotnick, Clark, Friedmann, Yadlin, Yeh, Carr, Czech and Bieniawski2014). Pertaining to a single air vehicle, the tip vortex from a canard forewing can encounter other surfaces downstream and the leading-edge vortex of a slender wing has been known to break down upstream of vertical fins (Mayori & Rockwell Reference Mayori and Rockwell1994; Wolfe et al. Reference Wolfe, Canbazoglu, Lin and Rockwell1995; Gordnier & Visbal Reference Gordnier and Visbal1999; Gursul & Xie Reference Gursul and Xie2001). Blades in rotating machinery can encounter vortices shed from other components upstream, often resulting in load hysteresis or rotor noise (Ham Reference Ham1975; Wittmer & Devenport Reference Wittmer and Devenport1999; Zanotti et al. Reference Zanotti, Ermacora, Campanardi and Gibertini2014; Bhagwat, Caradonna & Ramasamy Reference Bhagwat, Caradonna and Ramasamy2015). Rockwell (Reference Rockwell1998) provides an excellent review on the general class of vortex body interactions while a brief discussion of the more recent literature on streamwise vortex interactions can be found in Barnes, Visbal & Gordnier (Reference Barnes, Visbal and Gordnier2015).
Several recent high-fidelity large-eddy simulation (LES) studies have sought to develop a better understanding of the unsteady aspects of streamwise-oriented vortex interactions. Barnes et al. (Reference Barnes, Visbal and Gordnier2015) studied the interaction between two finite aspect-ratio wings in close proximity and Garmann & Visbal (Reference Garmann and Visbal2015a ) placed a finite aspect-ratio wing in line with a larger streamwise vortex superimposed upstream. Both works reported on the unsteady flow structure and aerodynamic loading at several lateral placements of the incident vortex. Of particular interest, Garmann & Visbal (Reference Garmann and Visbal2015a ) reported spiralling undulations of the initially steady, laminar vortex upon impingement with the leading edge. This unsteady behaviour was found to persist for a more realistic configuration using a NACA0012 airfoil at a much higher flow speed (Garmann & Visbal Reference Garmann and Visbal2015b ). Garmann & Visbal (Reference Garmann and Visbal2014) evaluated the impact of a meandering vortex by imposing a sinusoidal lateral motion on the incident vortex revealing that sensitivity of the rolling moment to lateral positioning in the static case translates to buffeting loads in the context of unsteady vortex encounters.
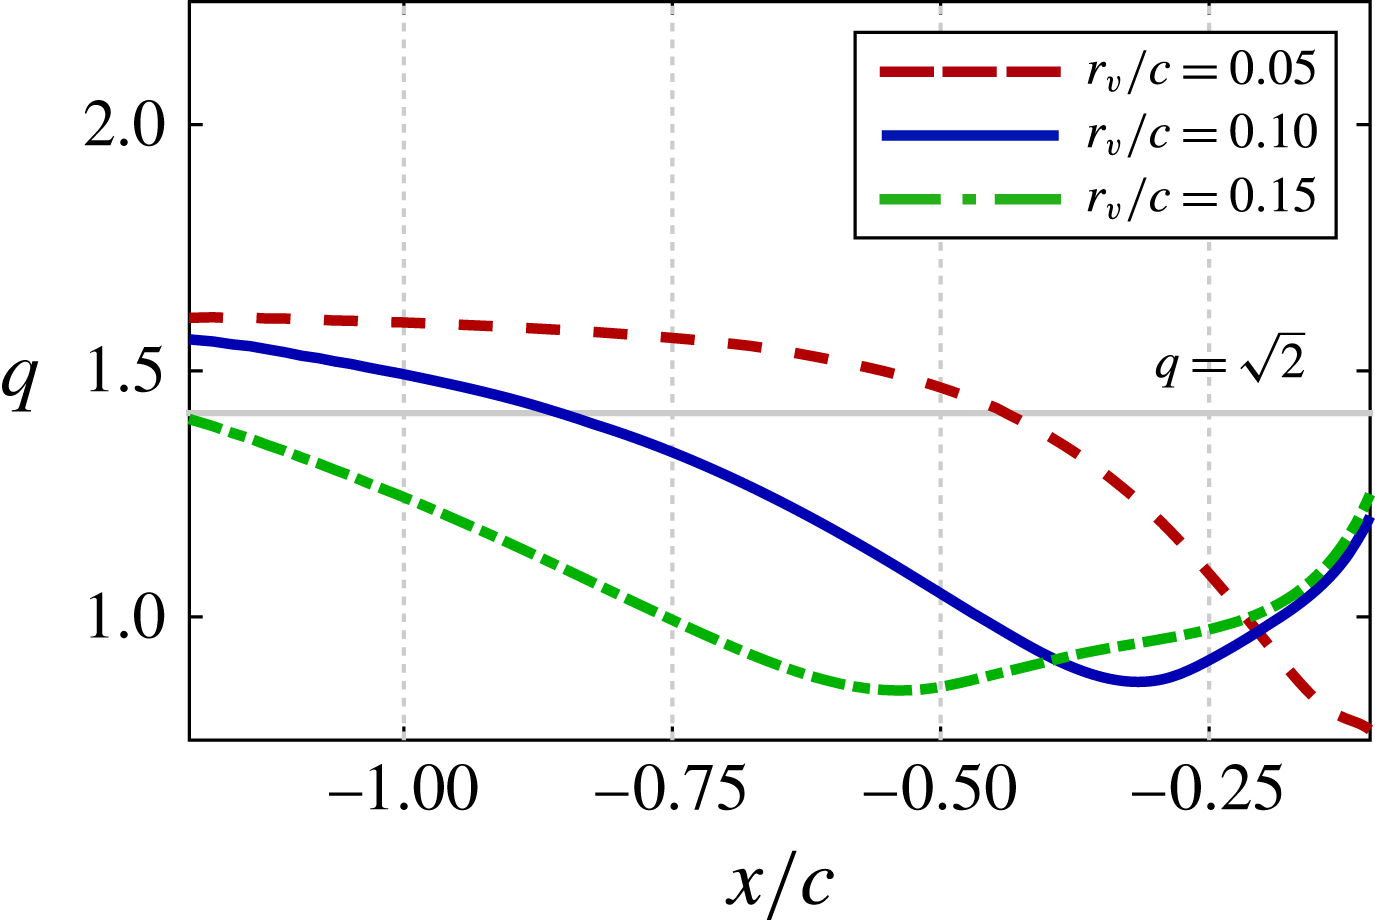
The preceding efforts have made progress in understanding typical perpendicular vortex–surface interactions over a range of lateral positions and unsteady interactions. Relative motion between aircraft or aeroelastic deflection of a fin, control surface or high aspect-ratio wing provided by vortex-induced bending (Barnes, Visbal & Gordnier Reference Barnes, Visbal and Gordnier2014a
; Barnes, Visbal & Huang Reference Barnes, Visbal and Huang2014b
) can impose an effectively vertical shift in vortex position. The influence of relative vertical positioning has not been well addressed in the literature and, as will become apparent later, has significant implications for vortex–surface interactions. The aim of the current work is to shed light on the impact of relative vertical positioning on the unsteady interactions between a well-defined streamwise-oriented vortex and a finite aspect-ratio flat plate wing. The effects of the cross-stream vortex position at a fixed lateral station are evaluated. Several vortex core sizes and axial profiles are investigated with the primary emphasis on the case of a wake-like
 $q$
-vortex with a core size of
$q$
-vortex with a core size of
 $r_{v}/c=0.1$
.
$r_{v}/c=0.1$
.
2 Configuration
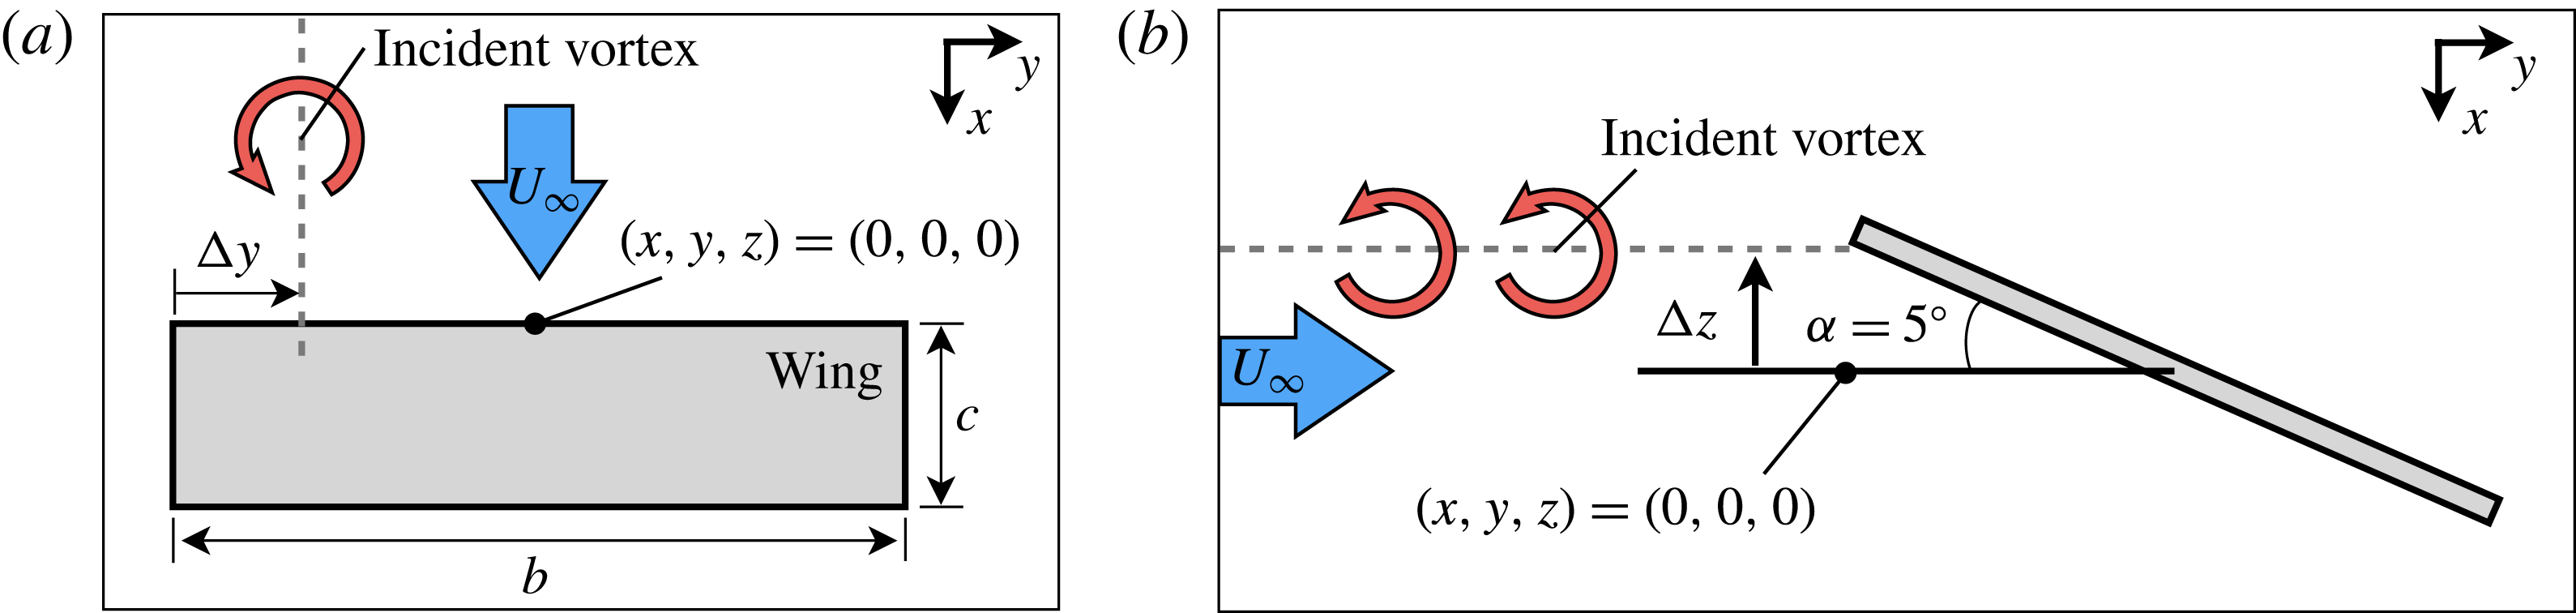
A finite-aspect-ratio
 $AR=6$
, rectangular, flat-plate wing operating at a chord-based Reynolds number of
$AR=6$
, rectangular, flat-plate wing operating at a chord-based Reynolds number of
 $Re_{c}=30\,000$
, angle of attack of
$Re_{c}=30\,000$
, angle of attack of
 ${\it\alpha}=5^{\circ }$
and thickness of
${\it\alpha}=5^{\circ }$
and thickness of
 $t/c=0.03$
is placed downstream of a streamwise-oriented vortex superimposed at the inflow boundary located
$t/c=0.03$
is placed downstream of a streamwise-oriented vortex superimposed at the inflow boundary located
 $10c$
upstream of the mid-chord, as shown in figure 1. The vortex position at the inflow boundary is described by its lateral,
$10c$
upstream of the mid-chord, as shown in figure 1. The vortex position at the inflow boundary is described by its lateral,
 ${\rm\Delta}y$
, and vertical,
${\rm\Delta}y$
, and vertical,
 ${\rm\Delta}z$
, offsets measured relative to the wingtip mid-chord and shown in figure 1. Every case evaluated in this work utilizes a fixed lateral offset of
${\rm\Delta}z$
, offsets measured relative to the wingtip mid-chord and shown in figure 1. Every case evaluated in this work utilizes a fixed lateral offset of
 ${\rm\Delta}y/c=0.25$
while the vertical position is varied in the range of
${\rm\Delta}y/c=0.25$
while the vertical position is varied in the range of
 $-0.25\leqslant {\rm\Delta}z/c\leqslant 0.1$
.
$-0.25\leqslant {\rm\Delta}z/c\leqslant 0.1$
.
The streamwise vortex is a
 $q$
-vortex (Batchelor Reference Batchelor1964) described analytically in cylindrical coordinates where the radial, circumferential and axial velocities are
$q$
-vortex (Batchelor Reference Batchelor1964) described analytically in cylindrical coordinates where the radial, circumferential and axial velocities are
 $$\begin{eqnarray}\displaystyle & \displaystyle u_{r}(r)=0 & \displaystyle\end{eqnarray}$$
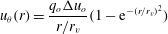 $$\begin{eqnarray}\displaystyle & \displaystyle u_{{\it\theta}}(r)=\frac{q_{o}{\rm\Delta}u_{o}}{r/r_{v}}(1-\text{e}^{-(r/r_{v})^{2}}) & \displaystyle\end{eqnarray}$$
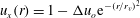 $$\begin{eqnarray}\displaystyle & \displaystyle u_{x}(r)=1-{\rm\Delta}u_{o}\text{e}^{-(r/r_{v})^{2}} & \displaystyle\end{eqnarray}$$
 $r_{v}$
is a measure of the vortex radius,
$r_{v}$
is a measure of the vortex radius,
 ${\rm\Delta}u_{o}$
is the initial maximum velocity deficit, and
${\rm\Delta}u_{o}$
is the initial maximum velocity deficit, and
 $q_{o}$
is the initial swirl ratio defined by
$q_{o}$
is the initial swirl ratio defined by  $$\begin{eqnarray}q_{o}\approx 1.567V_{o}/{\rm\Delta}u_{o},\end{eqnarray}$$
where
 $V_{o}$
is the maximum tangential velocity. Unless otherwise specified, the vortex applied in this article is a wake-like
$V_{o}$
is the maximum tangential velocity. Unless otherwise specified, the vortex applied in this article is a wake-like
 $q$
-vortex with a radius of
$q$
-vortex with a radius of
 $r_{v}=0.1c$
, axial velocity deficit of
$r_{v}=0.1c$
, axial velocity deficit of
 ${\rm\Delta}u_{o}=0.4U_{\infty }$
and swirl ratio of
${\rm\Delta}u_{o}=0.4U_{\infty }$
and swirl ratio of
 $q_{o}=2$
. The specific swirl ratio chosen places the vortex well within the stable regime predicted by Leibovich & Stewartson (Reference Leibovich and Stewartson1983). Further details on the application of this vortex to LES simulations can be found in Garmann & Visbal (Reference Garmann and Visbal2015a
).
$q_{o}=2$
. The specific swirl ratio chosen places the vortex well within the stable regime predicted by Leibovich & Stewartson (Reference Leibovich and Stewartson1983). Further details on the application of this vortex to LES simulations can be found in Garmann & Visbal (Reference Garmann and Visbal2015a
).

Figure 1. Configuration for streamwise-oriented vortex impingement: (a) top view, (b) side view.
3 Methodology
The high-order implicit large-eddy simulation (ILES) solver FDL3DI (Gaitonde & Visbal Reference Gaitonde and Visbal1998; Visbal & Gaitonde Reference Visbal and Gaitonde1999) is used for all simulations in the present study. This computational framework solves the full, unfiltered, compressible Navier–Stokes equations cast in strong conservation form on a general time-dependent curvilinear coordinate system. The system of equations is integrated in time using the implicit, approximate factorization of Beam & Warming (Reference Beam and Warming1978) and simplified through the diagonalization of Pulliam & Chaussee (Reference Pulliam and Chaussee1981). The time-integration scheme is augmented through a Newton-like sub-iteration procedure to maintain temporal accuracy (Rai & Chakravarthy Reference Rai and Chakravarthy1986; Rai Reference Rai1989). Fourth-order, nonlinear dissipation terms (Jameson, Schmidt & Turkel Reference Jameson, Schmidt and Turkel1981; Pulliam Reference Pulliam1986) are appended to the implicit operator to improve stability.
The explicit operator of the implicit time-integration scheme represents the numerical approximation and dictates the formal order of accuracy for the chosen scheme. Spatial derivatives in the explicit operator are discretized along a coordinate line in the computational domain using the implicit, sixth-order, formulation of compact-differencing (Lele Reference Lele1992). High-order one-sided formulas, designed to retain the tri-diagonal form of the system of equations, are applied at the computational boundaries (Gaitonde & Visbal Reference Gaitonde and Visbal1998; Visbal & Gaitonde Reference Visbal and Gaitonde1999).
The solution procedure for the Navier–Stokes equations described above is used to solve laminar, transitional and turbulent flow regions without change using an ILES procedure. The ILES approach does not require sub-grid-scale (SGS) models or the additional heat flux terms required by standard LES. Alternatively, a high-order, low-pass Padé-type filter, based on the templates proposed by Alpert (Reference Alpert1981) and Lele (Reference Lele1992), is applied to eliminate spurious components. The filter is applied to the conserved variables along each transformed coordinate direction once after each time step or sub-iteration. An eighth-order filter is used for the interior points in the present work which selectively damps only the poorly resolved high-wavenumber content. The one-sided filtering strategies described by Gaitonde & Visbal (Reference Gaitonde and Visbal1999) and Visbal & Gaitonde (Reference Visbal and Gaitonde1999) are applied at near-boundary points. The high-order low-pass filtering used in conjunction with high-order spatial discretization provides an effective alternative to the use of SGS models as shown by Visbal & Rizzetta (Reference Visbal and Rizzetta2002), Visbal, Morgan & Rizzetta (Reference Visbal, Morgan and Rizzetta2003), and more recently by Garmann, Visbal & Orkwis (Reference Garmann, Visbal and Orkwis2012). A re-interpretation of this ILES approach in the context of an approximate deconvolution model (Stolz & Adams Reference Stolz and Adams1999) has been presented by Mathew et al. (Reference Mathew, Lechner, Foysi, Sesterhenn and Friedrich2003). As the grid resolution increases or Reynolds number decreases, the ILES approach is effectively direct numerical simulation (DNS).
The computational mesh applied to the current problem is of a similar topology to that described by Garmann & Visbal (Reference Garmann and Visbal2015a
). Grid points have been redistributed to accommodate the higher Reynolds number and vortex positions for the present work where the relevant dimensions are discussed later in § 4. The solid boundaries at the wing surfaces employ a no-slip, third-order adiabatic (
 $\partial T/\partial n=0$
), and zero normal pressure gradient (
$\partial T/\partial n=0$
), and zero normal pressure gradient (
 $\partial P/\partial n=0$
). Equations (2.1)–(2.3) are superimposed onto the free stream velocity prescribed at the inflow boundary where first-order extrapolation of pressure is also applied. All other far-field boundaries utilize a first-order extrapolation of the primitive variables with the exception of pressure, which is set to the free stream value. In addition to the described far-field conditions, the high-order, low-pass filter is used in conjunction with rapidly stretching the mesh outside the region of interest, which serves as a buffer for spurious reflections. Energy not supported as the mesh expands is reflected in the form of high-frequency modes which are eliminated by the highly discriminating filter in a manner similar to that described by Visbal & Gaitonde (Reference Visbal and Gaitonde2001).
$\partial P/\partial n=0$
). Equations (2.1)–(2.3) are superimposed onto the free stream velocity prescribed at the inflow boundary where first-order extrapolation of pressure is also applied. All other far-field boundaries utilize a first-order extrapolation of the primitive variables with the exception of pressure, which is set to the free stream value. In addition to the described far-field conditions, the high-order, low-pass filter is used in conjunction with rapidly stretching the mesh outside the region of interest, which serves as a buffer for spurious reflections. Energy not supported as the mesh expands is reflected in the form of high-frequency modes which are eliminated by the highly discriminating filter in a manner similar to that described by Visbal & Gaitonde (Reference Visbal and Gaitonde2001).
Each of the cases presented were initially run for
 ${\it\tau}=tc/U_{\infty }=40$
non-dimensional times, allowing for simulations to achieve a time-asymptotic state after the vortex propagates past the wing and startup transients have washed out of the solution. The computations were then run for an additional 10 characteristic times, allowing for the collection of time-mean and statistical quantities. Each simulation utilizes a non-dimensional time step of
${\it\tau}=tc/U_{\infty }=40$
non-dimensional times, allowing for simulations to achieve a time-asymptotic state after the vortex propagates past the wing and startup transients have washed out of the solution. The computations were then run for an additional 10 characteristic times, allowing for the collection of time-mean and statistical quantities. Each simulation utilizes a non-dimensional time step of
 ${\rm\Delta}{\it\tau}=0.0001$
in order to provide sufficient temporal resolution for the fine-scale flow structure.
${\rm\Delta}{\it\tau}=0.0001$
in order to provide sufficient temporal resolution for the fine-scale flow structure.
4 Effect of grid resolution and sample size
Three mesh systems were created for an analysis of the effects of grid resolution. The mid and coarse grids were derived from the fine mesh by reducing the number of elements in each coordinate direction to 75 % and 50 %, respectively, of the fine distribution. The global dimensions and scale factors for each mesh along with maximum streamwise
 ${\it\delta}x_{s,max}$
, spanwise
${\it\delta}x_{s,max}$
, spanwise
 ${\it\delta}y_{s,max}$
, and surface normal
${\it\delta}y_{s,max}$
, and surface normal
 ${\it\delta}z_{s}$
spacing on the wing surface are provided in table 1. Several quantities are evaluated for the direct impingement (
${\it\delta}z_{s}$
spacing on the wing surface are provided in table 1. Several quantities are evaluated for the direct impingement (
 ${\rm\Delta}y/c=-2.75$
,
${\rm\Delta}y/c=-2.75$
,
 ${\rm\Delta}z/c=0$
) case in the following.
${\rm\Delta}z/c=0$
) case in the following.
Table 1. Grid resolution details.

Georgiadis, Rizzetta & Fureby (Reference Georgiadis, Rizzetta and Fureby2010) documents recommendations for wall-normalized spacings in the surface-normal, streamwise and spanwise directions of
 ${\it\delta}z^{+}<1$
,
${\it\delta}z^{+}<1$
,
 ${\it\delta}x^{+}<150$
and
${\it\delta}x^{+}<150$
and
 ${\it\delta}y^{+}<40$
, respectively, as bounds for well-resolved LES computations. It should be noted that the wall spacing recommendations were derived from fully turbulent channel flow problems and may not perfectly translate to external flow problems with significant regions of separation or in the transitional flow regime, as is the case in this work. Therefore, the wall-unit values should be viewed as approximate guidelines for appropriate grid spacing in such cases while accompanied by further scrutiny of the effects of mesh density on other parameters.
${\it\delta}y^{+}<40$
, respectively, as bounds for well-resolved LES computations. It should be noted that the wall spacing recommendations were derived from fully turbulent channel flow problems and may not perfectly translate to external flow problems with significant regions of separation or in the transitional flow regime, as is the case in this work. Therefore, the wall-unit values should be viewed as approximate guidelines for appropriate grid spacing in such cases while accompanied by further scrutiny of the effects of mesh density on other parameters.
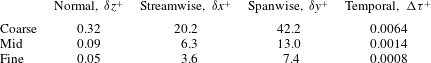
Each of the wall units was measured along the midspan at
 $x/c=0.85$
where the spanwise resolution is coarsest and the flow is transitional and reattached. These values are listed in table 2. The values reported for the mid and fine grids are within the prescribed bounds while the coarse mesh falls slightly outside of the recommended range. Although wall spacings for the fine grid fall within the DNS regime at the surface, mesh stretching away from the wing likely drives cell sizes into the LES range for much of the flow domain. It is also important to note that the ratio of streamwise to spanwise spacing is much smaller than that suggested in Georgiadis et al. (Reference Georgiadis, Rizzetta and Fureby2010). This choice is intentional as the grid is designed for the highly three-dimensional flow near the vortex encounter which provides a substantial spanwise velocity component. Due to the change in the dominant flow direction near the wingtip, a one-to-one ratio between
$x/c=0.85$
where the spanwise resolution is coarsest and the flow is transitional and reattached. These values are listed in table 2. The values reported for the mid and fine grids are within the prescribed bounds while the coarse mesh falls slightly outside of the recommended range. Although wall spacings for the fine grid fall within the DNS regime at the surface, mesh stretching away from the wing likely drives cell sizes into the LES range for much of the flow domain. It is also important to note that the ratio of streamwise to spanwise spacing is much smaller than that suggested in Georgiadis et al. (Reference Georgiadis, Rizzetta and Fureby2010). This choice is intentional as the grid is designed for the highly three-dimensional flow near the vortex encounter which provides a substantial spanwise velocity component. Due to the change in the dominant flow direction near the wingtip, a one-to-one ratio between
 ${\it\delta}x^{+}$
and
${\it\delta}x^{+}$
and
 ${\it\delta}y^{+}$
is more appropriate for this problem. Although the spanwise mesh density is highly clustered near the vortex encounter, the streamwise distribution is not modified along the span leading to the very low measurement of
${\it\delta}y^{+}$
is more appropriate for this problem. Although the spanwise mesh density is highly clustered near the vortex encounter, the streamwise distribution is not modified along the span leading to the very low measurement of
 ${\it\delta}x^{+}$
at
${\it\delta}x^{+}$
at
 $y/c=0$
.
$y/c=0$
.
Table 2. Non-dimensional wall units measured at
 $x/c=0.85$
along the midspan.
$x/c=0.85$
along the midspan.

Suitability of the time step is also important to consider. Choi & Moin (Reference Choi and Moin1994) recommended an upper bound for the wall-normalized time step of
 ${\rm\Delta}{\it\tau}^{+}<0.4$
to resolve the viscous time scale in the sublayer. Values of
${\rm\Delta}{\it\tau}^{+}<0.4$
to resolve the viscous time scale in the sublayer. Values of
 ${\rm\Delta}{\it\tau}^{+}$
for each mesh fall well below this bound, demonstrating sufficient temporal resolution for the relevant scales of the transitional flow structure. A measure of the CFL condition for each grid is obtained using the maximum time-mean streamwise velocity,
${\rm\Delta}{\it\tau}^{+}$
for each mesh fall well below this bound, demonstrating sufficient temporal resolution for the relevant scales of the transitional flow structure. A measure of the CFL condition for each grid is obtained using the maximum time-mean streamwise velocity,
 $\overline{u}_{max}$
, and minimum streamwise grid spacing,
$\overline{u}_{max}$
, and minimum streamwise grid spacing,
 ${\it\delta}x_{min}$
. This provides a very conservative estimate for each case where
${\it\delta}x_{min}$
. This provides a very conservative estimate for each case where
 $\overline{u}_{max}{\rm\Delta}{\it\tau}/{\it\delta}x_{min}=0.14$
,
$\overline{u}_{max}{\rm\Delta}{\it\tau}/{\it\delta}x_{min}=0.14$
,
 $0.21$
and
$0.21$
and
 $0.27$
for the coarse mid and fine grids, respectively.
$0.27$
for the coarse mid and fine grids, respectively.
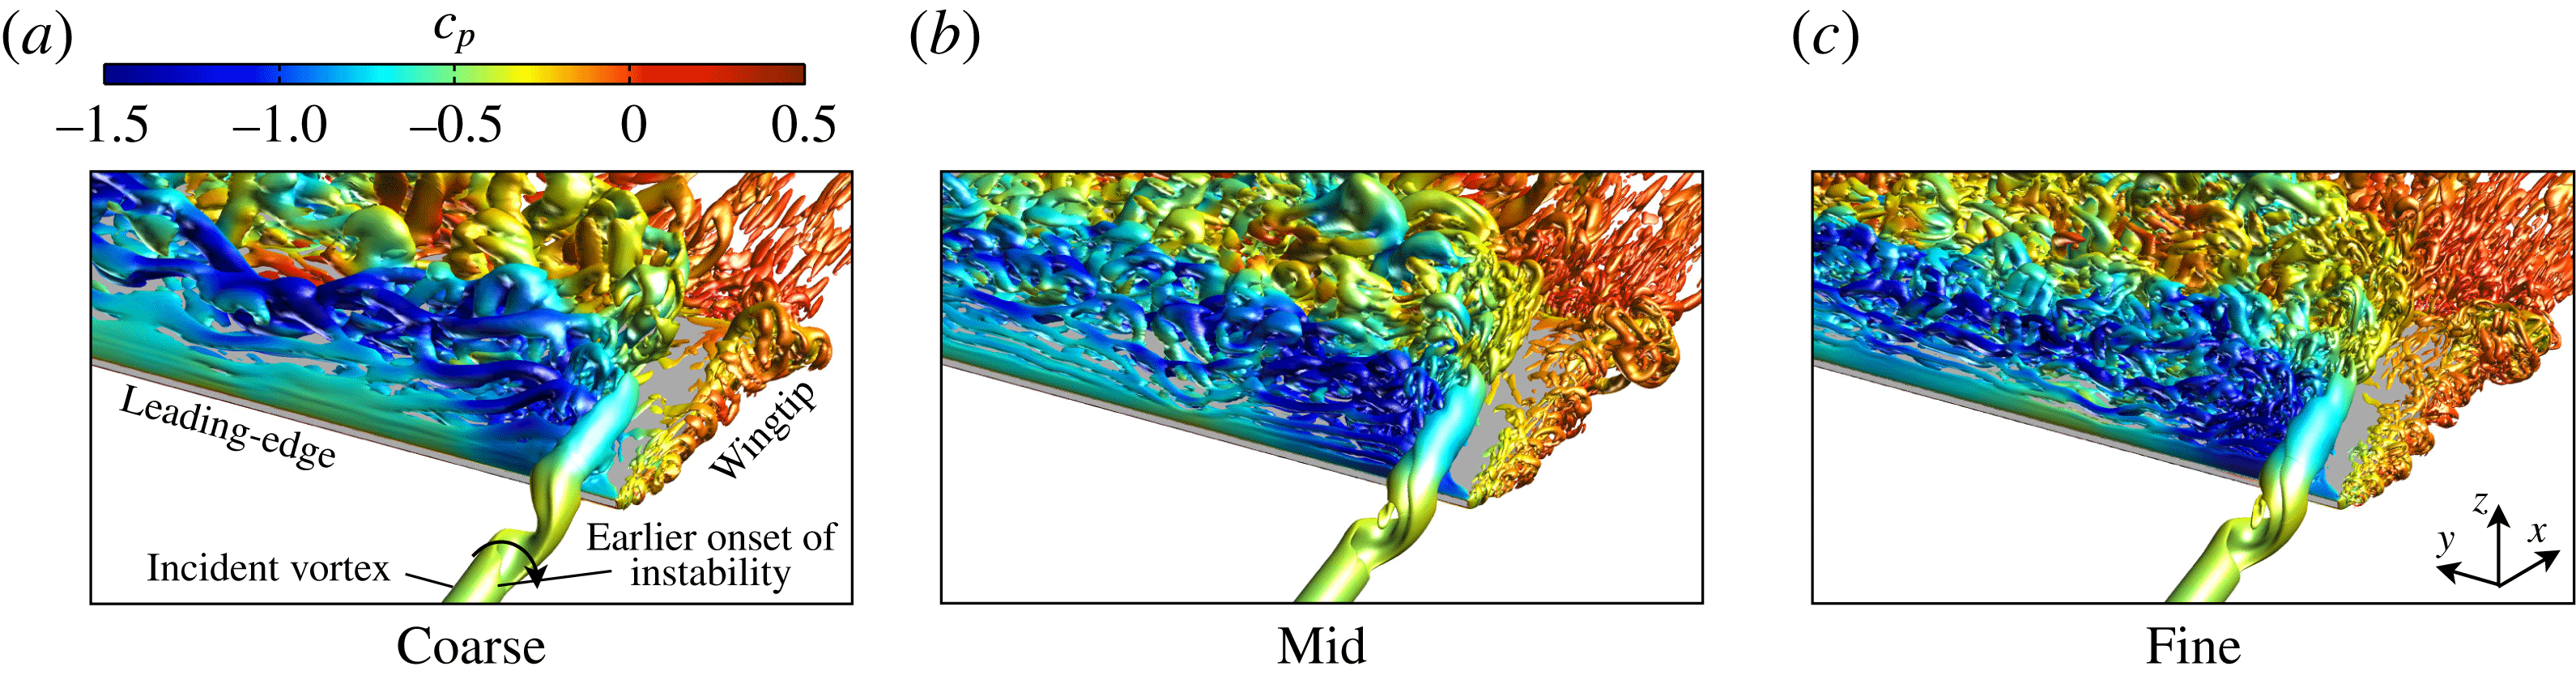
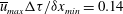
Figure 2(a,b) portrays tangential and streamwise velocity profiles, respectively, across the vortex core upstream of the static wing leading edge. All levels of resolution produce indistinguishable results, demonstrating that the resolution of the current grid system is more than sufficient to preserve the streamwise vortex as it propagates toward the wing. The instantaneous flow structure of the vortex encounter for each mesh is shown in figure 3. Vortical structures are depicted using an iso-surface of
 $Q$
-criterion (Jeong & Hussain Reference Jeong and Hussain1995) in this work. This parameter is defined by the second invariant of the velocity gradient tensor where a positive value indicates that rotation dominates strain and shear. The
$Q$
-criterion (Jeong & Hussain Reference Jeong and Hussain1995) in this work. This parameter is defined by the second invariant of the velocity gradient tensor where a positive value indicates that rotation dominates strain and shear. The
 $Q$
-criterion helps to distinguish vortices from shear layers in viscous wall-bounded flows. In figure 3, all three grids portray the same qualitative behaviour in the instantaneous flow structure. The coarse mesh exhibits a slight difference in the helical instability in front of the leading edge, which has both elongated and initiated slightly further upstream compared to the refined solutions. The form of helical instability and its interaction with the aerodynamic surface are generally indistinguishable between two higher levels of resolution, demonstrating that the flow physics of primary interest in this article is captured for both grids. The fine mesh resolves higher wavenumber content in the separated flow region on the inboard side of the vortex encounter in figure 3(c), as would be expected.
$Q$
-criterion helps to distinguish vortices from shear layers in viscous wall-bounded flows. In figure 3, all three grids portray the same qualitative behaviour in the instantaneous flow structure. The coarse mesh exhibits a slight difference in the helical instability in front of the leading edge, which has both elongated and initiated slightly further upstream compared to the refined solutions. The form of helical instability and its interaction with the aerodynamic surface are generally indistinguishable between two higher levels of resolution, demonstrating that the flow physics of primary interest in this article is captured for both grids. The fine mesh resolves higher wavenumber content in the separated flow region on the inboard side of the vortex encounter in figure 3(c), as would be expected.
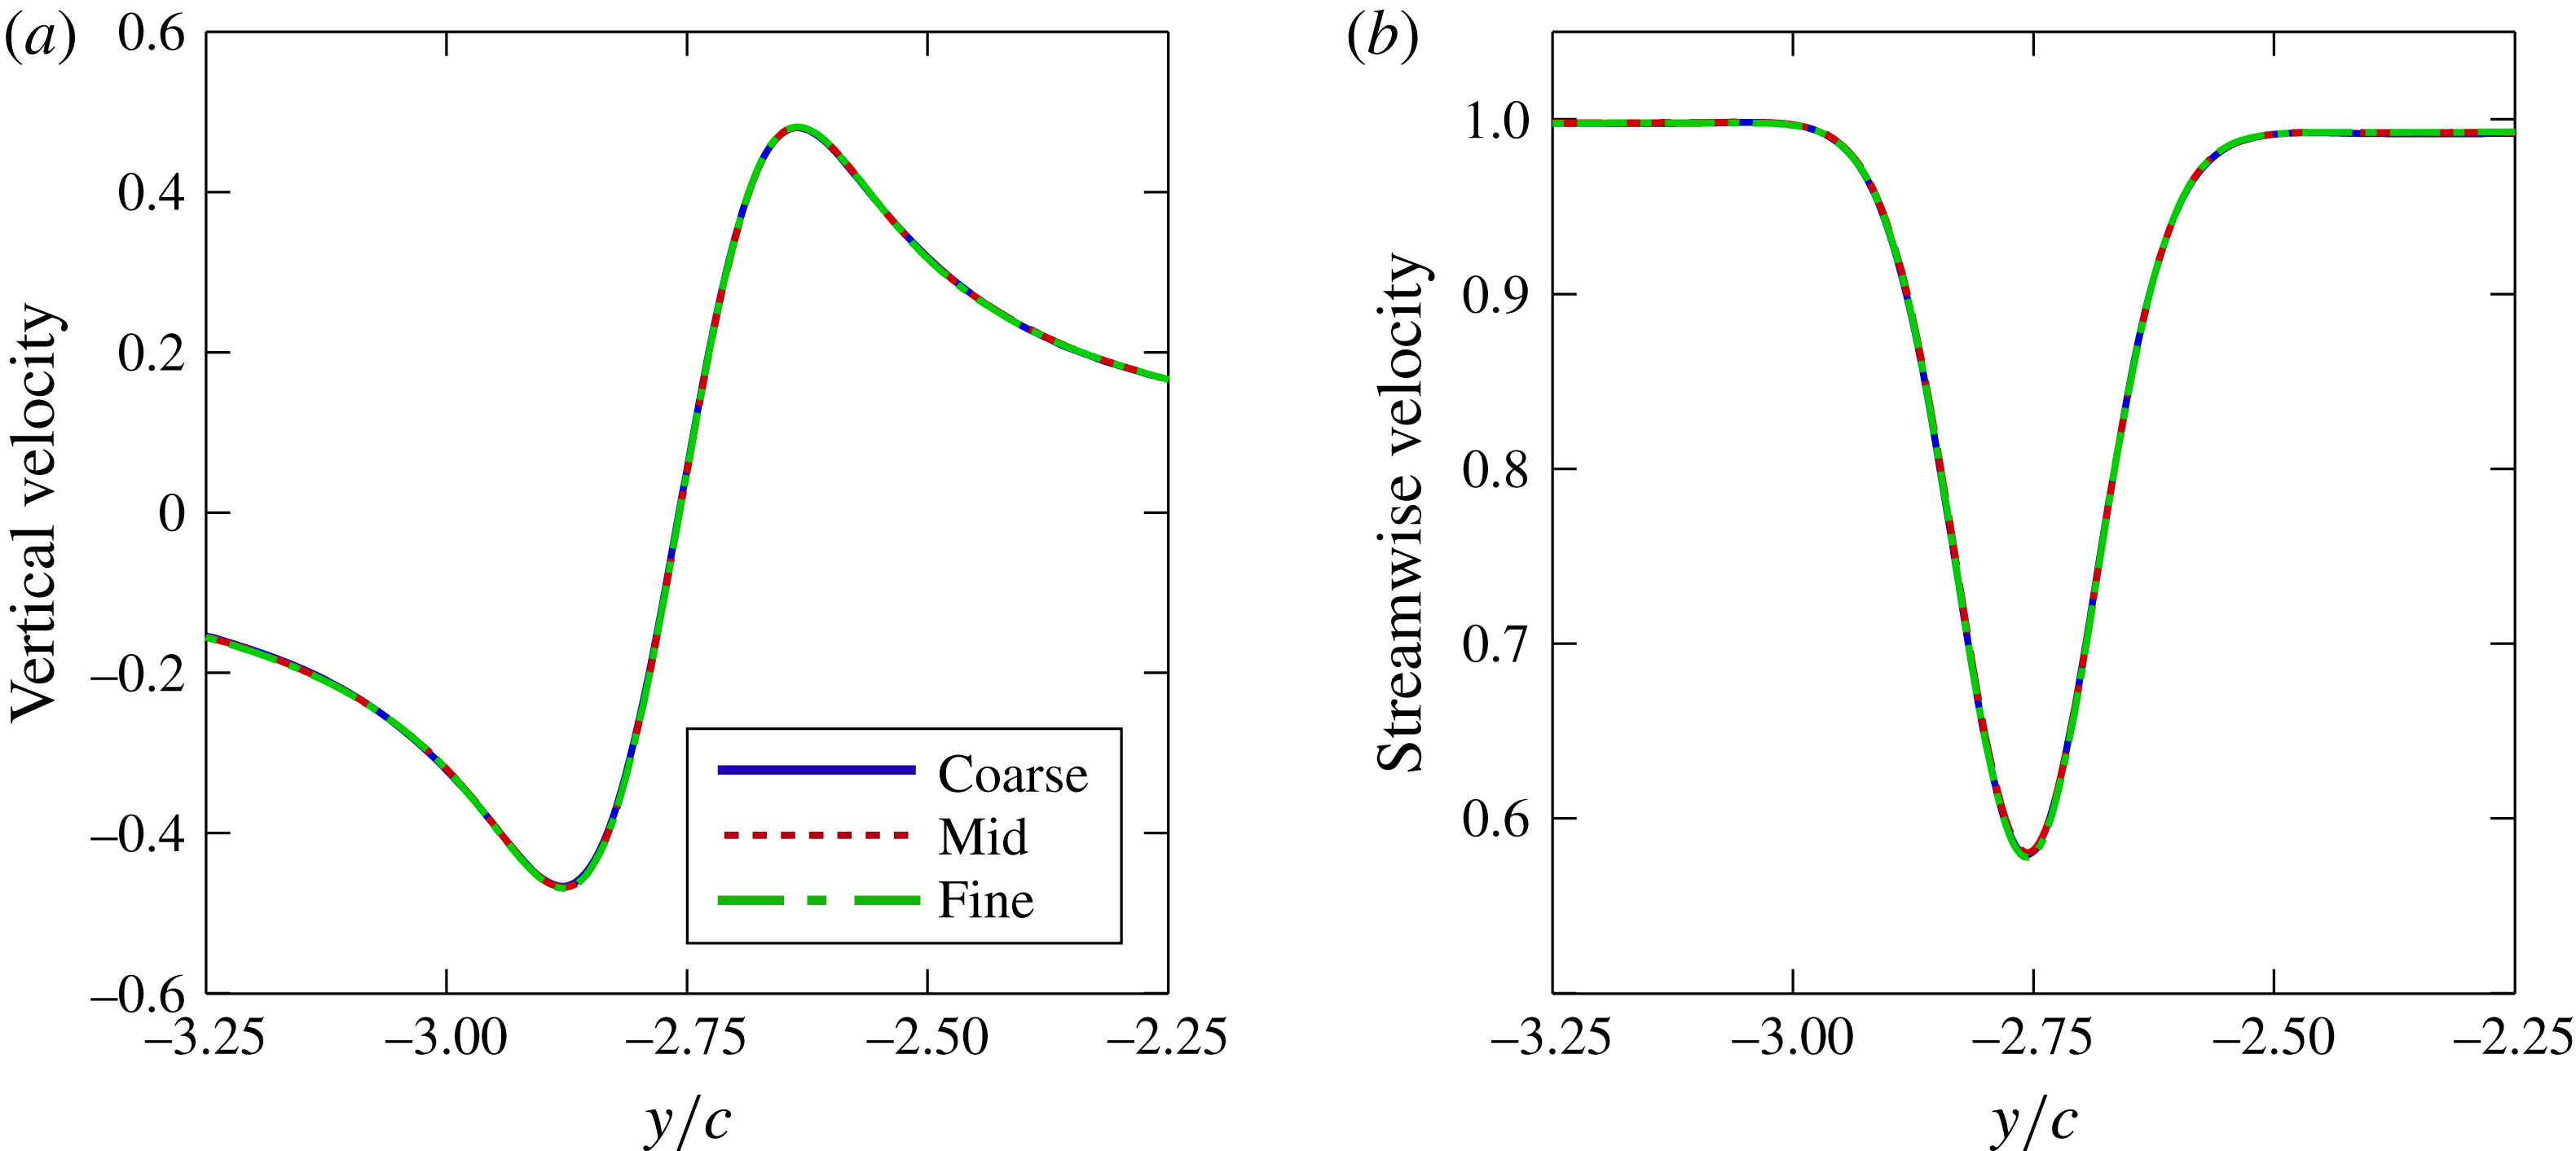
Figure 2. Effect of grid resolution on velocity profiles across the vortex core upstream of the leading edge (
 $x/c=-2.0$
); time-mean (a) vertical velocity and (b) streamwise velocity profiles.
$x/c=-2.0$
); time-mean (a) vertical velocity and (b) streamwise velocity profiles.

Figure 3. Effect of grid resolution on the unsteady flow structure using an iso-surface of
 $Q$
-criterion (
$Q$
-criterion (
 $Q=15$
) and coloured by pressure coefficient,
$Q=15$
) and coloured by pressure coefficient,
 $c_{p}$
.
$c_{p}$
.

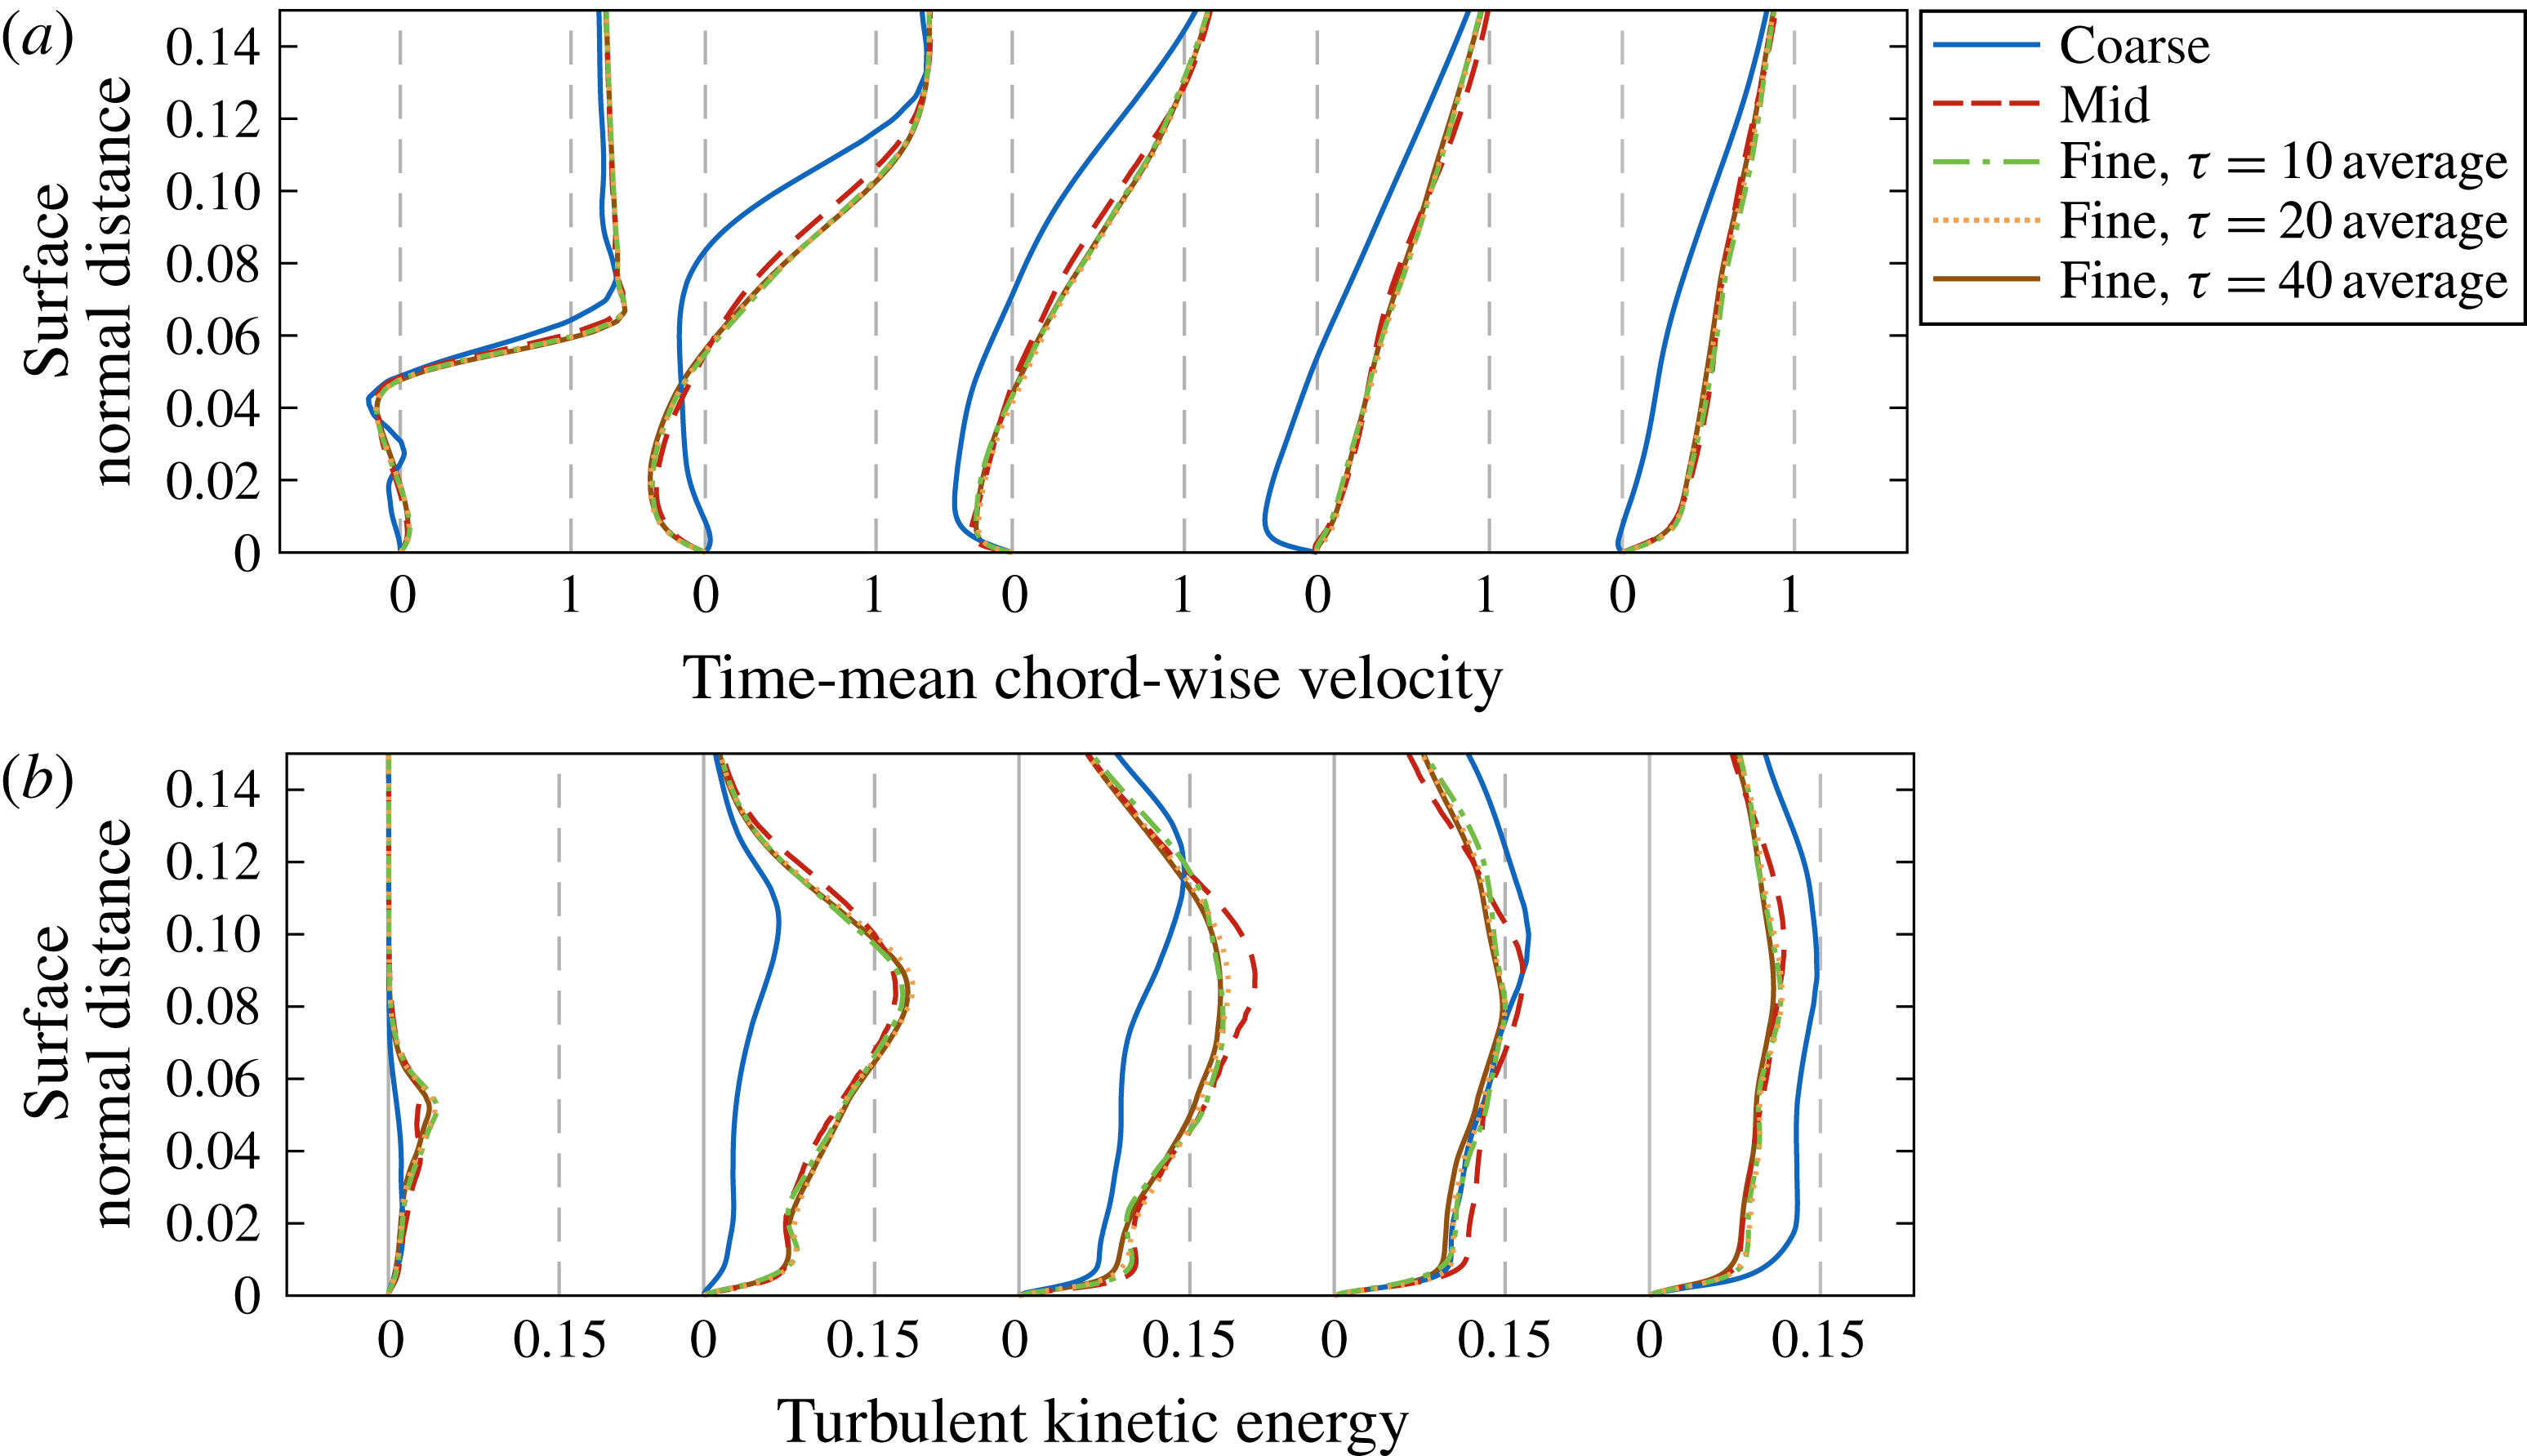
Figure 4. Effect of grid resolution and sample size at the suction-side midspan (
 $y/c=0$
) on (a) time-mean chordwise velocity profiles and (b) turbulent kinetic energy profiles. Profiles are extracted normal to the surface at several chordwise locations:
$y/c=0$
) on (a) time-mean chordwise velocity profiles and (b) turbulent kinetic energy profiles. Profiles are extracted normal to the surface at several chordwise locations:
 $x/c=0.1$
,
$x/c=0.1$
,
 $0.3$
,
$0.3$
,
 $0.5$
,
$0.5$
,
 $0.7$
and
$0.7$
and
 $0.9$
.
$0.9$
.
Further scrutiny is applied to the time-mean flow over the wing surface in figures 4–6 where time-mean velocity profiles and turbulent kinetic energy were extracted normal to the surface at several positions along the chord. Time-mean quantities are sampled over
 ${\it\tau}=10$
characteristic times for all cases presented in this article with the exception of the two additional time averages on the fine grid sampled over
${\it\tau}=10$
characteristic times for all cases presented in this article with the exception of the two additional time averages on the fine grid sampled over
 ${\it\tau}=20$
and
${\it\tau}=20$
and
 $40$
characteristic times for comparison here. Increasing the sample size from the baseline value provides minimal change to the solutions at all locations evaluated.
$40$
characteristic times for comparison here. Increasing the sample size from the baseline value provides minimal change to the solutions at all locations evaluated.
Figure 5. Effect of grid resolution and sample size inline with the vortex (
 $y/c=-2.75$
) on the suction side for time-mean (a) chordwise, (b) spanwise and (c) normal velocity profiles as well as (d) turbulent kinetic energy profiles. Profiles are extracted normal to the surface at several chordwise locations:
$y/c=-2.75$
) on the suction side for time-mean (a) chordwise, (b) spanwise and (c) normal velocity profiles as well as (d) turbulent kinetic energy profiles. Profiles are extracted normal to the surface at several chordwise locations:
 $x/c=0.1$
,
$x/c=0.1$
,
 $0.3$
,
$0.3$
,
 $0.5$
,
$0.5$
,
 $0.7$
and
$0.7$
and
 $0.9$
.
$0.9$
.
The effects of mesh density on suction-side chordwise velocity and turbulent kinetic energy profiles are presented first in figure 4(a,b), respectively. It should be noted that grid density is intentionally coarsest at the midspan as it is not a region of interest in the remainder of this article. However, evaluation of the flow properties at this location reveals the greatest disparity between levels of resolution in the entire flow domain and, therefore, provides a conservative analysis of the effects of grid resolution. Streamwise profiles for the coarse mesh, previously noted to be coarse for LES in terms of wall units, predict a larger separation region and delayed reattachment to the wing surface compared to the finer grids. Refinement to the medium and fine grids portrays a rapid asymptotic convergence of the velocity profiles, demonstrating that separation and reattachment is well captured for both cases. The turbulent kinetic energy profiles demonstrate a similar convergence with the greatest distinction between mid and fine grids emerging at
 $x/c=0.7$
, although a good collapse of the flow quantities prevails downstream.
$x/c=0.7$
, although a good collapse of the flow quantities prevails downstream.
Velocity and turbulent kinetic energy profiles were also extracted in line with the streamwise vortex along the suction side in figure 5, providing a better indication of the suitability of each mesh in the primary region of interest. Due to the inherently three-dimensional nature of the flow in this region, streamwise, spanwise and normal components of the velocity profile are shown in figure 5(a–c) respectively. Here, the coarsest mesh presents qualitatively the same behaviour as the finer grids in each direction due to the improved mesh density, while the mid and fine grids reveal a very good agreement at all streamwise locations. Greater distinction is found in the turbulent kinetic energy profiles in figure 5(d), as would be expected. Each case presents qualitatively the same behaviour with an asymptotic convergence between the two fine grids. Similar conclusions can be drawn for the pressure-side profiles provided in figure 6.
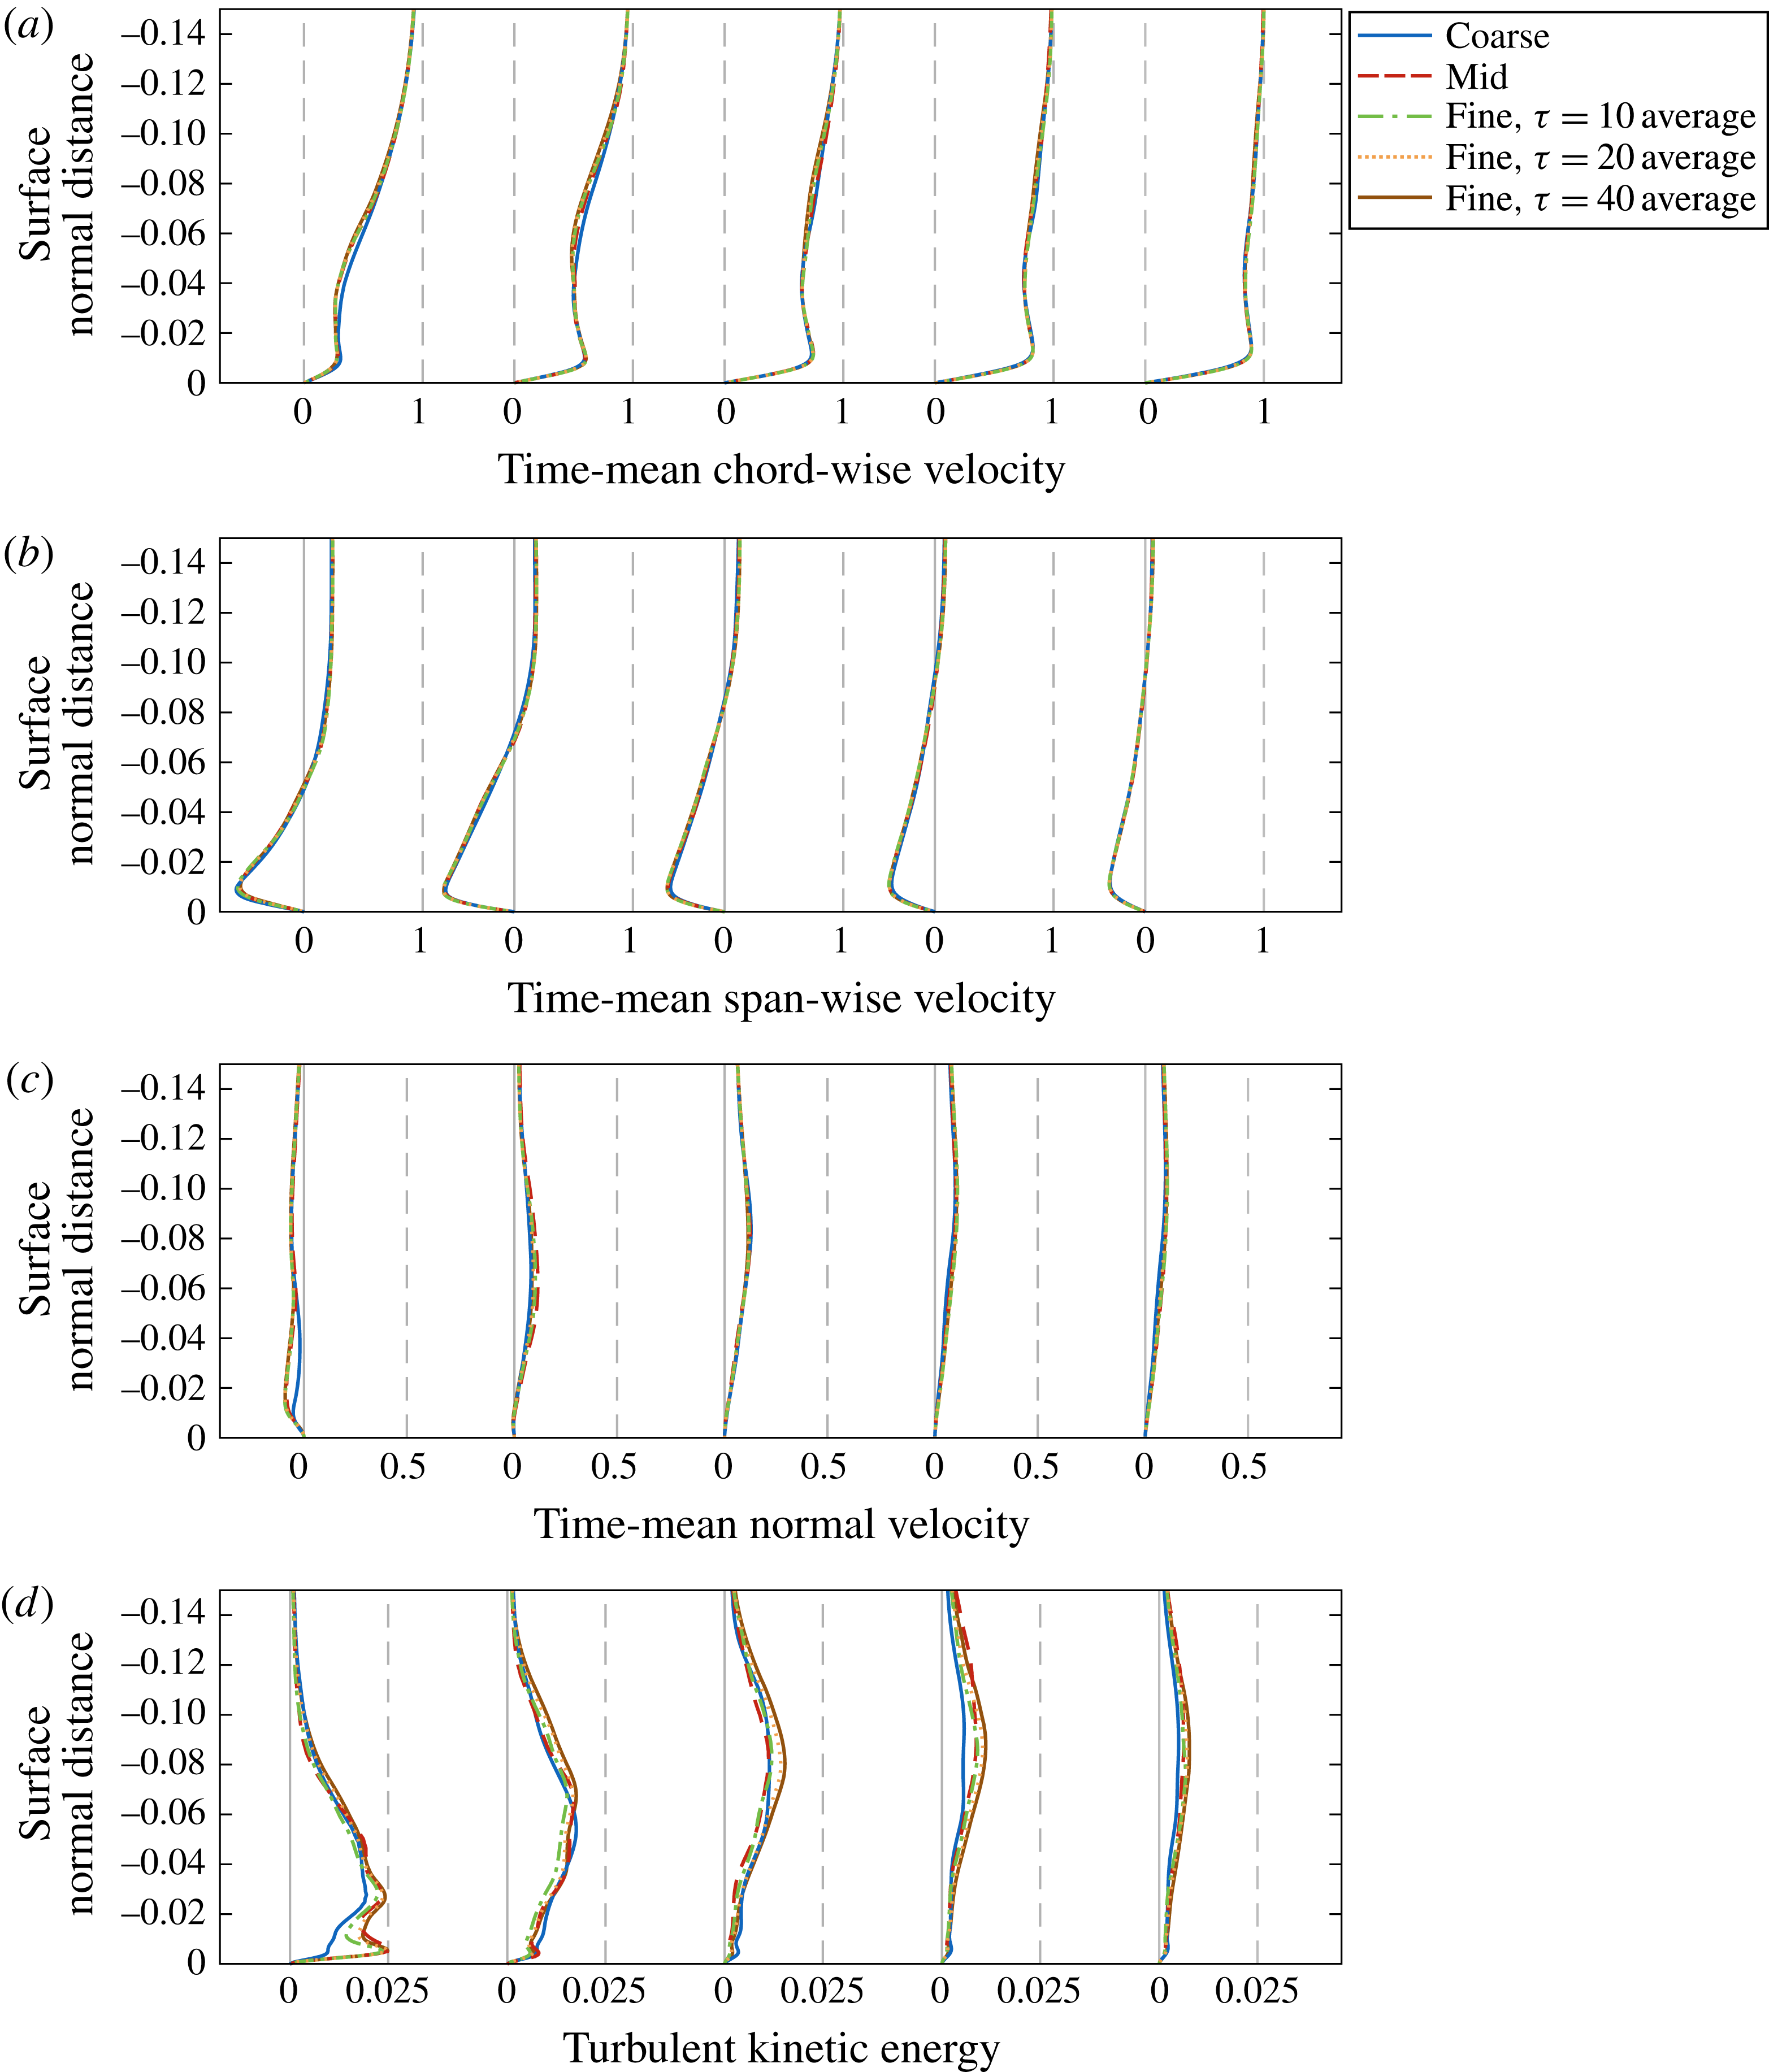
Figure 6. Effect of grid resolution and sample size near the the vortex (
 $y/c=-2.85$
) on the pressure side for time-mean (a) chordwise, (b) spanwise and (c) normal velocity profiles as well as (d) turbulent kinetic energy profiles. Profiles are extracted normal to the surface at several chordwise locations:
$y/c=-2.85$
) on the pressure side for time-mean (a) chordwise, (b) spanwise and (c) normal velocity profiles as well as (d) turbulent kinetic energy profiles. Profiles are extracted normal to the surface at several chordwise locations:
 $x/c=0.1$
,
$x/c=0.1$
,
 $0.3$
,
$0.3$
,
 $0.5$
,
$0.5$
,
 $0.7$
and
$0.7$
and
 $0.9$
.
$0.9$
.
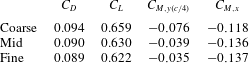
Finally, table 3 provides a comparison of the time-mean aerodynamic loads for each grid, where
 $C_{L}$
,
$C_{L}$
,
 $C_{D}$
,
$C_{D}$
,
 $C_{M,y(c/4)}$
and
$C_{M,y(c/4)}$
and
 $C_{M,x}$
describe the lift, drag, quarter-chord pitching moment and rolling moment respectively. Each of these values demonstrate significantly decreasing changes in all forces as resolution increases. Collapse of these integrated quantities between the two finer grids provides further confidence in the resolution of the present computations.
$C_{M,x}$
describe the lift, drag, quarter-chord pitching moment and rolling moment respectively. Each of these values demonstrate significantly decreasing changes in all forces as resolution increases. Collapse of these integrated quantities between the two finer grids provides further confidence in the resolution of the present computations.
Table 3. Time-mean aerodynamic loads.
5 Effect of vertical offset
This section explores the influence of several vertical positions of the incident vortex and aims to provide further understanding of the effect of vortex positioning on vortex–surface interactions. Each case employs the nominal radius of
 $r_{v}/c=0.1$
and axial velocity deficit of
$r_{v}/c=0.1$
and axial velocity deficit of
 ${\rm\Delta}u_{o}=0.4$
. While the parameter
${\rm\Delta}u_{o}=0.4$
. While the parameter
 ${\rm\Delta}z$
describes the initial vertical position of the incident vortex at the inflow boundary, it does not necessarily convey the actual position of the vortex when it reaches the wing. The vortex was found to deflect upward as it approaches the wing due to flow accelerating over the leading edge. In order to better define the vortex position, the actual vertical offset at
${\rm\Delta}z$
describes the initial vertical position of the incident vortex at the inflow boundary, it does not necessarily convey the actual position of the vortex when it reaches the wing. The vortex was found to deflect upward as it approaches the wing due to flow accelerating over the leading edge. In order to better define the vortex position, the actual vertical offset at
 $x/c=-0.5$
is defined as
$x/c=-0.5$
is defined as
 ${\rm\Delta}z_{v}$
in table 4. An initial vertical offset of
${\rm\Delta}z_{v}$
in table 4. An initial vertical offset of
 ${\rm\Delta}z/c=0$
results in a direct impingement with the leading edge, higher
${\rm\Delta}z/c=0$
results in a direct impingement with the leading edge, higher
 ${\rm\Delta}z$
place the vortex above the wing, and lower
${\rm\Delta}z$
place the vortex above the wing, and lower
 ${\rm\Delta}z$
place it beneath the wing. While a total of six vertical positions (
${\rm\Delta}z$
place it beneath the wing. While a total of six vertical positions (
 ${\rm\Delta}z/c=-0.25$
,
${\rm\Delta}z/c=-0.25$
,
 $-0.10$
,
$-0.10$
,
 $-0.05$
,
$-0.05$
,
 $0.00$
,
$0.00$
,
 $0.05$
and
$0.05$
and
 $0.10$
) were explored for the present analysis, the discussion focuses on the three cases of
$0.10$
) were explored for the present analysis, the discussion focuses on the three cases of
 ${\rm\Delta}z/c=-0.10$
,
${\rm\Delta}z/c=-0.10$
,
 $0.00$
and
$0.00$
and
 $0.10$
which represent most clearly the primary variations in flow structure. An identical wing without the incident vortex is included in the discussion as a point of reference. These cases are descriptively referred to as negative offset, direct impingement, positive offset and no vortex, respectively, throughout this article.
$0.10$
which represent most clearly the primary variations in flow structure. An identical wing without the incident vortex is included in the discussion as a point of reference. These cases are descriptively referred to as negative offset, direct impingement, positive offset and no vortex, respectively, throughout this article.
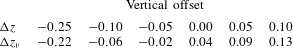
Table 4. Initial and actual vertical offsets measured at
 $x/c=-0.5$
.
$x/c=-0.5$
.
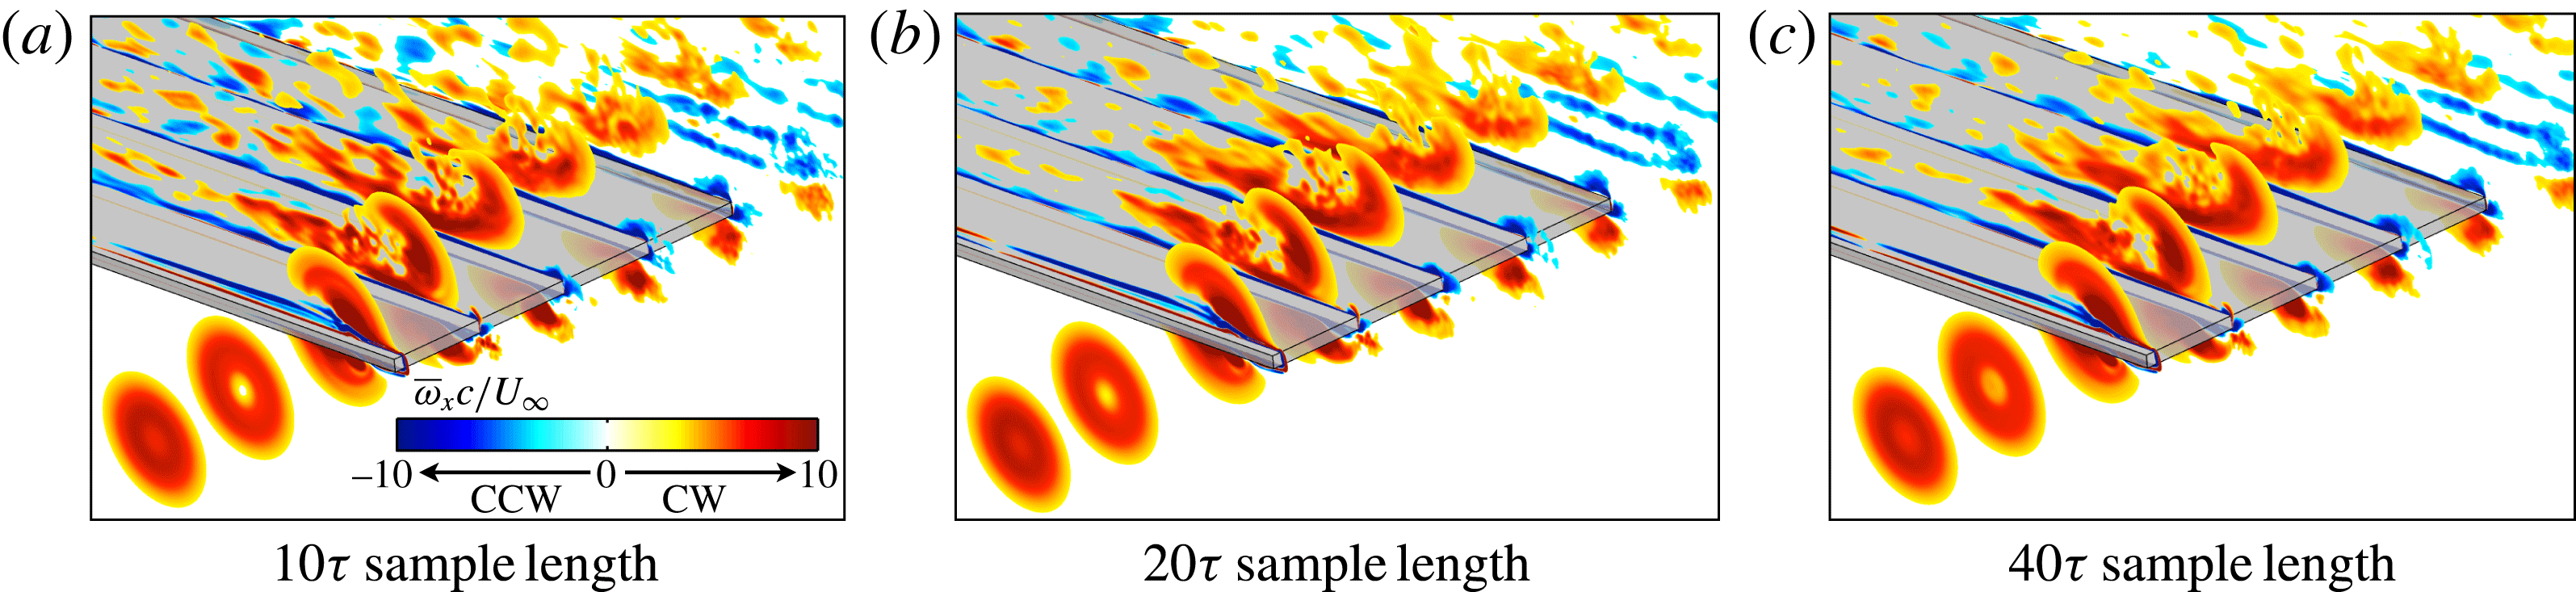
5.1 Time-mean flow structure
The time-mean three-dimensional flow structure related to the vortex interaction is well portrayed using contours of time-mean streamwise vorticity at several chord-wise planes in figure 7. It should be noted that the sample size is insufficient to completely filter out the fine-scale features from the streamwise vorticity contours in some regions of the flow. This is most evident inboard of the vortex on the suction side where the remnants of the complex non-dominant features in the separated transitional flow are still visible. The effect of the sample length on the time-mean streamwise vorticity is portrayed in figure 8 for the
 ${\rm\Delta}z/c=0$
case. While a time-average using four times the sample size smooths out some of these features, the dominant flow characteristics are unaffected.
${\rm\Delta}z/c=0$
case. While a time-average using four times the sample size smooths out some of these features, the dominant flow characteristics are unaffected.

Figure 7. Slices of time-averaged streamwise vorticity at several chord-wise positions (
 $x/c=-0.5,-0.25,0.01,0.25,0.50,0.75,1.00,1.25,1.50$
). The wing is semi-transparent to provide visualization of pressure-side flow structure.
$x/c=-0.5,-0.25,0.01,0.25,0.50,0.75,1.00,1.25,1.50$
). The wing is semi-transparent to provide visualization of pressure-side flow structure.

Figure 8. Effect of sample size on streamwise vorticity contours for
 ${\rm\Delta}z/c=0$
using sample sizes of (a)
${\rm\Delta}z/c=0$
using sample sizes of (a)
 $10{\it\tau}$
, (b)
$10{\it\tau}$
, (b)
 $20{\it\tau}$
and (c)
$20{\it\tau}$
and (c)
 $40{\it\tau}$
.
$40{\it\tau}$
.
Beginning with the direct-impingement (
 ${\rm\Delta}z/c=0$
) case provided in figure 7(c), the time-mean incident vortex is shown to develop a region of diminished streamwise vorticity along its axis upstream of the wing,
${\rm\Delta}z/c=0$
) case provided in figure 7(c), the time-mean incident vortex is shown to develop a region of diminished streamwise vorticity along its axis upstream of the wing,
 $x/c=-0.25$
. This annular concentration of streamwise vorticity is due to the motion of an unstable laminar vortex and will become more apparent in § 5.2. As the vortex impinges upon the leading edge,
$x/c=-0.25$
. This annular concentration of streamwise vorticity is due to the motion of an unstable laminar vortex and will become more apparent in § 5.2. As the vortex impinges upon the leading edge,
 $x/c=0.01$
, it splits in a time-mean sense into the upper- and lower-surface components shown in figure 7(c). The pressure-side component tends outboard as it propagates downstream consistent with mutual induction between the incident vortex and its mirror-image in the wing surface (Saffman Reference Saffman1992). The suction-side component moves slightly inboard as it advances toward the trailing edge. This time-mean split results from the incident vortex alternating between the upper and lower surfaces in the instantaneous flow. Garmann & Visbal (Reference Garmann and Visbal2015a
) describe the unsteady cut-and-reconnect process of a similar unsteady feature that occurs at a lower Reynolds number and angle of attack in which instability is less pronounced.
$x/c=0.01$
, it splits in a time-mean sense into the upper- and lower-surface components shown in figure 7(c). The pressure-side component tends outboard as it propagates downstream consistent with mutual induction between the incident vortex and its mirror-image in the wing surface (Saffman Reference Saffman1992). The suction-side component moves slightly inboard as it advances toward the trailing edge. This time-mean split results from the incident vortex alternating between the upper and lower surfaces in the instantaneous flow. Garmann & Visbal (Reference Garmann and Visbal2015a
) describe the unsteady cut-and-reconnect process of a similar unsteady feature that occurs at a lower Reynolds number and angle of attack in which instability is less pronounced.
For the
 ${\rm\Delta}z/c=-0.10$
offset, figure 7(b), the streamwise vorticity contours reveal a similar ‘hollow’ core but further upstream (
${\rm\Delta}z/c=-0.10$
offset, figure 7(b), the streamwise vorticity contours reveal a similar ‘hollow’ core but further upstream (
 $x/c=-0.5$
) than the
$x/c=-0.5$
) than the
 ${\rm\Delta}z/c=0$
case. As the vortex approaches the leading edge, the streamwise vorticity develops a more complex topology where a weaker inner ring of streamwise vorticity, denoted in figure 7(b) at
${\rm\Delta}z/c=0$
case. As the vortex approaches the leading edge, the streamwise vorticity develops a more complex topology where a weaker inner ring of streamwise vorticity, denoted in figure 7(b) at
 $x/c=-0.25$
, is visible. Beneath the wing, the predominant lower-surface component of the incident vortex becomes distorted,
$x/c=-0.25$
, is visible. Beneath the wing, the predominant lower-surface component of the incident vortex becomes distorted,
 $x/c=0.01-1.0$
, as the flow transitions to instability from a stable laminar vortex, which will become apparent in the instantaneous flow field described later. As in the previous case, the lower-surface component of the swirling flow tends outboard as it propagates downstream.
$x/c=0.01-1.0$
, as the flow transitions to instability from a stable laminar vortex, which will become apparent in the instantaneous flow field described later. As in the previous case, the lower-surface component of the swirling flow tends outboard as it propagates downstream.
Placing the vortex above the wing (
 ${\rm\Delta}z/c=+0.1$
) in figure 7(d) fails to elicit any remarkable change in the vorticity contours in the incident vortex as it approaches and then passes over the leading edge. Above the wing, the time-mean flow reveals an eruption of secondary vorticity at
${\rm\Delta}z/c=+0.1$
) in figure 7(d) fails to elicit any remarkable change in the vorticity contours in the incident vortex as it approaches and then passes over the leading edge. Above the wing, the time-mean flow reveals an eruption of secondary vorticity at
 $x/c=0.25$
unique to the positive vertical offset cases and a more coherent upper-surface component than its counterpart in the
$x/c=0.25$
unique to the positive vertical offset cases and a more coherent upper-surface component than its counterpart in the
 ${\rm\Delta}z/c=0$
case.
${\rm\Delta}z/c=0$
case.
Contours of time-mean streamwise velocity are shown for a spanwise plane intersecting the incident vortex core in figure 9(a) and demonstrate several characteristic changes to axial velocity profiles in each vortex–wing interaction. The direct impingement case (
 ${\rm\Delta}z/c=0$
) produces a large streamwise velocity deficit as the vortex approaches the leading edge. This diminished flow speed becomes much more severe when the vortex is placed beneath the wing in the
${\rm\Delta}z/c=0$
) produces a large streamwise velocity deficit as the vortex approaches the leading edge. This diminished flow speed becomes much more severe when the vortex is placed beneath the wing in the
 ${\rm\Delta}z/c=-0.1$
case. When the vortex is above the wing,
${\rm\Delta}z/c=-0.1$
case. When the vortex is above the wing,
 ${\rm\Delta}z/c=+0.1$
, the axial velocity accelerates with flow over the leading edge, alleviating the velocity deficit near the leading edge.
${\rm\Delta}z/c=+0.1$
, the axial velocity accelerates with flow over the leading edge, alleviating the velocity deficit near the leading edge.
Figure 9(b) shows contours of the time-mean pressure gradient,
 $\partial \overline{p}/\partial x$
, on a spanwise plane intersecting the vortex core. For the
$\partial \overline{p}/\partial x$
, on a spanwise plane intersecting the vortex core. For the
 ${\rm\Delta}z/c=0$
case, the incident vortex is subjected to an adverse streamwise pressure gradient associated with stagnation of flow against the leading edge. The influence of the vortex–surface interaction is felt upstream of the leading edge and manifests in the form of increasing pressure which would tend to decelerate the streamwise flow. For the
${\rm\Delta}z/c=0$
case, the incident vortex is subjected to an adverse streamwise pressure gradient associated with stagnation of flow against the leading edge. The influence of the vortex–surface interaction is felt upstream of the leading edge and manifests in the form of increasing pressure which would tend to decelerate the streamwise flow. For the
 ${\rm\Delta}z/c=-0.1$
case, the pressure gradient induced by stagnation at the leading edge is diminished compared to the
${\rm\Delta}z/c=-0.1$
case, the pressure gradient induced by stagnation at the leading edge is diminished compared to the
 ${\rm\Delta}z/c=0$
case, but results in an adverse gradient beneath the lower surface contrary to the favourable pressure gradient found on the pressure side of the no-vortex and
${\rm\Delta}z/c=0$
case, but results in an adverse gradient beneath the lower surface contrary to the favourable pressure gradient found on the pressure side of the no-vortex and
 ${\rm\Delta}z/c=+0.1$
cases. In contrast, the
${\rm\Delta}z/c=+0.1$
cases. In contrast, the
 ${\rm\Delta}z/c=+0.1$
case shows the streamwise vortex permeating into a favourable
${\rm\Delta}z/c=+0.1$
case shows the streamwise vortex permeating into a favourable
 $\partial \overline{p}/\partial x$
above the wing responsible for accelerating the core velocity of the incident vortex. Above the wing, the
$\partial \overline{p}/\partial x$
above the wing responsible for accelerating the core velocity of the incident vortex. Above the wing, the
 ${\rm\Delta}z/c=+0.1$
case vortex is subjected to a large adverse
${\rm\Delta}z/c=+0.1$
case vortex is subjected to a large adverse
 $\partial \overline{p}/\partial x$
in the separated flow region near the mid-chord. This results in a significantly diminished axial velocity in the vortex core shown in figure 9(a) beyond the mid-chord. These pressure gradient regimes characterize the effect of vertical position on the vortex–wing interaction and play a critical role in the unsteady behaviour of the incident vortex addressed next.
$\partial \overline{p}/\partial x$
in the separated flow region near the mid-chord. This results in a significantly diminished axial velocity in the vortex core shown in figure 9(a) beyond the mid-chord. These pressure gradient regimes characterize the effect of vertical position on the vortex–wing interaction and play a critical role in the unsteady behaviour of the incident vortex addressed next.
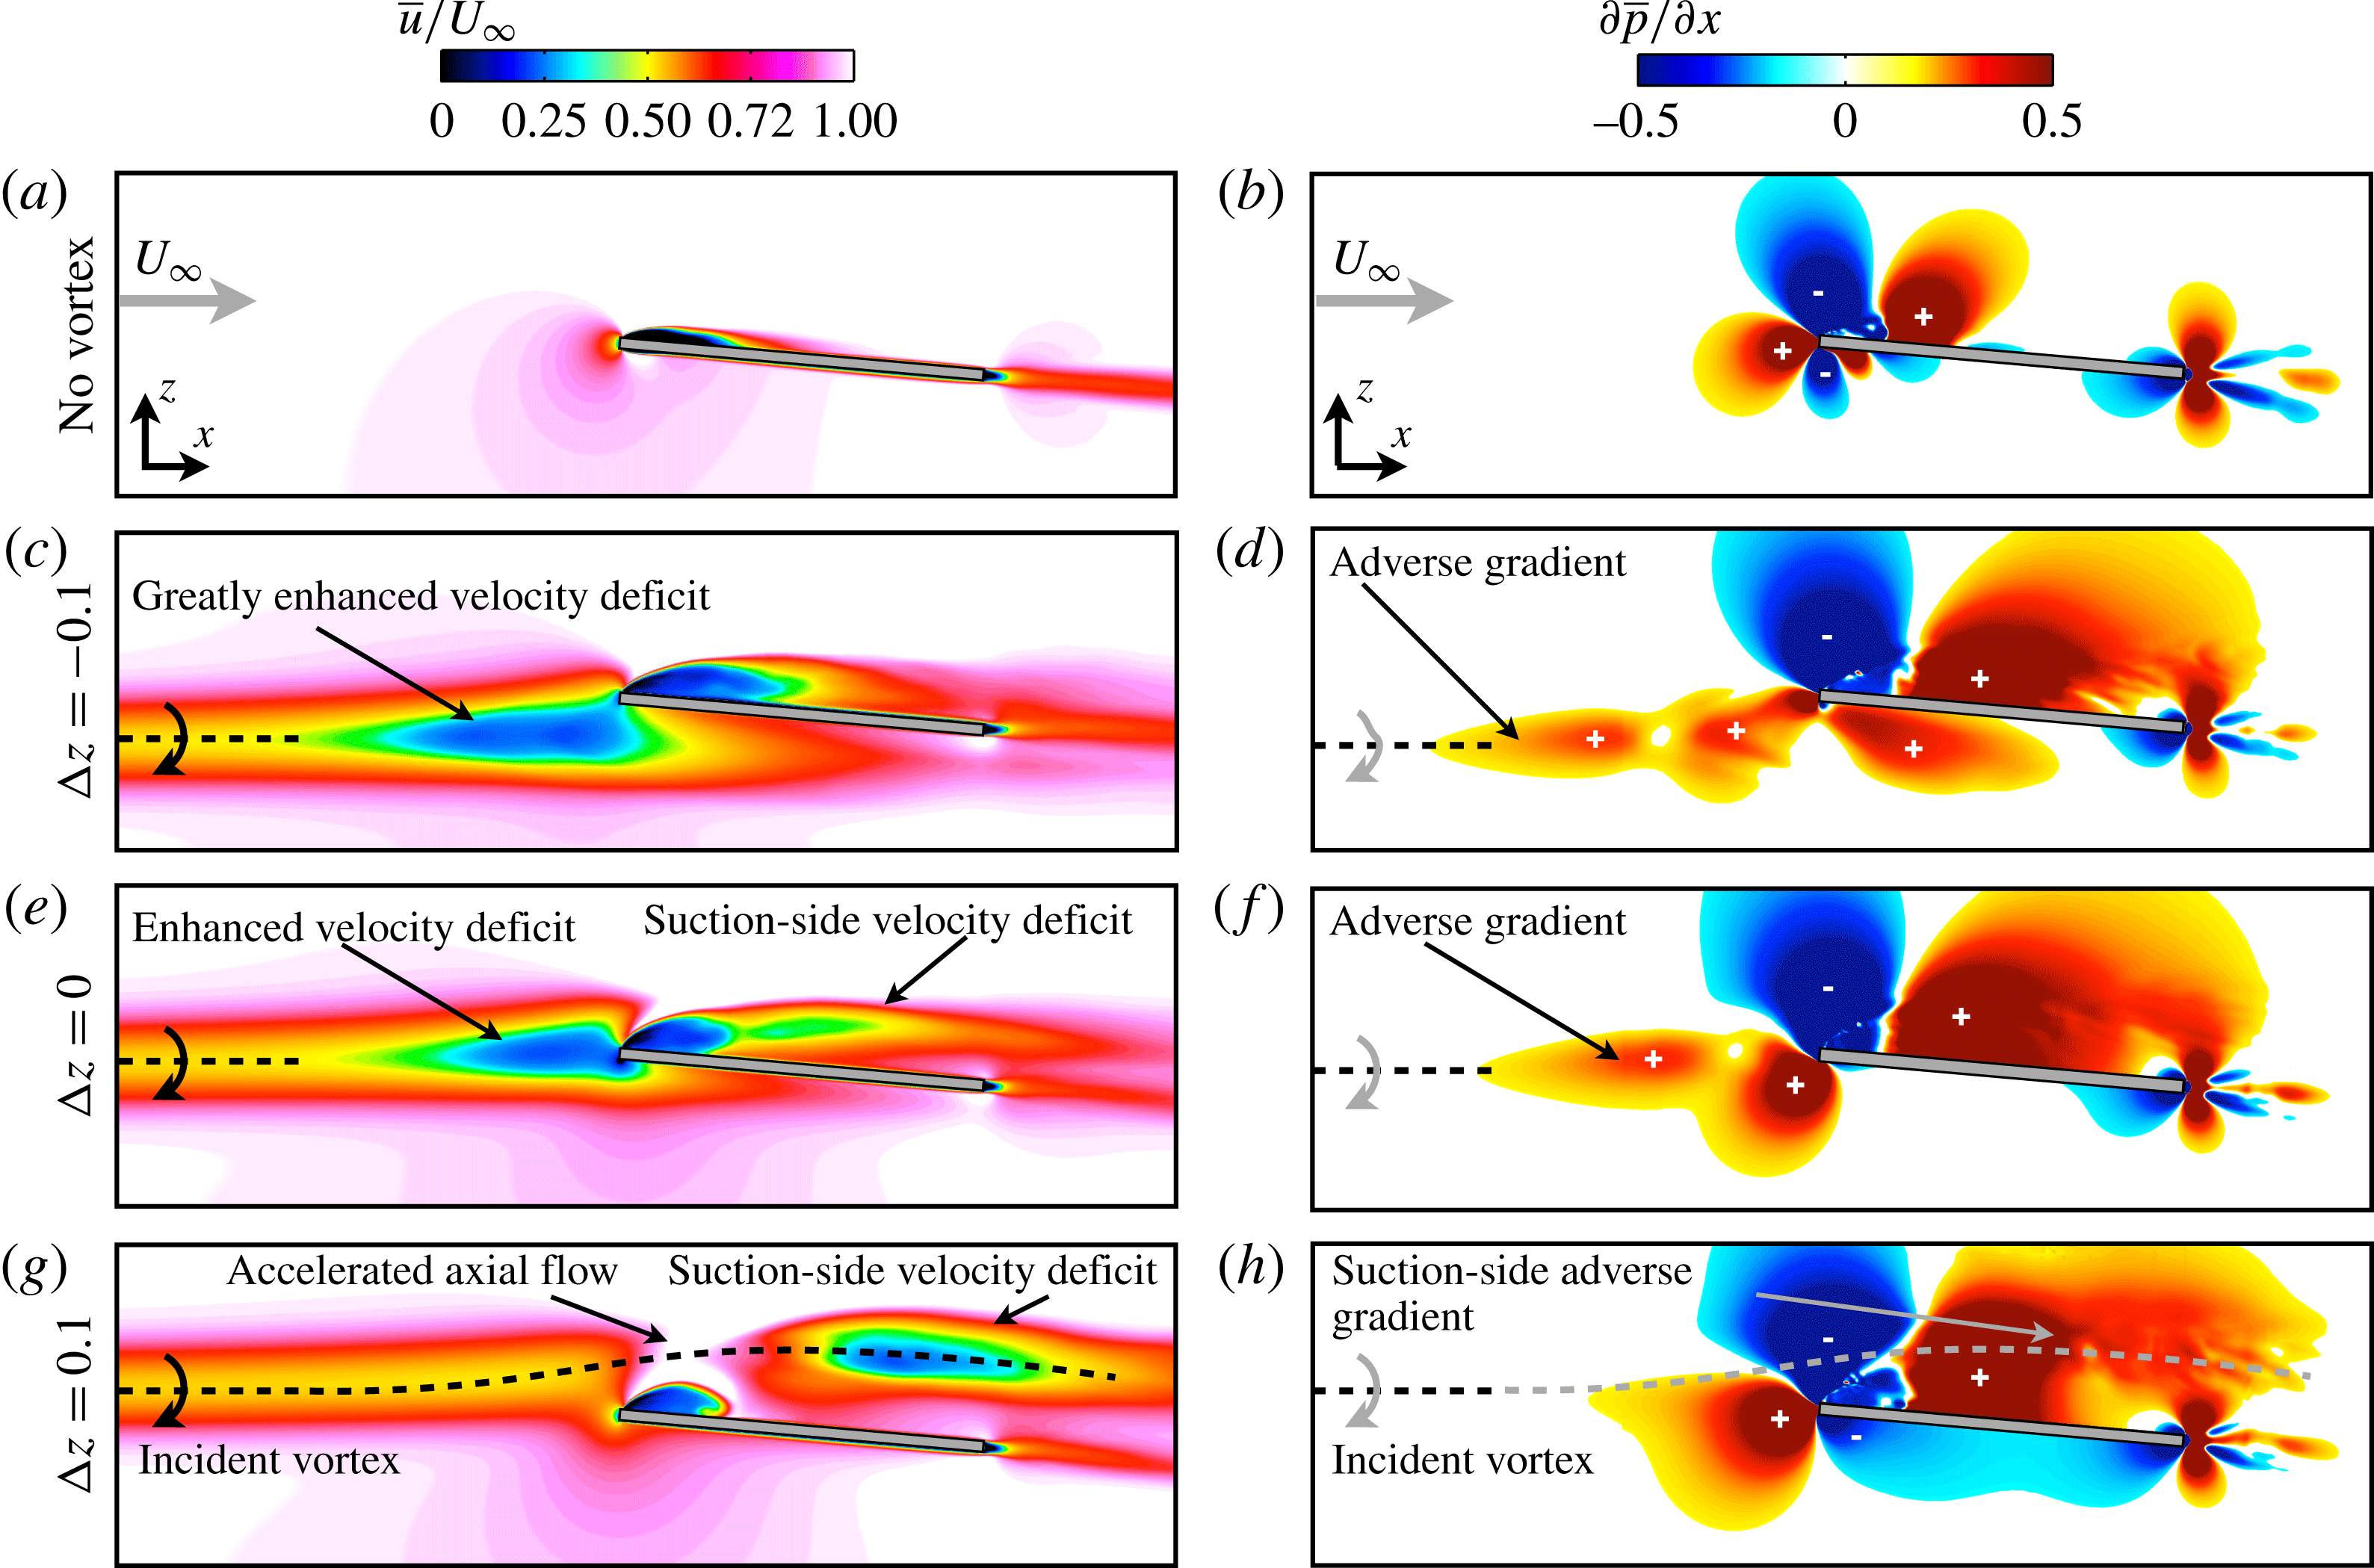
Figure 9. Contours of time-mean (a) streamwise velocity at
 $y/c=-2.75$
and (b) streamwise pressure gradient at
$y/c=-2.75$
and (b) streamwise pressure gradient at
 $y/c=-2.75$
where ‘
$y/c=-2.75$
where ‘
 $+$
’ and ‘
$+$
’ and ‘
 $-$
’ denote adverse and favourable pressure-gradient regions, respectively.
$-$
’ denote adverse and favourable pressure-gradient regions, respectively.

Figure 10. Slices of turbulent kinetic energy (
 $k$
) at several chord-wise positions (
$k$
) at several chord-wise positions (
 $x/c=-0.50,-0.25,-0.10,0.01,0.10,0.25,0.50,0.75,1.00,1.25,1.50,1.75$
) and transparent iso-surface of time-mean
$x/c=-0.50,-0.25,-0.10,0.01,0.10,0.25,0.50,0.75,1.00,1.25,1.50,1.75$
) and transparent iso-surface of time-mean
 $Q$
-criterion (
$Q$
-criterion (
 $Q=5$
). The wing is semi-transparent.
$Q=5$
). The wing is semi-transparent.
5.2 Unsteady flow structure
Figure 10 shows slices of the turbulent kinetic energy (
 $k=1/2\overline{u_{i}^{\prime }u_{i}^{\prime }}$
) contours at several streamwise positions for three vertical offsets and the isolated wing. A transparent iso-surface of time-mean
$k=1/2\overline{u_{i}^{\prime }u_{i}^{\prime }}$
) contours at several streamwise positions for three vertical offsets and the isolated wing. A transparent iso-surface of time-mean
 $Q$
-criterion is superimposed to provide reference between regions of high
$Q$
-criterion is superimposed to provide reference between regions of high
 $k$
and the location of dominant vortical structures. Turbulent kinetic energy is a measure of the level of fluctuations from the time-mean flow in transitional and turbulent regions and also reveals instabilities in the laminar flow. Both the
$k$
and the location of dominant vortical structures. Turbulent kinetic energy is a measure of the level of fluctuations from the time-mean flow in transitional and turbulent regions and also reveals instabilities in the laminar flow. Both the
 ${\rm\Delta}z/c=-0.1$
and
${\rm\Delta}z/c=-0.1$
and
 $0$
cases portray elevated turbulent kinetic energy within the incident vortex in front of the wing, demonstrating an unsteady response to the upstream influence provided by the aerodynamic surface. Fluctuations appear earlier for the
$0$
cases portray elevated turbulent kinetic energy within the incident vortex in front of the wing, demonstrating an unsteady response to the upstream influence provided by the aerodynamic surface. Fluctuations appear earlier for the
 ${\rm\Delta}z/c=-0.1$
case, which experiences a more pronounced upstream response. Turbulent kinetic energy is notably absent upstream of the wing for the
${\rm\Delta}z/c=-0.1$
case, which experiences a more pronounced upstream response. Turbulent kinetic energy is notably absent upstream of the wing for the
 ${\rm\Delta}z/c=+0.1$
case, showing that flow instability in the incident vortex is mitigated for this vertical position.
${\rm\Delta}z/c=+0.1$
case, showing that flow instability in the incident vortex is mitigated for this vertical position.
Above the wing, all three vortex interaction cases demonstrate an elevated region of turbulent kinetic energy in the separated region inboard of the vortex encounter compared to the isolated wing. This behaviour is consistent with enhanced separation due to an increased effective angle of attack provided by the upwash side of the incident vortex. While the suction-side contours of
 $k$
are qualitatively similar for the
$k$
are qualitatively similar for the
 ${\rm\Delta}z/c=-0.1$
and
${\rm\Delta}z/c=-0.1$
and
 $0$
cases, the positive offset (
$0$
cases, the positive offset (
 ${\rm\Delta}z/c=+0.1$
) elicits several notable differences. Near the leading edge,
${\rm\Delta}z/c=+0.1$
) elicits several notable differences. Near the leading edge,
 $x/c=0.25$
, high levels of turbulent kinetic energy appear within the shear layer of the separated flow. Further downstream, the incident streamwise vortex begins to show signs of instability. This appears first at
$x/c=0.25$
, high levels of turbulent kinetic energy appear within the shear layer of the separated flow. Further downstream, the incident streamwise vortex begins to show signs of instability. This appears first at
 $x/c=0.5$
as a protrusion of turbulent kinetic energy into the vortex from the separated region. Here, the stable, laminar vortex has become receptive to disturbances provided by its juxtaposition with the separated flow region. Toward the trailing edge,
$x/c=0.5$
as a protrusion of turbulent kinetic energy into the vortex from the separated region. Here, the stable, laminar vortex has become receptive to disturbances provided by its juxtaposition with the separated flow region. Toward the trailing edge,
 $x/c=0.75$
, relatively weaker levels of kinetic energy fluctuations envelope the streamwise vortex indicating flow instability has permeated the entirety of the swirling flow region.
$x/c=0.75$
, relatively weaker levels of kinetic energy fluctuations envelope the streamwise vortex indicating flow instability has permeated the entirety of the swirling flow region.
A notable differentiation in turbulent kinetic energy contours appears in the pressure-side flow structure. The lower component of the direct-impingement (
 ${\rm\Delta}z/c=0$
) vortex shows growing levels of turbulent kinetic energy beneath the wing as a consequence of its close interaction with the pressure-side surface. The negative vertical offset (
${\rm\Delta}z/c=0$
) vortex shows growing levels of turbulent kinetic energy beneath the wing as a consequence of its close interaction with the pressure-side surface. The negative vertical offset (
 ${\rm\Delta}z/c=-0.1$
) elicits a similar behaviour, but is significantly more pronounced, indicating a highly unsteady flow field for this case. The
${\rm\Delta}z/c=-0.1$
) elicits a similar behaviour, but is significantly more pronounced, indicating a highly unsteady flow field for this case. The
 ${\rm\Delta}z/c=+0.1$
case generates comparatively little turbulent kinetic energy beneath the wing with only a small region near the wingtip due to downwash-induced flow separation on the outboard side of the incident vortex.
${\rm\Delta}z/c=+0.1$
case generates comparatively little turbulent kinetic energy beneath the wing with only a small region near the wingtip due to downwash-induced flow separation on the outboard side of the incident vortex.

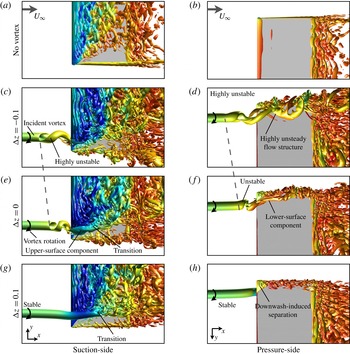
Figure 11. An iso-surface of instantaneous
 $Q$
-criterion (
$Q$
-criterion (
 $Q=15$
) for (a) top and (h) bottom views of the isolated wing and several vertical positions. A dashed line roughly locates the onset of instability.
$Q=15$
) for (a) top and (h) bottom views of the isolated wing and several vertical positions. A dashed line roughly locates the onset of instability.
The instantaneous flow structure more clearly demonstrates the main effects of vertical positioning. A movie of an iso-surface of instantaneous
 $Q$
-criterion for all vertical offsets considered is available in the supporting media for this article http://dx.doi.org/10.1017/jfm.2016.320. Snapshots from this instantaneous flow are provided here for three vertical positions and the isolated wing in figure 11. Starting with a top view of the direct-impingement case (
$Q$
-criterion for all vertical offsets considered is available in the supporting media for this article http://dx.doi.org/10.1017/jfm.2016.320. Snapshots from this instantaneous flow are provided here for three vertical positions and the isolated wing in figure 11. Starting with a top view of the direct-impingement case (
 ${\rm\Delta}z/c=0$
) in figure 11(e), the most notable feature is a helical instability that develops just upstream of the leading edge, which spirals in a sense opposite to the rotation of the incident vortex. The presence of this unsteady flow disturbance is consistent with the observations of Garmann & Visbal (Reference Garmann and Visbal2015a
) for an inboard vortex position but is much more pronounced in the current work as a consequence of the higher Reynolds number and angle of attack. This spiralling behaviour accounts for the annular concentration of time-mean streamwise vorticity upstream of the wing in figure 7 and turbulent kinetic energy in figure 10. Additionally, it allows the unsteady helix to alternate between the upper and lower sides of the wing, contributing to both the suction- (figure 11
e) and pressure-side (figure 11
f) vortical components that appear in the time-mean flow (figure 7
c).
${\rm\Delta}z/c=0$
) in figure 11(e), the most notable feature is a helical instability that develops just upstream of the leading edge, which spirals in a sense opposite to the rotation of the incident vortex. The presence of this unsteady flow disturbance is consistent with the observations of Garmann & Visbal (Reference Garmann and Visbal2015a
) for an inboard vortex position but is much more pronounced in the current work as a consequence of the higher Reynolds number and angle of attack. This spiralling behaviour accounts for the annular concentration of time-mean streamwise vorticity upstream of the wing in figure 7 and turbulent kinetic energy in figure 10. Additionally, it allows the unsteady helix to alternate between the upper and lower sides of the wing, contributing to both the suction- (figure 11
e) and pressure-side (figure 11
f) vortical components that appear in the time-mean flow (figure 7
c).
Figure 11(c,d) shows the instantaneous flow for the
 ${\rm\Delta}z/c=-0.10$
case. This negative vertical offset causes the unsteady helix to advance further upstream and become more pronounced than the direct impingement case. The suction-side component of the incident vortex, shown in figure 11(c), has diminished due to the vertical shift in position which allows the vortex to pass primarily along the lower surface. Figure 11(d) depicts the flow structure of the incident vortex as it passes beneath the wing. At this point the vortex maintains a spiralling motion, but has become very chaotic as it interacts with the lower surface, exhibiting large amplitude fluctuations in the local flow field. While a direct impingement elicits an unsteady behaviour upstream, a small vertical shift in the position generates a highly unsteady flow on the pressure side, accounting for the contours of high turbulent kinetic energy in figure 10(b).
${\rm\Delta}z/c=-0.10$
case. This negative vertical offset causes the unsteady helix to advance further upstream and become more pronounced than the direct impingement case. The suction-side component of the incident vortex, shown in figure 11(c), has diminished due to the vertical shift in position which allows the vortex to pass primarily along the lower surface. Figure 11(d) depicts the flow structure of the incident vortex as it passes beneath the wing. At this point the vortex maintains a spiralling motion, but has become very chaotic as it interacts with the lower surface, exhibiting large amplitude fluctuations in the local flow field. While a direct impingement elicits an unsteady behaviour upstream, a small vertical shift in the position generates a highly unsteady flow on the pressure side, accounting for the contours of high turbulent kinetic energy in figure 10(b).
Conversely, placing the incident vortex with a small positive vertical offset elicits a markedly different behaviour. Figure 11(g,h) shows top and bottom views, respectively, of the instantaneous flow structure for the
 ${\rm\Delta}z/c=+0.10$
case. Most notably, this vertical position completely removes the vortex instability upstream of the wing and corresponds with the lack of turbulent kinetic energy in front of the leading edge in figure 10(d). The incident vortex, which now passes over the suction side, remains a stable, coherent structure until roughly the mid-chord where it begins to exhibit a transitional flow structure. Flow instabilities first appear on the inboard side of the vortex due to the influence of the closely positioned unsteady separated shear layer portrayed in figure 10(d). Further downstream, the vortex develops a clear helical pattern on the outboard side visible in the side view of the instantaneous
${\rm\Delta}z/c=+0.10$
case. Most notably, this vertical position completely removes the vortex instability upstream of the wing and corresponds with the lack of turbulent kinetic energy in front of the leading edge in figure 10(d). The incident vortex, which now passes over the suction side, remains a stable, coherent structure until roughly the mid-chord where it begins to exhibit a transitional flow structure. Flow instabilities first appear on the inboard side of the vortex due to the influence of the closely positioned unsteady separated shear layer portrayed in figure 10(d). Further downstream, the vortex develops a clear helical pattern on the outboard side visible in the side view of the instantaneous
 $Q$
-criterion shown in figure 12.
$Q$
-criterion shown in figure 12.
Figure 13 provides contours of the so-called turbulent kinetic energy production (
 $\mathscr{P}$
) at several streamwise slices for the isolated wing and several vertical offsets. This quantity represents the rate of transfer of energy from the mean flow to fluctuating components and provides insight into the growth of unsteady flow behaviour. Upstream of the wing, both the negative offset (
$\mathscr{P}$
) at several streamwise slices for the isolated wing and several vertical offsets. This quantity represents the rate of transfer of energy from the mean flow to fluctuating components and provides insight into the growth of unsteady flow behaviour. Upstream of the wing, both the negative offset (
 ${\rm\Delta}z/c=-0.1$
) and direct impingement (
${\rm\Delta}z/c=-0.1$
) and direct impingement (
 ${\rm\Delta}z/c=0$
) vortices exhibit a ring of
${\rm\Delta}z/c=0$
) vortices exhibit a ring of
 $\mathscr{P}$
about the vortex axis. This well-organized annular concentration of turbulence production is consistent with the growth rate of helical mode instabilities for a
$\mathscr{P}$
about the vortex axis. This well-organized annular concentration of turbulence production is consistent with the growth rate of helical mode instabilities for a
 $q$
-vortex (Jacquin & Pantano Reference Jacquin and Pantano2002) which are maximum at a particular radial position within the vortex core.
$q$
-vortex (Jacquin & Pantano Reference Jacquin and Pantano2002) which are maximum at a particular radial position within the vortex core.
For the positive vertical offset case (
 ${\rm\Delta}z/c=+0.1$
), no turbulence production appears upstream of the wing consistent with a stable incident vortex. Further downstream,
${\rm\Delta}z/c=+0.1$
), no turbulence production appears upstream of the wing consistent with a stable incident vortex. Further downstream,
 $x/c=0.5$
,
$x/c=0.5$
,
 $\mathscr{P}$
contours provide insight into the transitional nature of the incident vortex as it passes over the suction surface. Here, an annular concentration of turbulence production appears in the outboard side of the incident vortex indicating the growth of helical modes, visible in figure 12, and reminiscent of those observed upstream for the lower vertical positions. The unstable behaviour of the incident vortex as it passes over the upper surface appears to be influenced by both interaction with fluctuations in the separated region and the natural growth of instability modes of the vortex itself.
$\mathscr{P}$
contours provide insight into the transitional nature of the incident vortex as it passes over the suction surface. Here, an annular concentration of turbulence production appears in the outboard side of the incident vortex indicating the growth of helical modes, visible in figure 12, and reminiscent of those observed upstream for the lower vertical positions. The unstable behaviour of the incident vortex as it passes over the upper surface appears to be influenced by both interaction with fluctuations in the separated region and the natural growth of instability modes of the vortex itself.
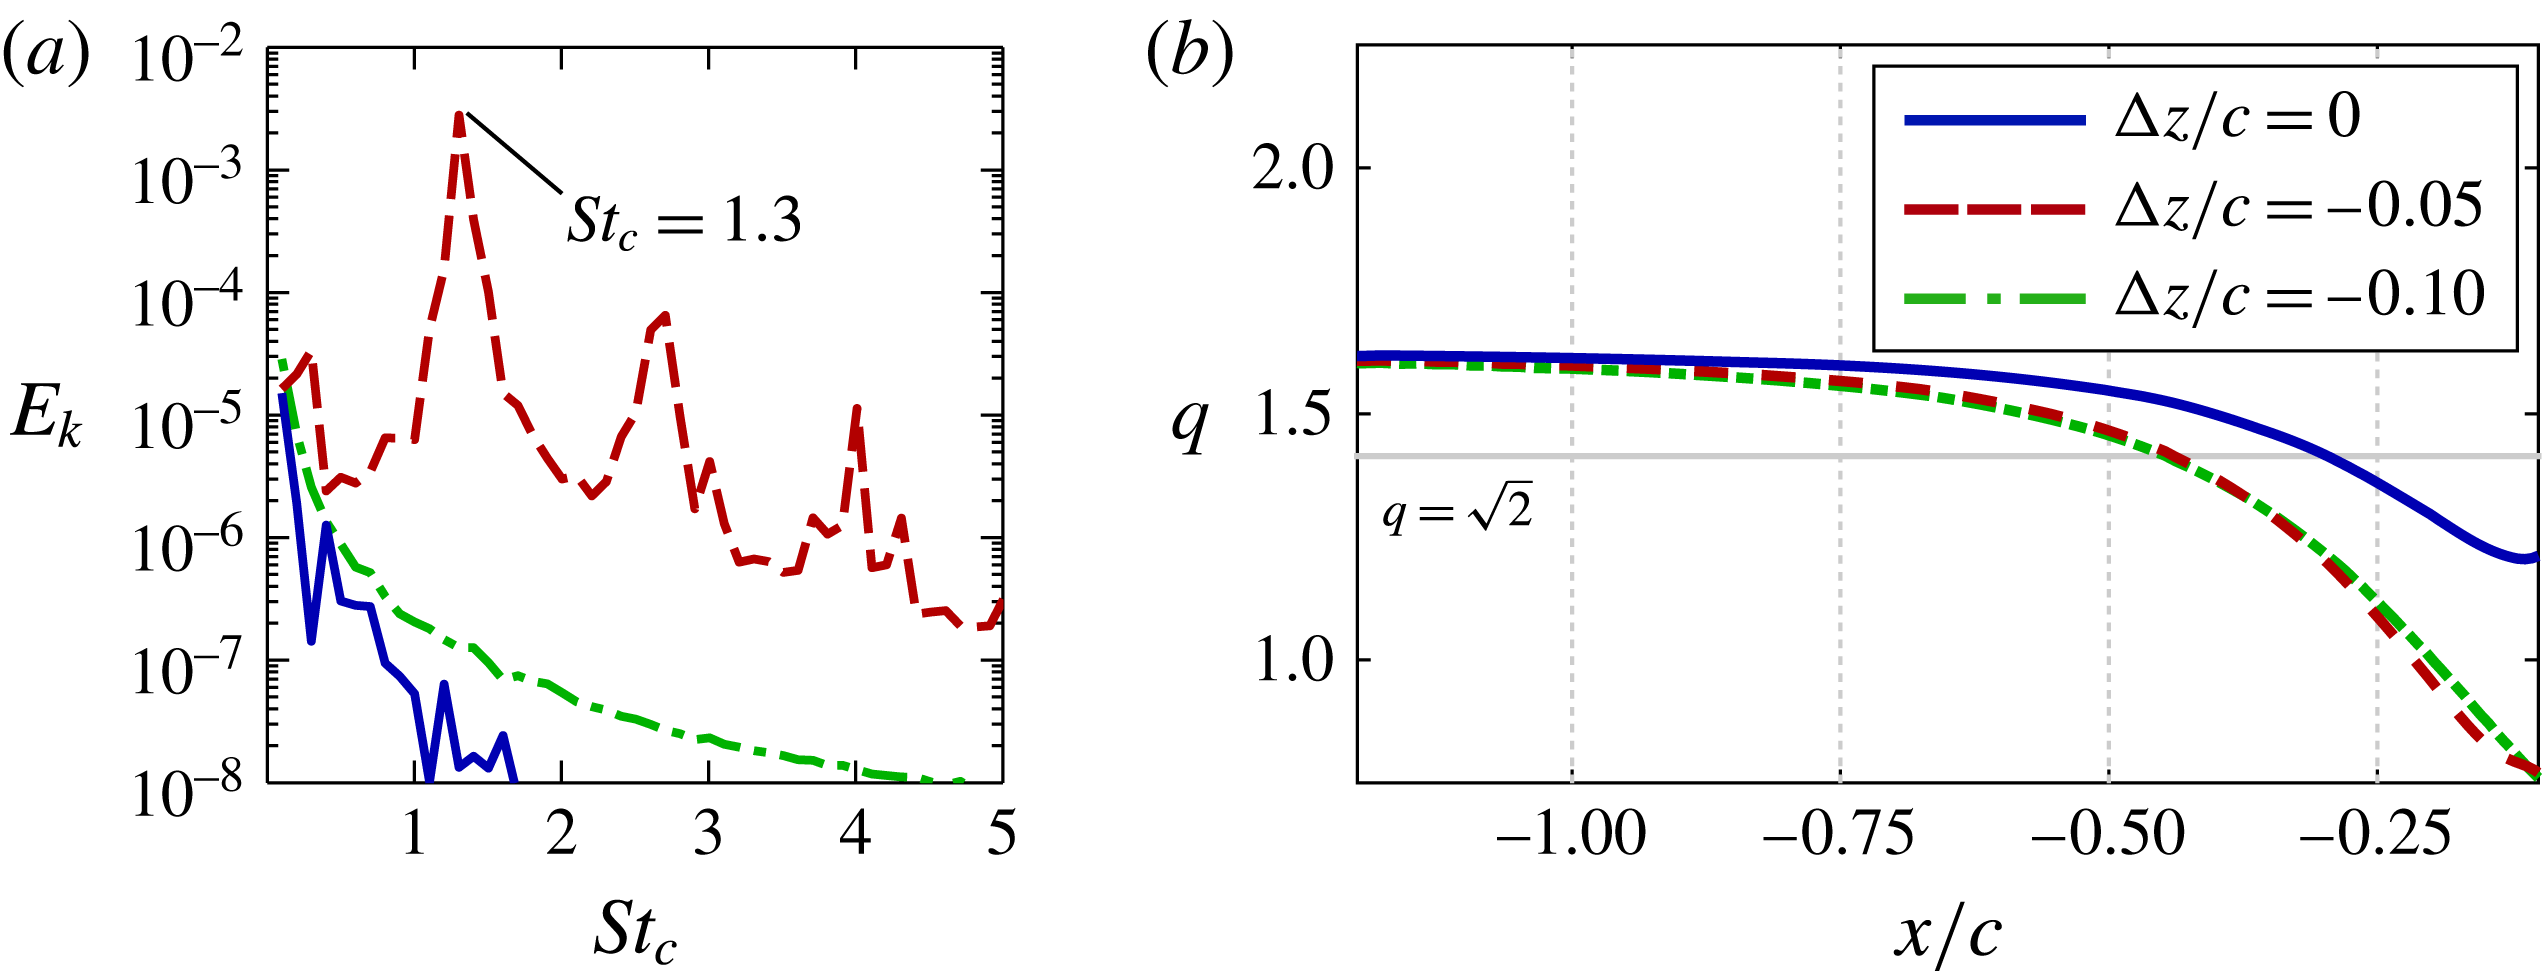
Velocity fluctuations were collected at two locations upstream of the leading edge for each case and used to compute the average turbulent kinetic energy spectra within a
 $0.1/c\times 0.1/c$
sample window centred about the incident vortex shown in figure 14(a). Figure 14(b) portrays the energy spectra for several vertical offsets at
$0.1/c\times 0.1/c$
sample window centred about the incident vortex shown in figure 14(a). Figure 14(b) portrays the energy spectra for several vertical offsets at
 $x/c=-0.45$
and provides a quantitative comparison of the flow instabilities. Well-defined frequencies are clearly depicted for the
$x/c=-0.45$
and provides a quantitative comparison of the flow instabilities. Well-defined frequencies are clearly depicted for the
 ${\rm\Delta}z/c=-0.1$
case which exhibits the most pronounced helical instability in figure 11. The dominant non-dimensional frequency
${\rm\Delta}z/c=-0.1$
case which exhibits the most pronounced helical instability in figure 11. The dominant non-dimensional frequency
 $St_{c}=fc/U_{\infty }$
of
$St_{c}=fc/U_{\infty }$
of
 $St_{c}=0.9$
corresponds with the period of the large spiral in the incident vortex upstream of the wing. Several additional clearly defined frequencies are also found at harmonics of the dominant peak for this case, indicating higher modes of instability not well portrayed in figure 11. The same frequencies appear for the
$St_{c}=0.9$
corresponds with the period of the large spiral in the incident vortex upstream of the wing. Several additional clearly defined frequencies are also found at harmonics of the dominant peak for this case, indicating higher modes of instability not well portrayed in figure 11. The same frequencies appear for the
 ${\rm\Delta}z/c=0$
and
${\rm\Delta}z/c=0$
and
 $-0.25$
cases at a location closer to the leading edge in figure 14(c). As expected, no frequencies stand out for the stable
$-0.25$
cases at a location closer to the leading edge in figure 14(c). As expected, no frequencies stand out for the stable
 ${\rm\Delta}z/c=+0.1$
case. While the level of instability in the incident vortex is strongly affected by vertical position, the consistent timescales of the instability indicate its form evolves according to the properties of the incident vortex.
${\rm\Delta}z/c=+0.1$
case. While the level of instability in the incident vortex is strongly affected by vertical position, the consistent timescales of the instability indicate its form evolves according to the properties of the incident vortex.
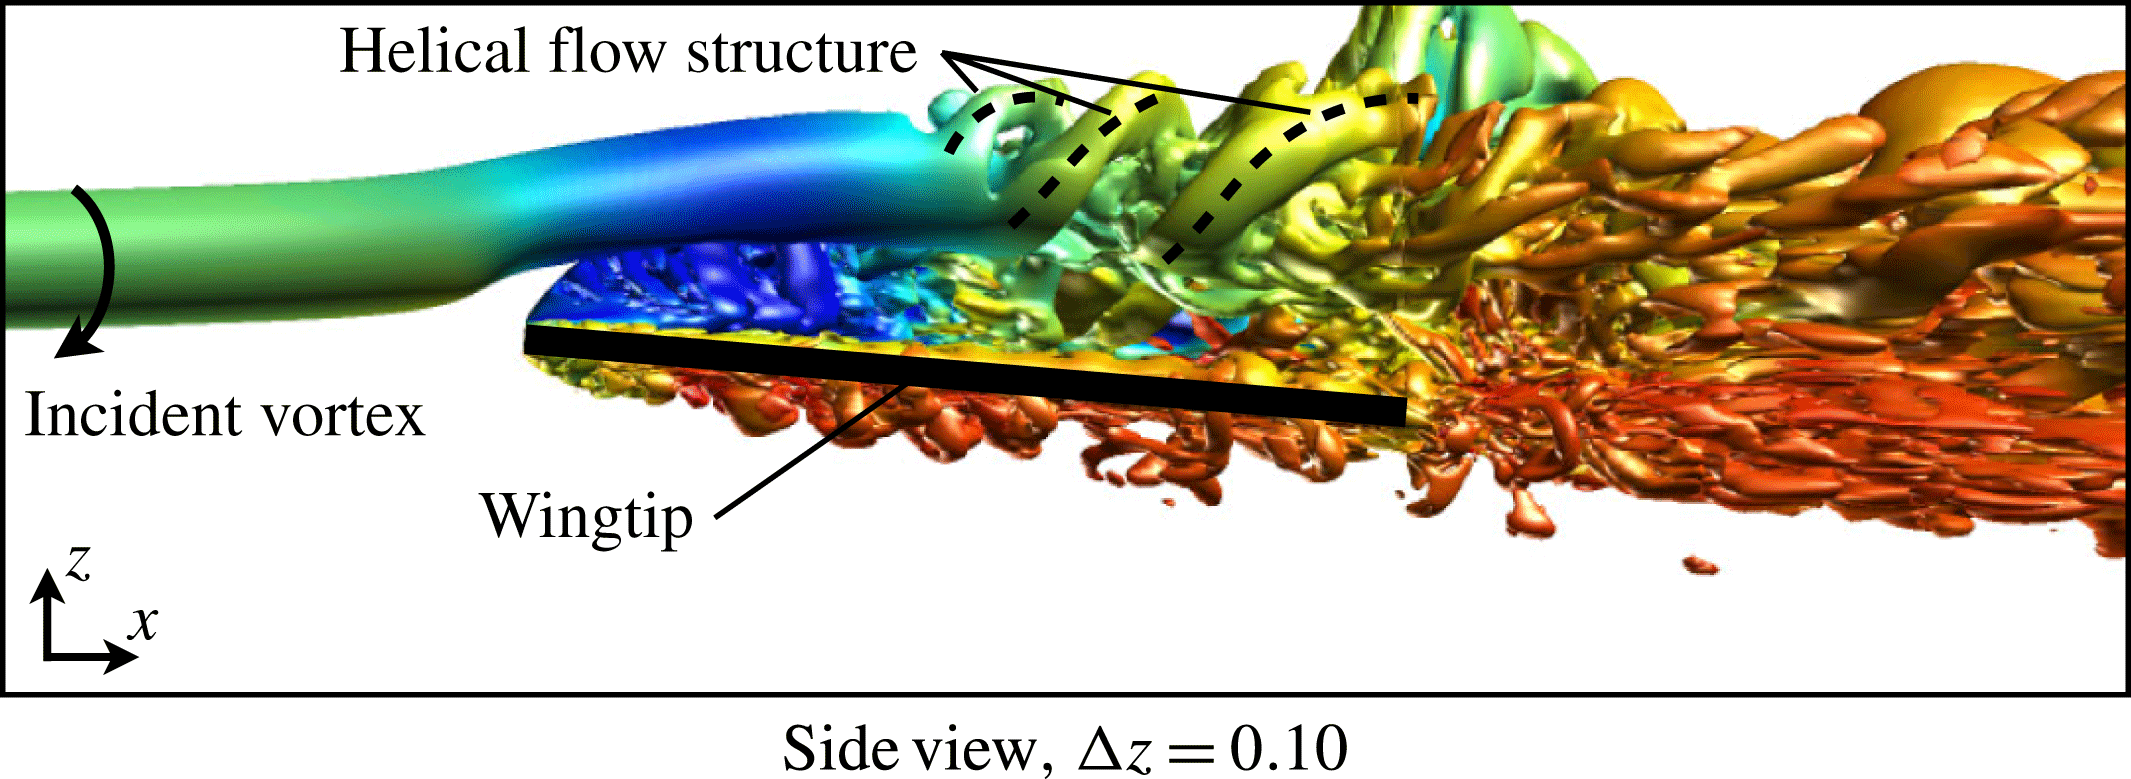
Figure 12. An iso-surface of instantaneous
 $Q$
-criterion (
$Q$
-criterion (
 $Q=15$
) for a side view of the
$Q=15$
) for a side view of the
 ${\rm\Delta}z=+0.10$
case.
${\rm\Delta}z=+0.10$
case.

Figure 13. Slices of turbulence production (
 $\mathscr{P}$
) at several chord-wise positions (
$\mathscr{P}$
) at several chord-wise positions (
 $x/c=-0.40,-0.25,-0.10,0.01,0.10,0.25,0.50,0.75,1.00,1.25,1.50$
). The wing is semi-transparent.
$x/c=-0.40,-0.25,-0.10,0.01,0.10,0.25,0.50,0.75,1.00,1.25,1.50$
). The wing is semi-transparent.
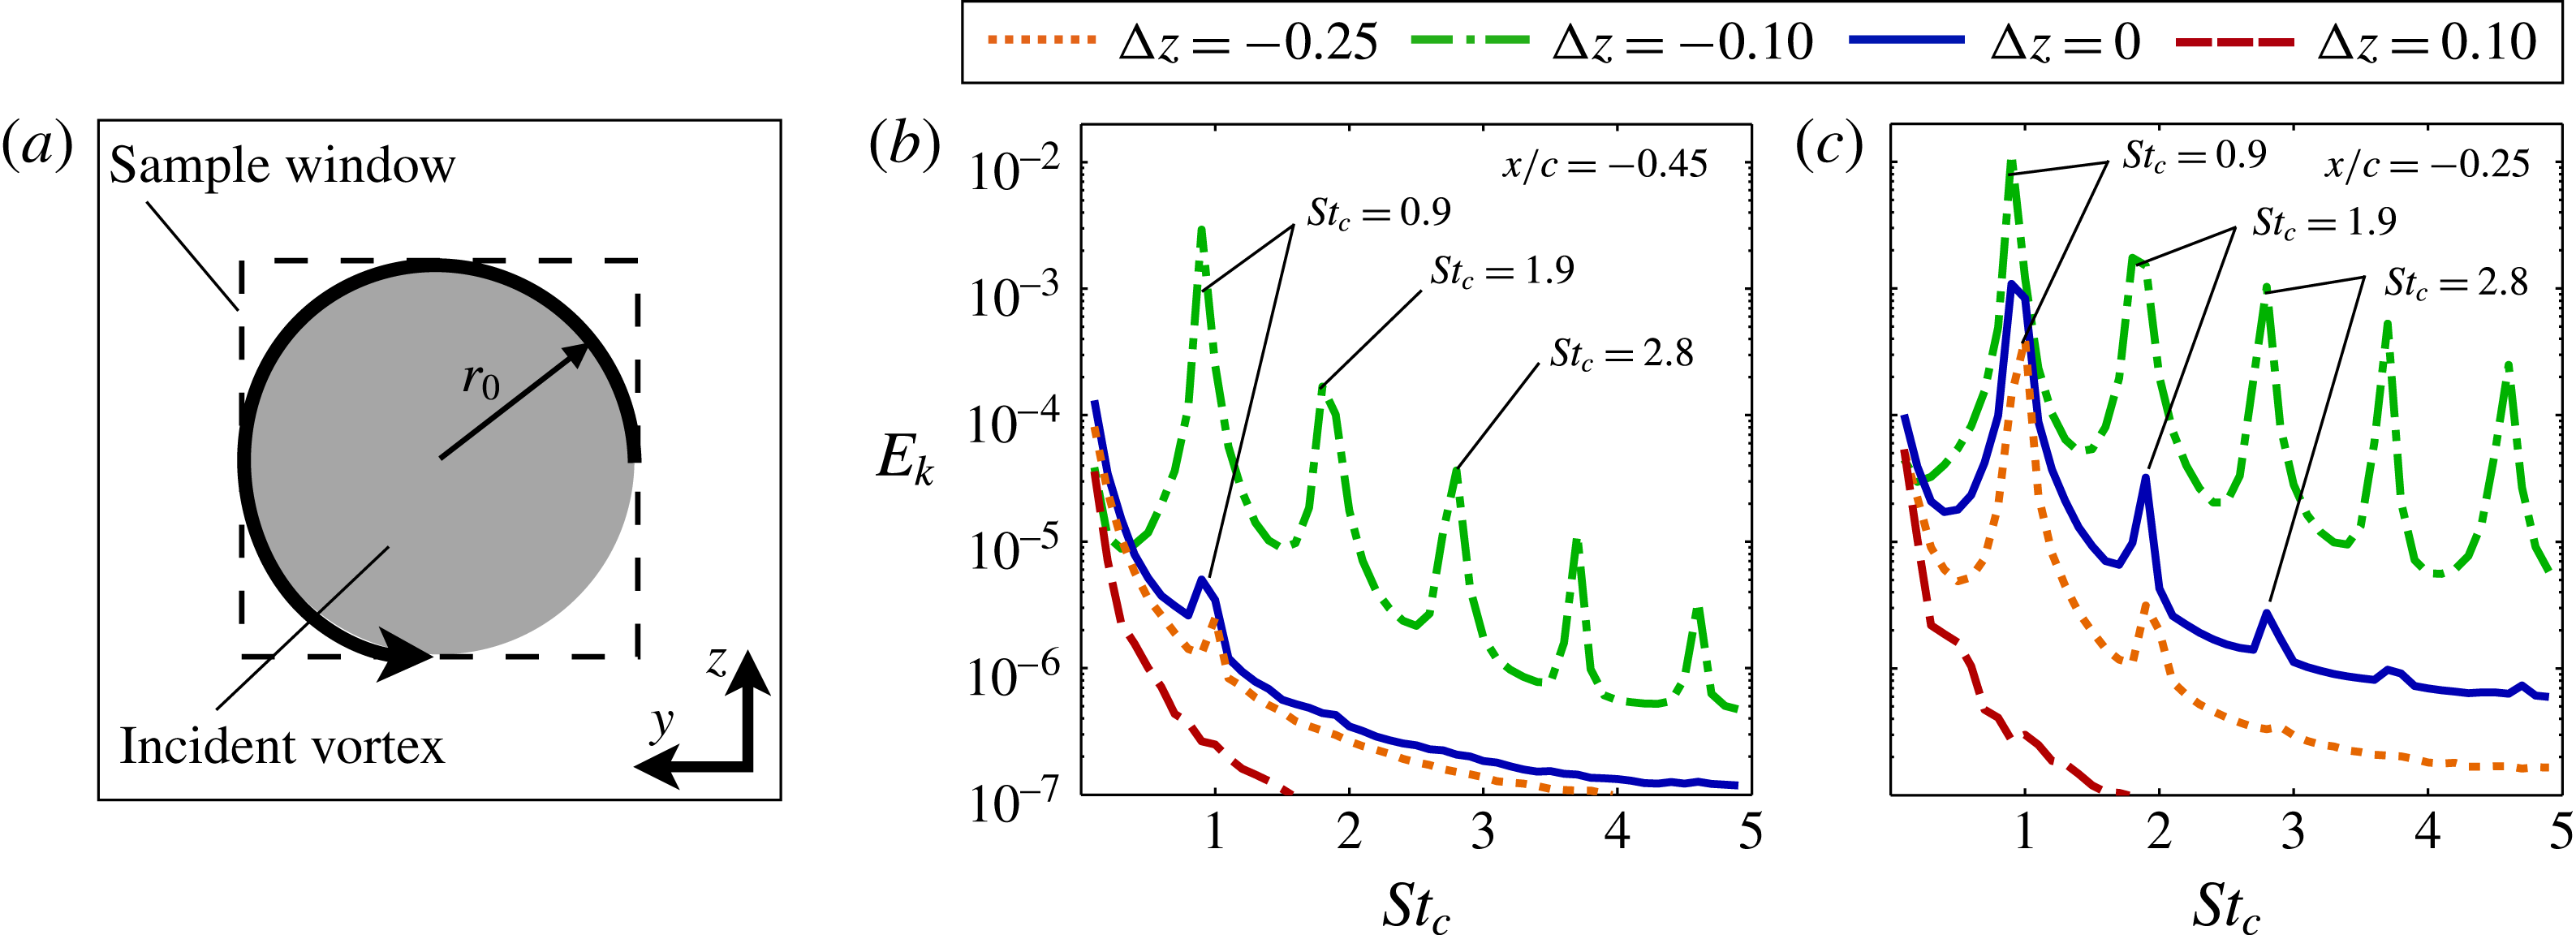
Figure 14. Turbulent kinetic energy spectra at (a)
 $x/c=-0.45$
and (b)
$x/c=-0.45$
and (b)
 $x/c=-0.25$
.
$x/c=-0.25$
.
5.3 Discussion on vortex stability
The preceding section of this article dissected the unsteady flow structure for a small range of vertical offsets and demonstrated the implications of vertical positioning on the incident vortex behaviour. This section connects the physical mechanisms of the vortex–surface interaction to the instability properties of streamwise-oriented vortices. Leibovich & Stewartson (Reference Leibovich and Stewartson1983) derived a stability criterion for the
 $q$
-vortex based solely on the swirl ratio,
$q$
-vortex based solely on the swirl ratio,
 $q$
, which is a ratio of the tangential to streamwise velocities. Their criteria describes a sufficient condition of
$q$
, which is a ratio of the tangential to streamwise velocities. Their criteria describes a sufficient condition of
 $q<\sqrt{2}$
for the
$q<\sqrt{2}$
for the
 $q$
-vortex that permits growth of disturbances within the vortex core. The initial value of the swirl ratio (
$q$
-vortex that permits growth of disturbances within the vortex core. The initial value of the swirl ratio (
 $q_{o}=2$
) used in this work was chosen to be well within the stable regime. Nonetheless, vortex–wing interactions develop unsteady behaviour reminiscent of helical instabilities for a
$q_{o}=2$
) used in this work was chosen to be well within the stable regime. Nonetheless, vortex–wing interactions develop unsteady behaviour reminiscent of helical instabilities for a
 $q$
-vortex.
$q$
-vortex.
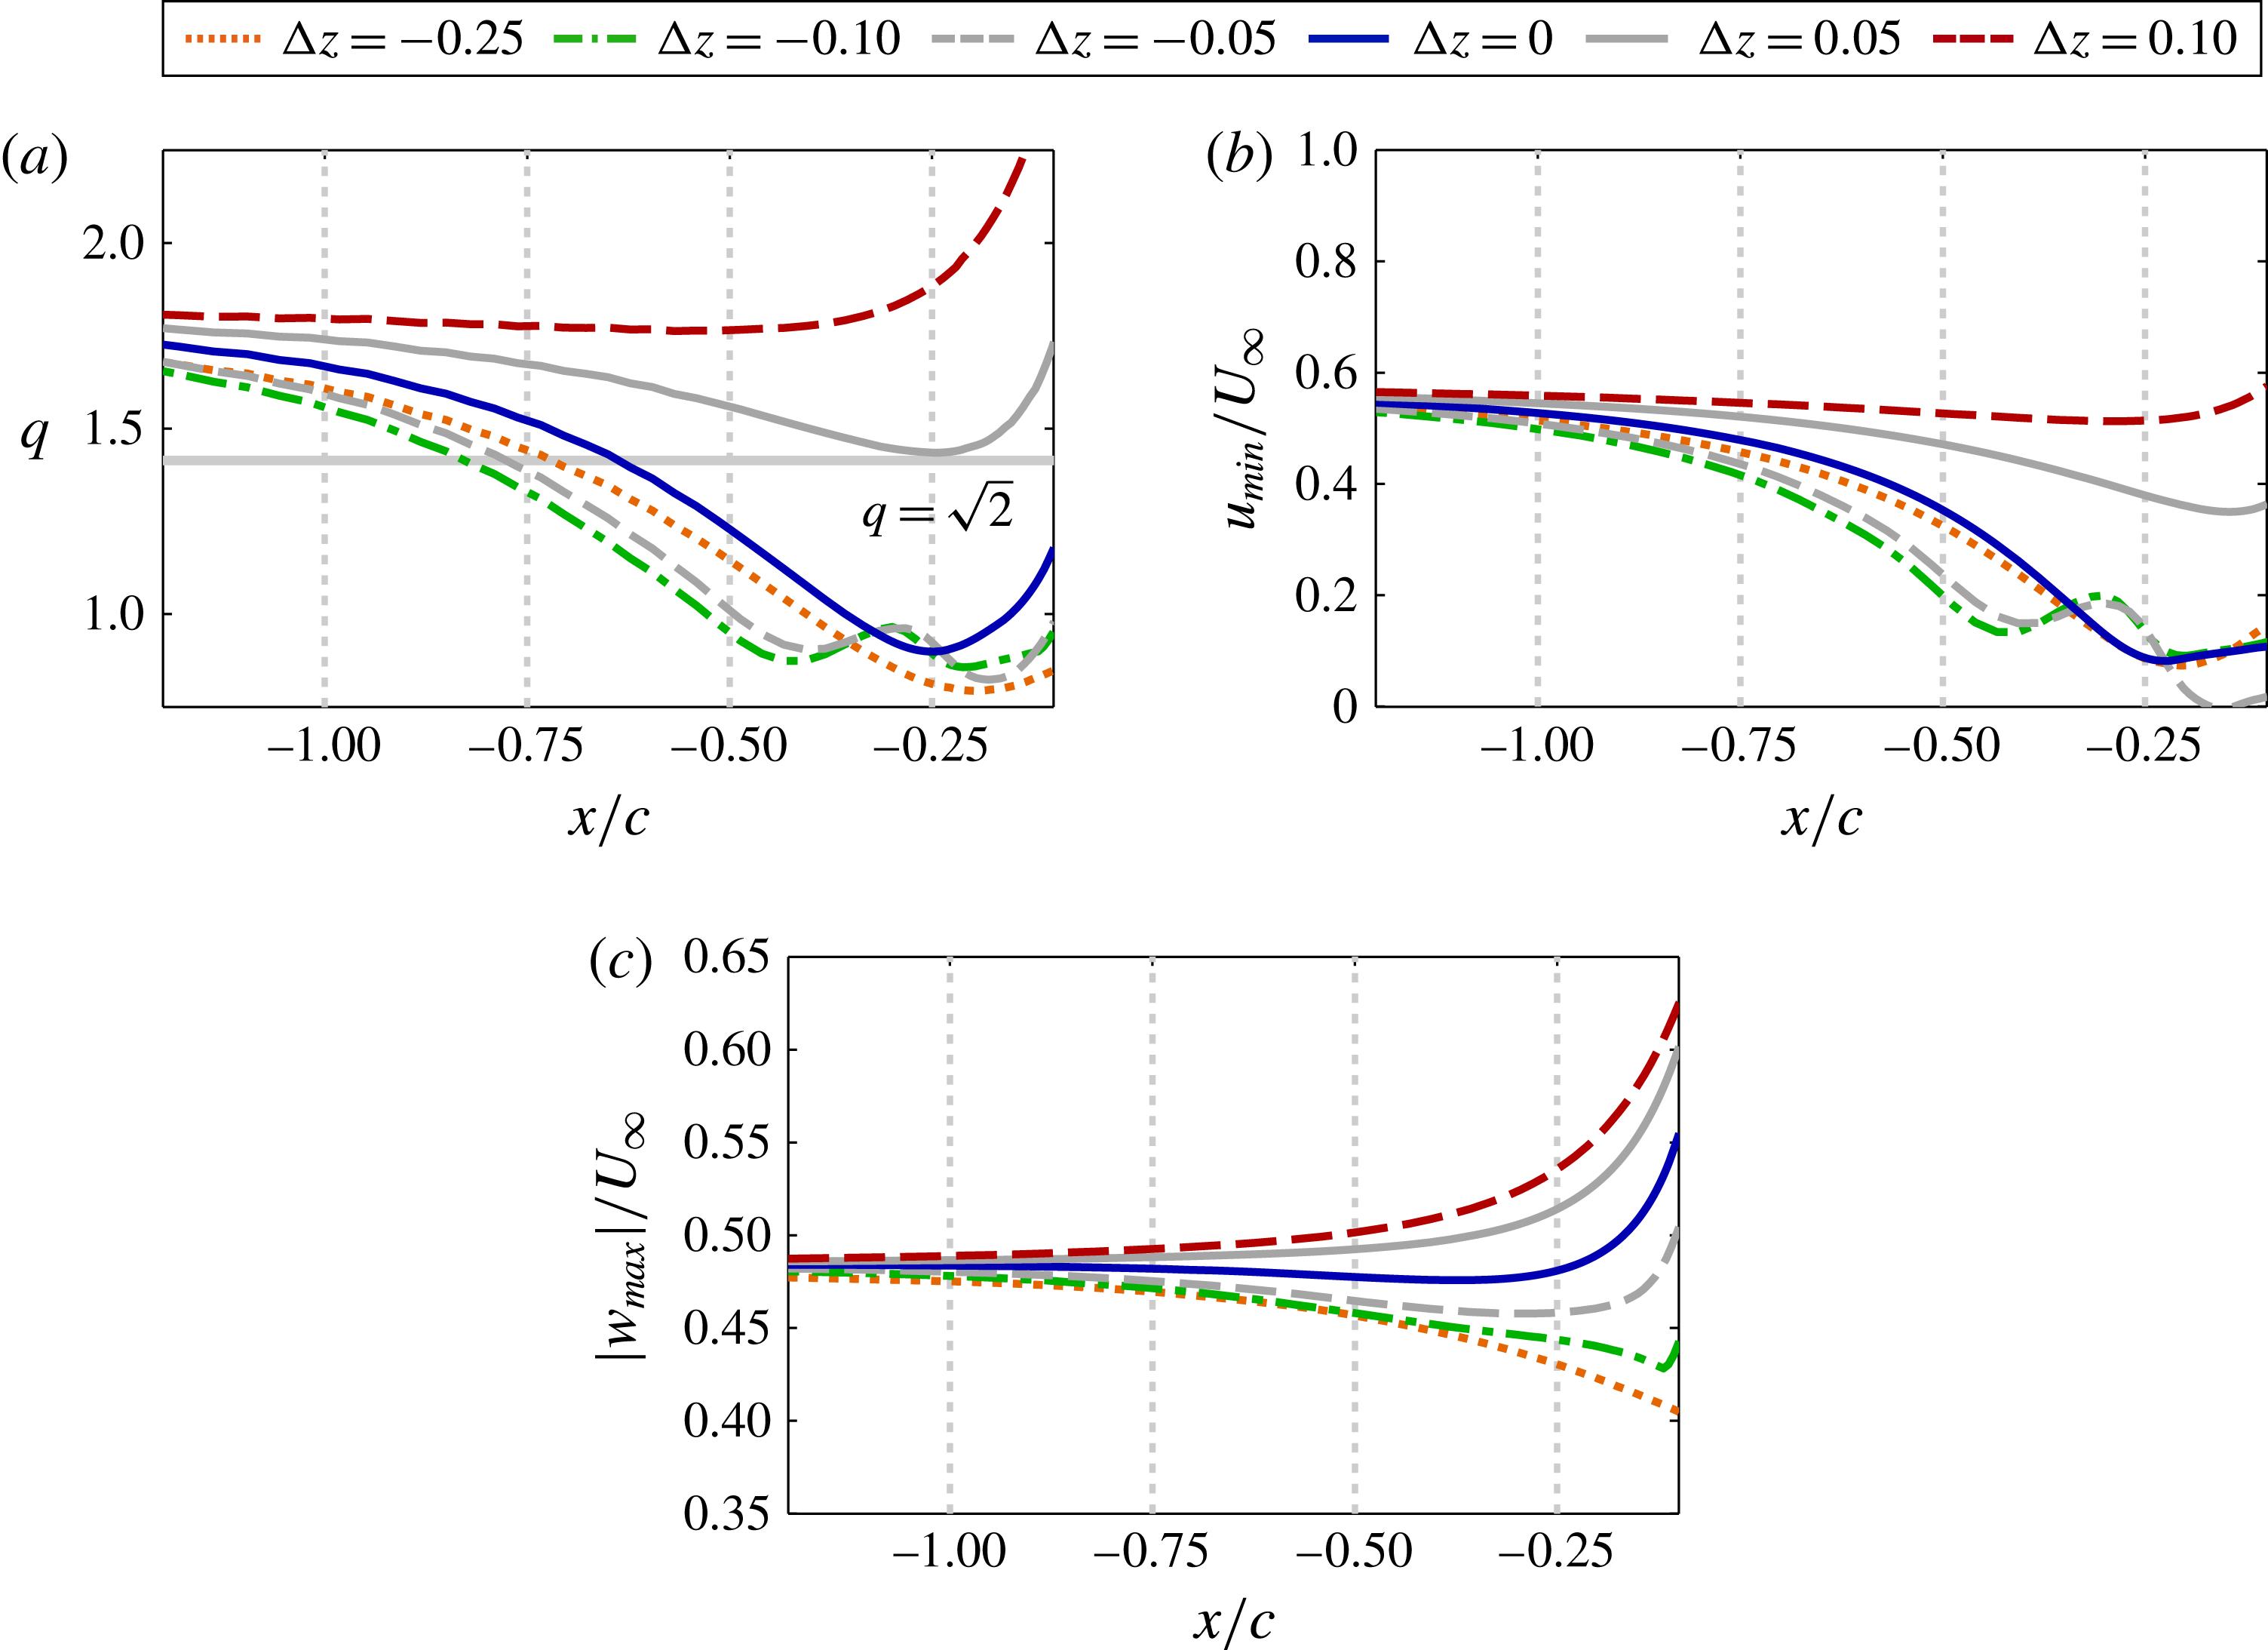
Figure 15(a) plots the swirl ratio,
 $q$
, of the incident vortex upstream of the leading edge, which varies from its initial stable value due to the upstream influence provided by the wing. The direct impingement,
$q$
, of the incident vortex upstream of the leading edge, which varies from its initial stable value due to the upstream influence provided by the wing. The direct impingement,
 ${\rm\Delta}z/c=0$
, and all negative offset cases (
${\rm\Delta}z/c=0$
, and all negative offset cases (
 ${\rm\Delta}z/c=-0.05$
to
${\rm\Delta}z/c=-0.05$
to
 $-0.25$
) result in a swirl ratio that diminishes as the vortex approaches the wing, falling well below the stability threshold. This behaviour indicates that the vortex becomes susceptible to disturbances before reaching the wing. A helical instability develops just downstream from where the swirl ratio falls below the stability threshold in each of these vertical positions. The swirl for the
$-0.25$
) result in a swirl ratio that diminishes as the vortex approaches the wing, falling well below the stability threshold. This behaviour indicates that the vortex becomes susceptible to disturbances before reaching the wing. A helical instability develops just downstream from where the swirl ratio falls below the stability threshold in each of these vertical positions. The swirl for the
 ${\rm\Delta}z/c=-0.1$
case crosses the stability threshold further upstream than that for the
${\rm\Delta}z/c=-0.1$
case crosses the stability threshold further upstream than that for the
 ${\rm\Delta}z/c=0$
case, consistent with the earlier onset of unstable behaviour shown in figure 11. The swirl ratio for the two positive offset cases,
${\rm\Delta}z/c=0$
case, consistent with the earlier onset of unstable behaviour shown in figure 11. The swirl ratio for the two positive offset cases,
 ${\rm\Delta}z/c=+0.05$
and
${\rm\Delta}z/c=+0.05$
and
 $+0.1$
, shows the incident vortex remains above the stability threshold upstream of the wing consistent with the lack of unsteady behaviour for both cases. While the stability criterion of Leibovich & Stewartson (Reference Leibovich and Stewartson1983) is not exclusively necessary for instability, the onset or lack of instability appears to be well predicted by the linear stability properties of the incident vortex in the present cases.
$+0.1$
, shows the incident vortex remains above the stability threshold upstream of the wing consistent with the lack of unsteady behaviour for both cases. While the stability criterion of Leibovich & Stewartson (Reference Leibovich and Stewartson1983) is not exclusively necessary for instability, the onset or lack of instability appears to be well predicted by the linear stability properties of the incident vortex in the present cases.

Figure 15. Time-mean (a) swirl ratio, (b) minimum stream wise velocity and (c) maximum tangential velocity versus the streamwise direction upstream of the leading edge for several
 ${\rm\Delta}z$
.
${\rm\Delta}z$
.
The swirl ratio shown in figure 15(a) depends on the time-mean minimum axial velocity,
 $u_{min}$
, and maximum tangential velocity,
$u_{min}$
, and maximum tangential velocity,
 $w_{max}$
, at each streamwise position, which are plotted in figure 15(b,c) respectively. While
$w_{max}$
, at each streamwise position, which are plotted in figure 15(b,c) respectively. While
 $q=1.567w_{max}/(U_{\infty }-u_{min})$
is linearly proportional to both values, the streamwise variation of
$q=1.567w_{max}/(U_{\infty }-u_{min})$
is linearly proportional to both values, the streamwise variation of
 $u_{min}$
within the vortex clearly dominates the trends portrayed in figure 15(a) for the swirl ratio of the unstable cases. Figure 9 shows the response of axial velocity to the pressure gradients provided by interaction with the wing at different vertical positions, which can be tied to vortex stability here. The negative vertical offset experiences a stronger adverse pressure gradient, resulting in a quicker swirl decay that allows instabilities to initiate further upstream.
$u_{min}$
within the vortex clearly dominates the trends portrayed in figure 15(a) for the swirl ratio of the unstable cases. Figure 9 shows the response of axial velocity to the pressure gradients provided by interaction with the wing at different vertical positions, which can be tied to vortex stability here. The negative vertical offset experiences a stronger adverse pressure gradient, resulting in a quicker swirl decay that allows instabilities to initiate further upstream.
The positive vertical offset aligns the vortex with a favourable pressure gradient that supports two effects that enhance vortex stability. First, axial velocity initially remains fairly constant which helps to preserve the swirl ratio. Second, the favourable gradient subjects the vortex to stretching close to the leading edge which enhances the tangential component of velocity as shown in figure 15(c) and strengthens the swirl ratio. Contrary to the negative offset cases, variation of the swirl component of velocity appears to be the more significant factor for positive offsets.
A positive vertical offset is not sufficient to guarantee a stable vortex–wing interaction. For example, the flow visualizations of McAlister & Tung (Reference McAlister and Tung1984) portray breakdown of a trailing vortex over a stalled two-dimensional airfoil. This observation indicates that angle of attack is also likely to play a significant role. For instance, a stronger separation/stall-induced adverse pressure gradient on the suction side could promote instability and breakdown. This concept appears to influence the incident vortex behaviour on the suction side of the
 ${\rm\Delta}z/c=+0.1$
case past the mid-chord. Figure 9(b) shows a region of adverse
${\rm\Delta}z/c=+0.1$
case past the mid-chord. Figure 9(b) shows a region of adverse
 $\partial \overline{p}/\partial x$
, strongest near the mid-chord, associated with flow separation above the wing. In response, an enhanced velocity deficit is produced in the vortex core downstream of the mid-chord and portrayed in figure 9(a). This appears to drive the vortex into an unstable regime above the wing near the mid-chord, permitting the growth of unstable helical modes visible in figure 12.
$\partial \overline{p}/\partial x$
, strongest near the mid-chord, associated with flow separation above the wing. In response, an enhanced velocity deficit is produced in the vortex core downstream of the mid-chord and portrayed in figure 9(a). This appears to drive the vortex into an unstable regime above the wing near the mid-chord, permitting the growth of unstable helical modes visible in figure 12.
As a final note to this section, the current work illustrates a tendency for vortex–wing interaction to elicit unsteady fluid dynamics. While the phenomenon described here is not vortex breakdown in the strict sense defined by Leibovich (Reference Leibovich1978), that is, requiring flow reversal or a stagnation point, axial pressure gradients are known to have a significant influence on the breakdown of columnar vortices. Sarpkaya (Reference Sarpkaya1974) first subjected a streamwise vortex to an axial pressure gradient in a tube and observed a significant impact on vortex breakdown. Visbal (Reference Visbal1994) clarified the dominant role of the axial pressure-gradient for breakdown over delta wings. More severe conditions, perhaps at a higher Reynolds number or angle of attack, may lead to breakdown of the streamwise vortex in the present configuration upstream for a negative offset or above the wing for a positive offset. This may elicit behaviours reminiscent of the buffeting response of fins subject to a broken-down vortex emitted from delta wings presented by Mayori & Rockwell (Reference Mayori and Rockwell1994), Wolfe et al. (Reference Wolfe, Canbazoglu, Lin and Rockwell1995), Kandil, Sheta & Massey (Reference Kandil, Sheta and Massey1995), Gordnier & Visbal (Reference Gordnier and Visbal1999), and more recently, Gursul & Xie (Reference Gursul and Xie2001) or Lambert & Gursul (Reference Lambert and Gursul2004), to name a few.
5.4 Aerodynamic loads
This section describes the integrated aerodynamic load trends that occur with vertical positioning. These trends are connected to the flow structure through time-mean surface pressure and pressure fluctuations. Evaluation of these quantities helps to describe the impact of vertical offset on the time-mean and unsteady load characteristics.
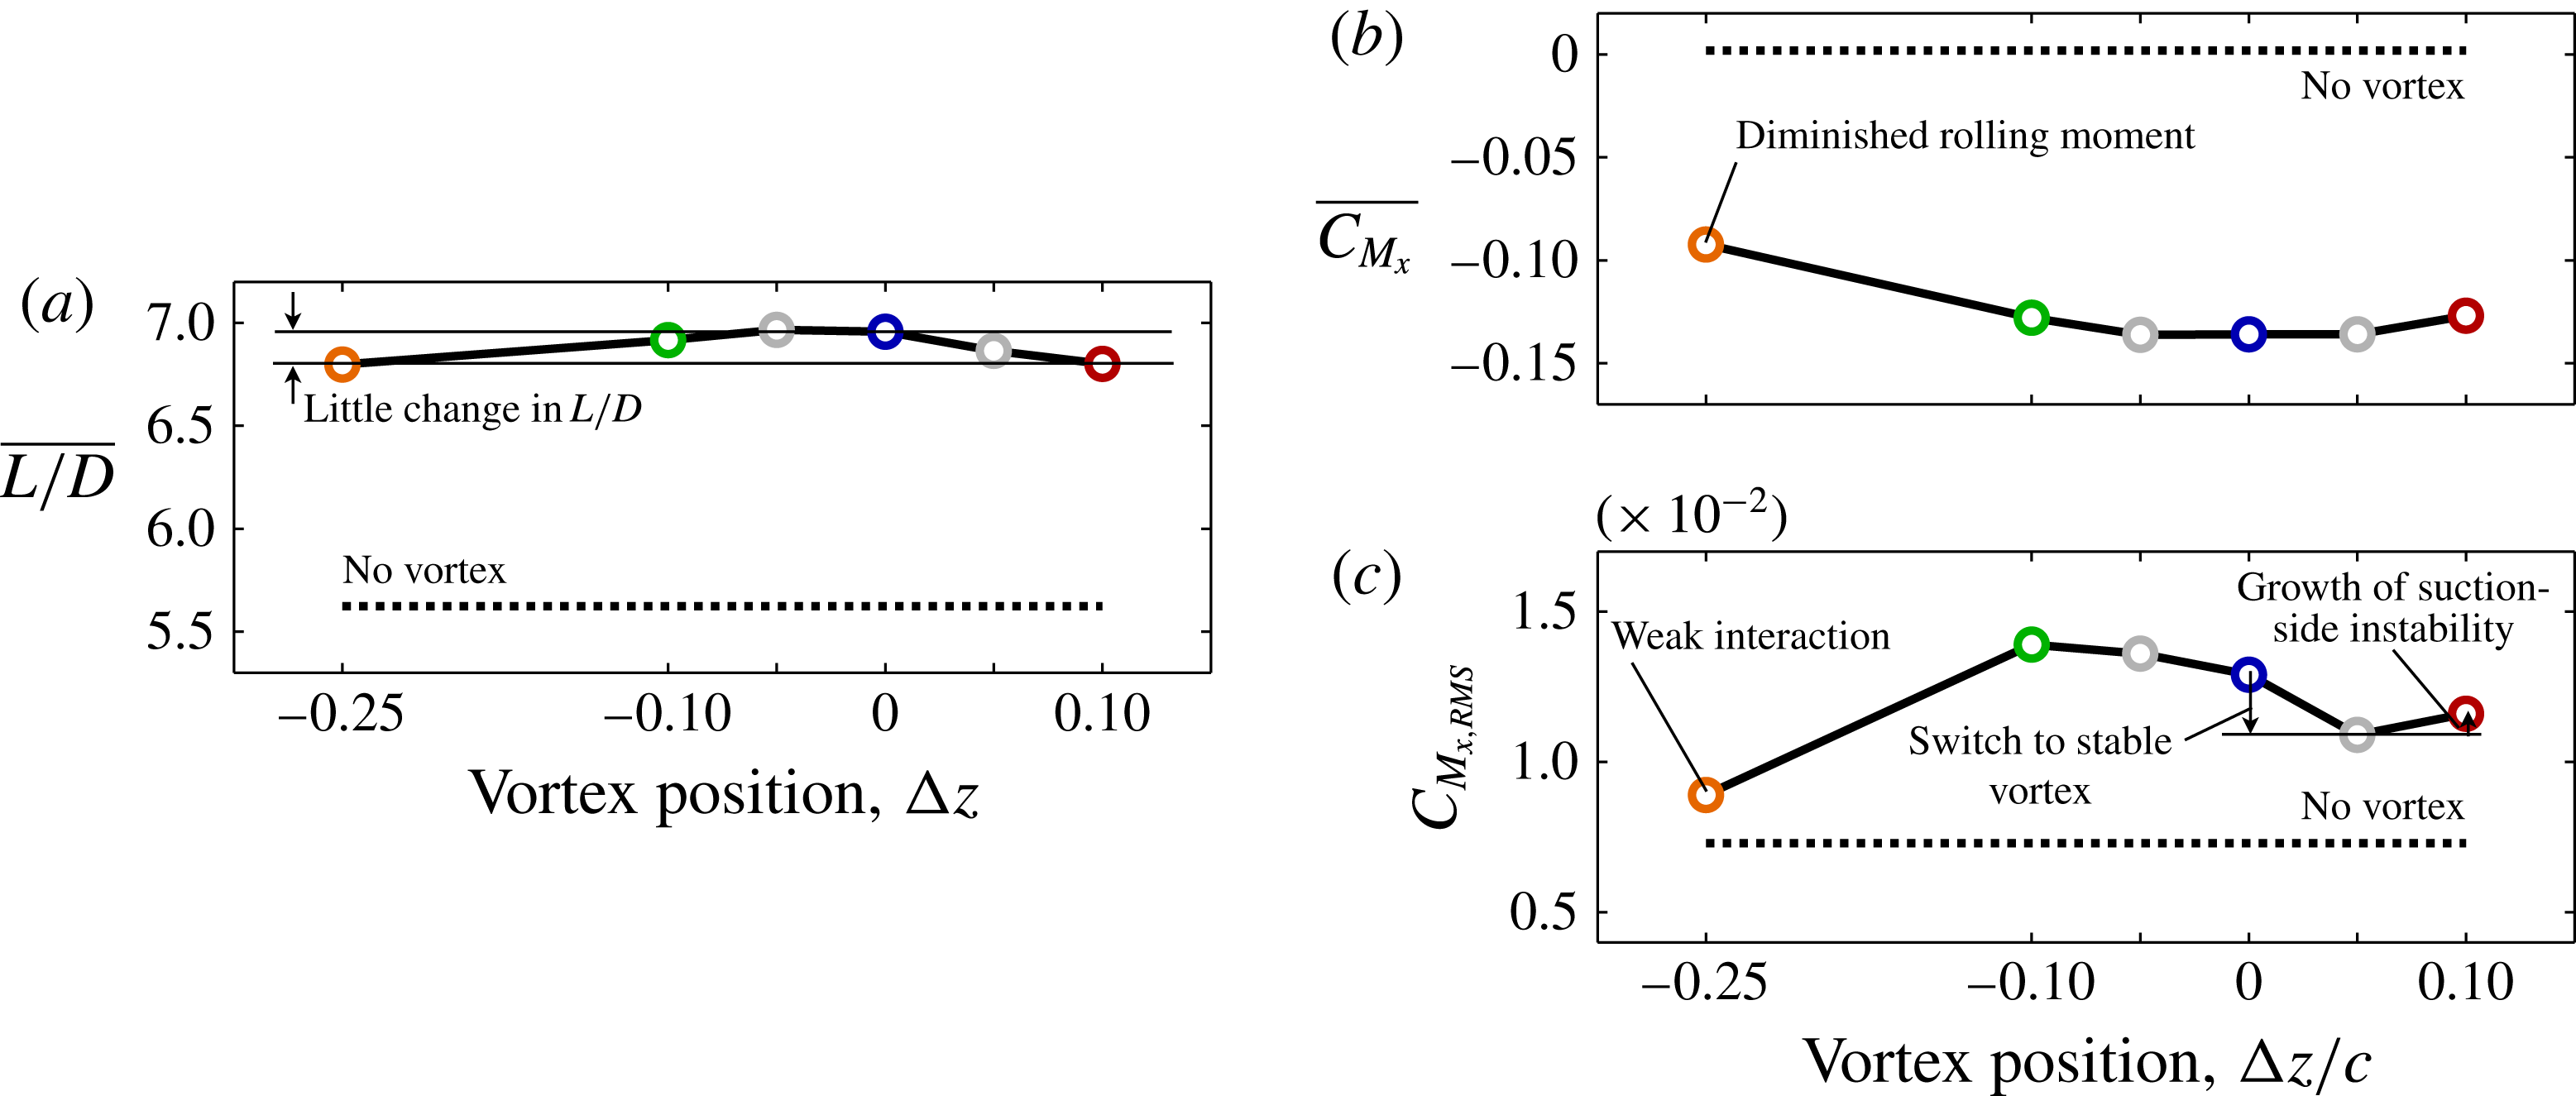
Figure 16. Time-mean (a) lift-to-drag ratio, (b) rolling-moment coefficient and (c) root-mean-square fluctuations of rolling-moment for several vertical positions.
Figure 16(a,b) provides a comparison of the time-mean lift-to-drag ratio and rolling moment coefficient, respectively, for all vertical positions and the isolated wing. Each of these quantities demonstrate little change with vertical placement of the vortex for the range of positions considered. In contrast, Garmann & Visbal (Reference Garmann and Visbal2015a
) showed the time-mean loads, the rolling moment in particular, were more significantly affected by the lateral placement,
 ${\rm\Delta}y$
, of the incident vortex.
${\rm\Delta}y$
, of the incident vortex.
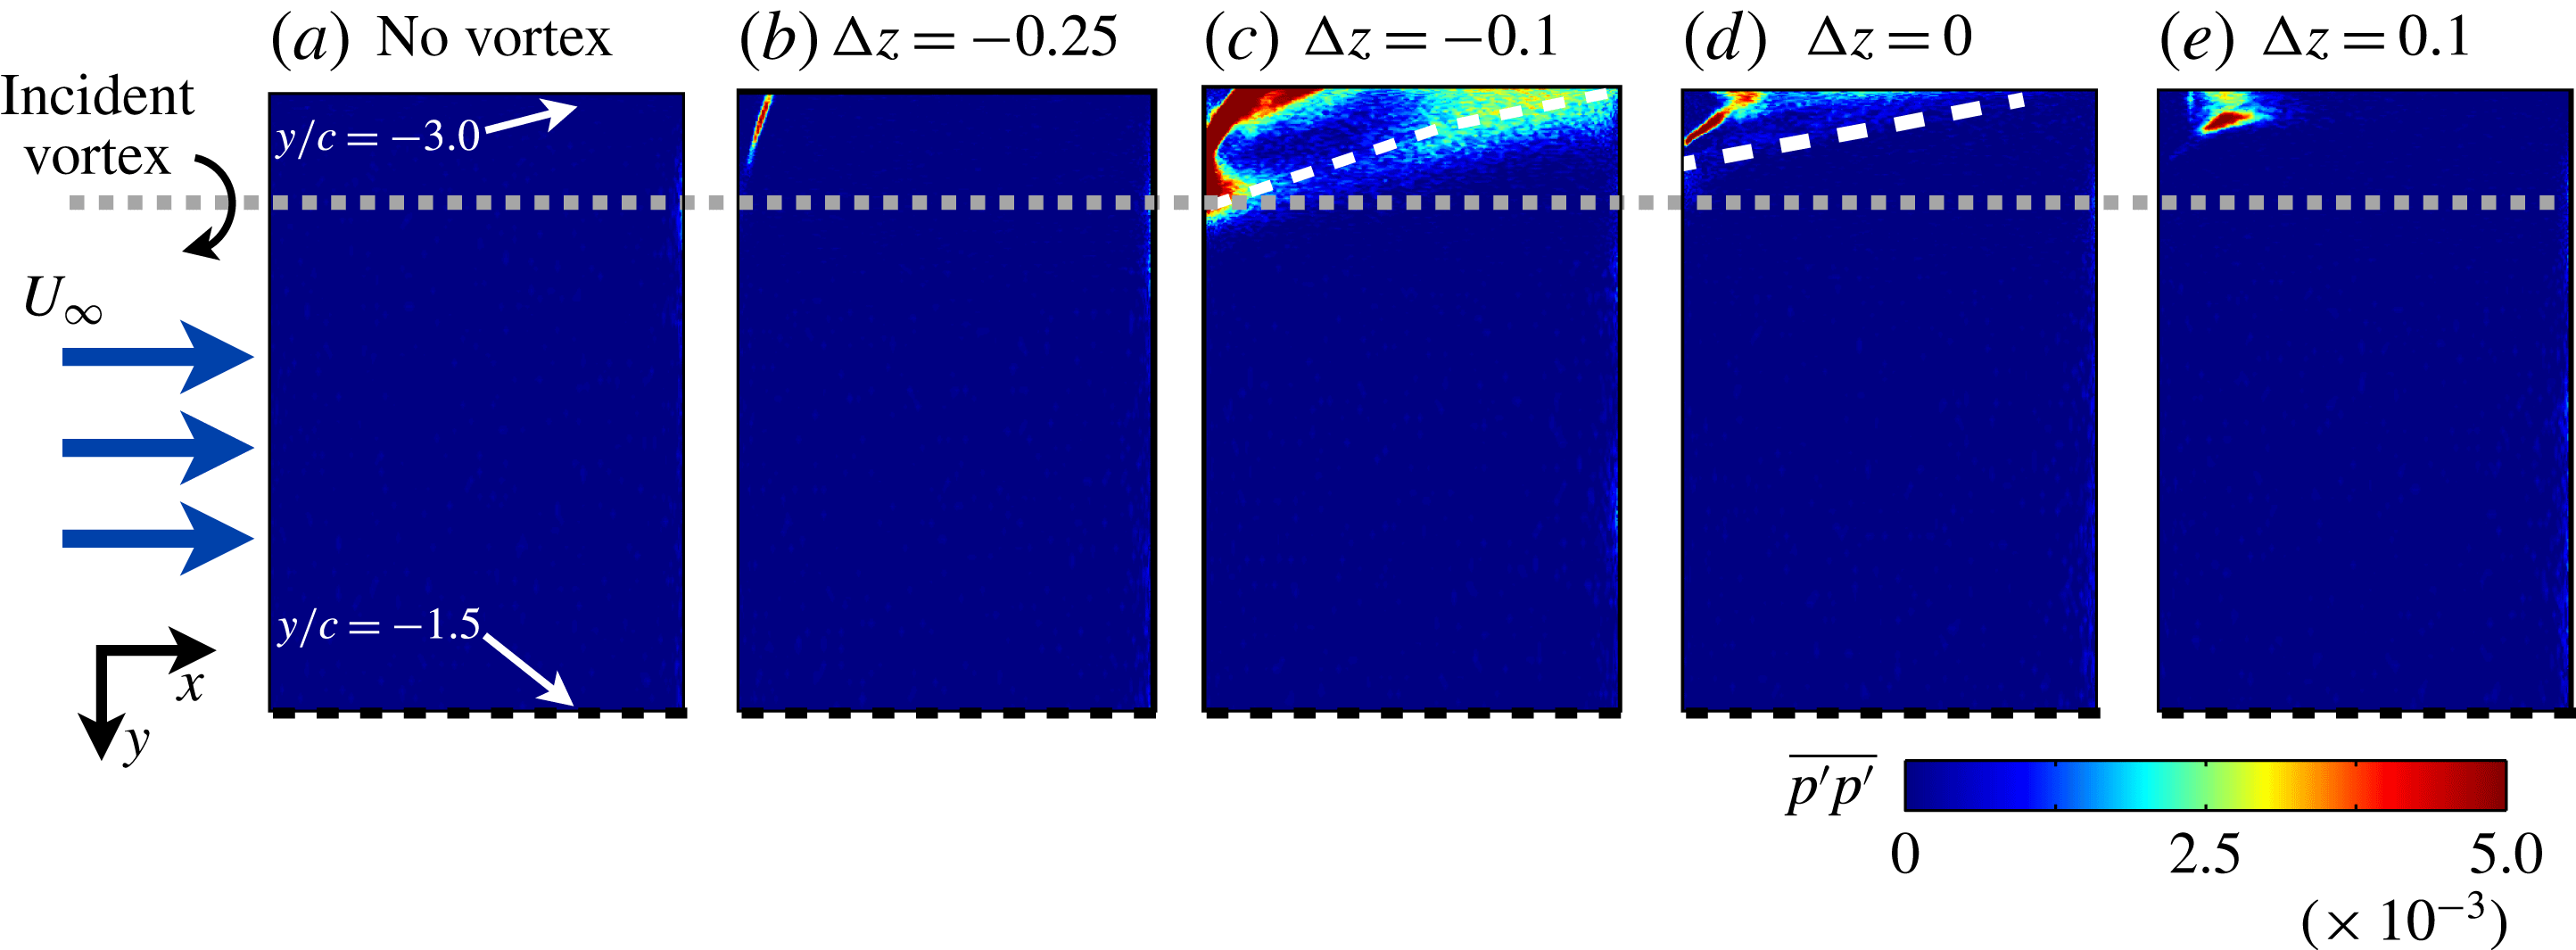
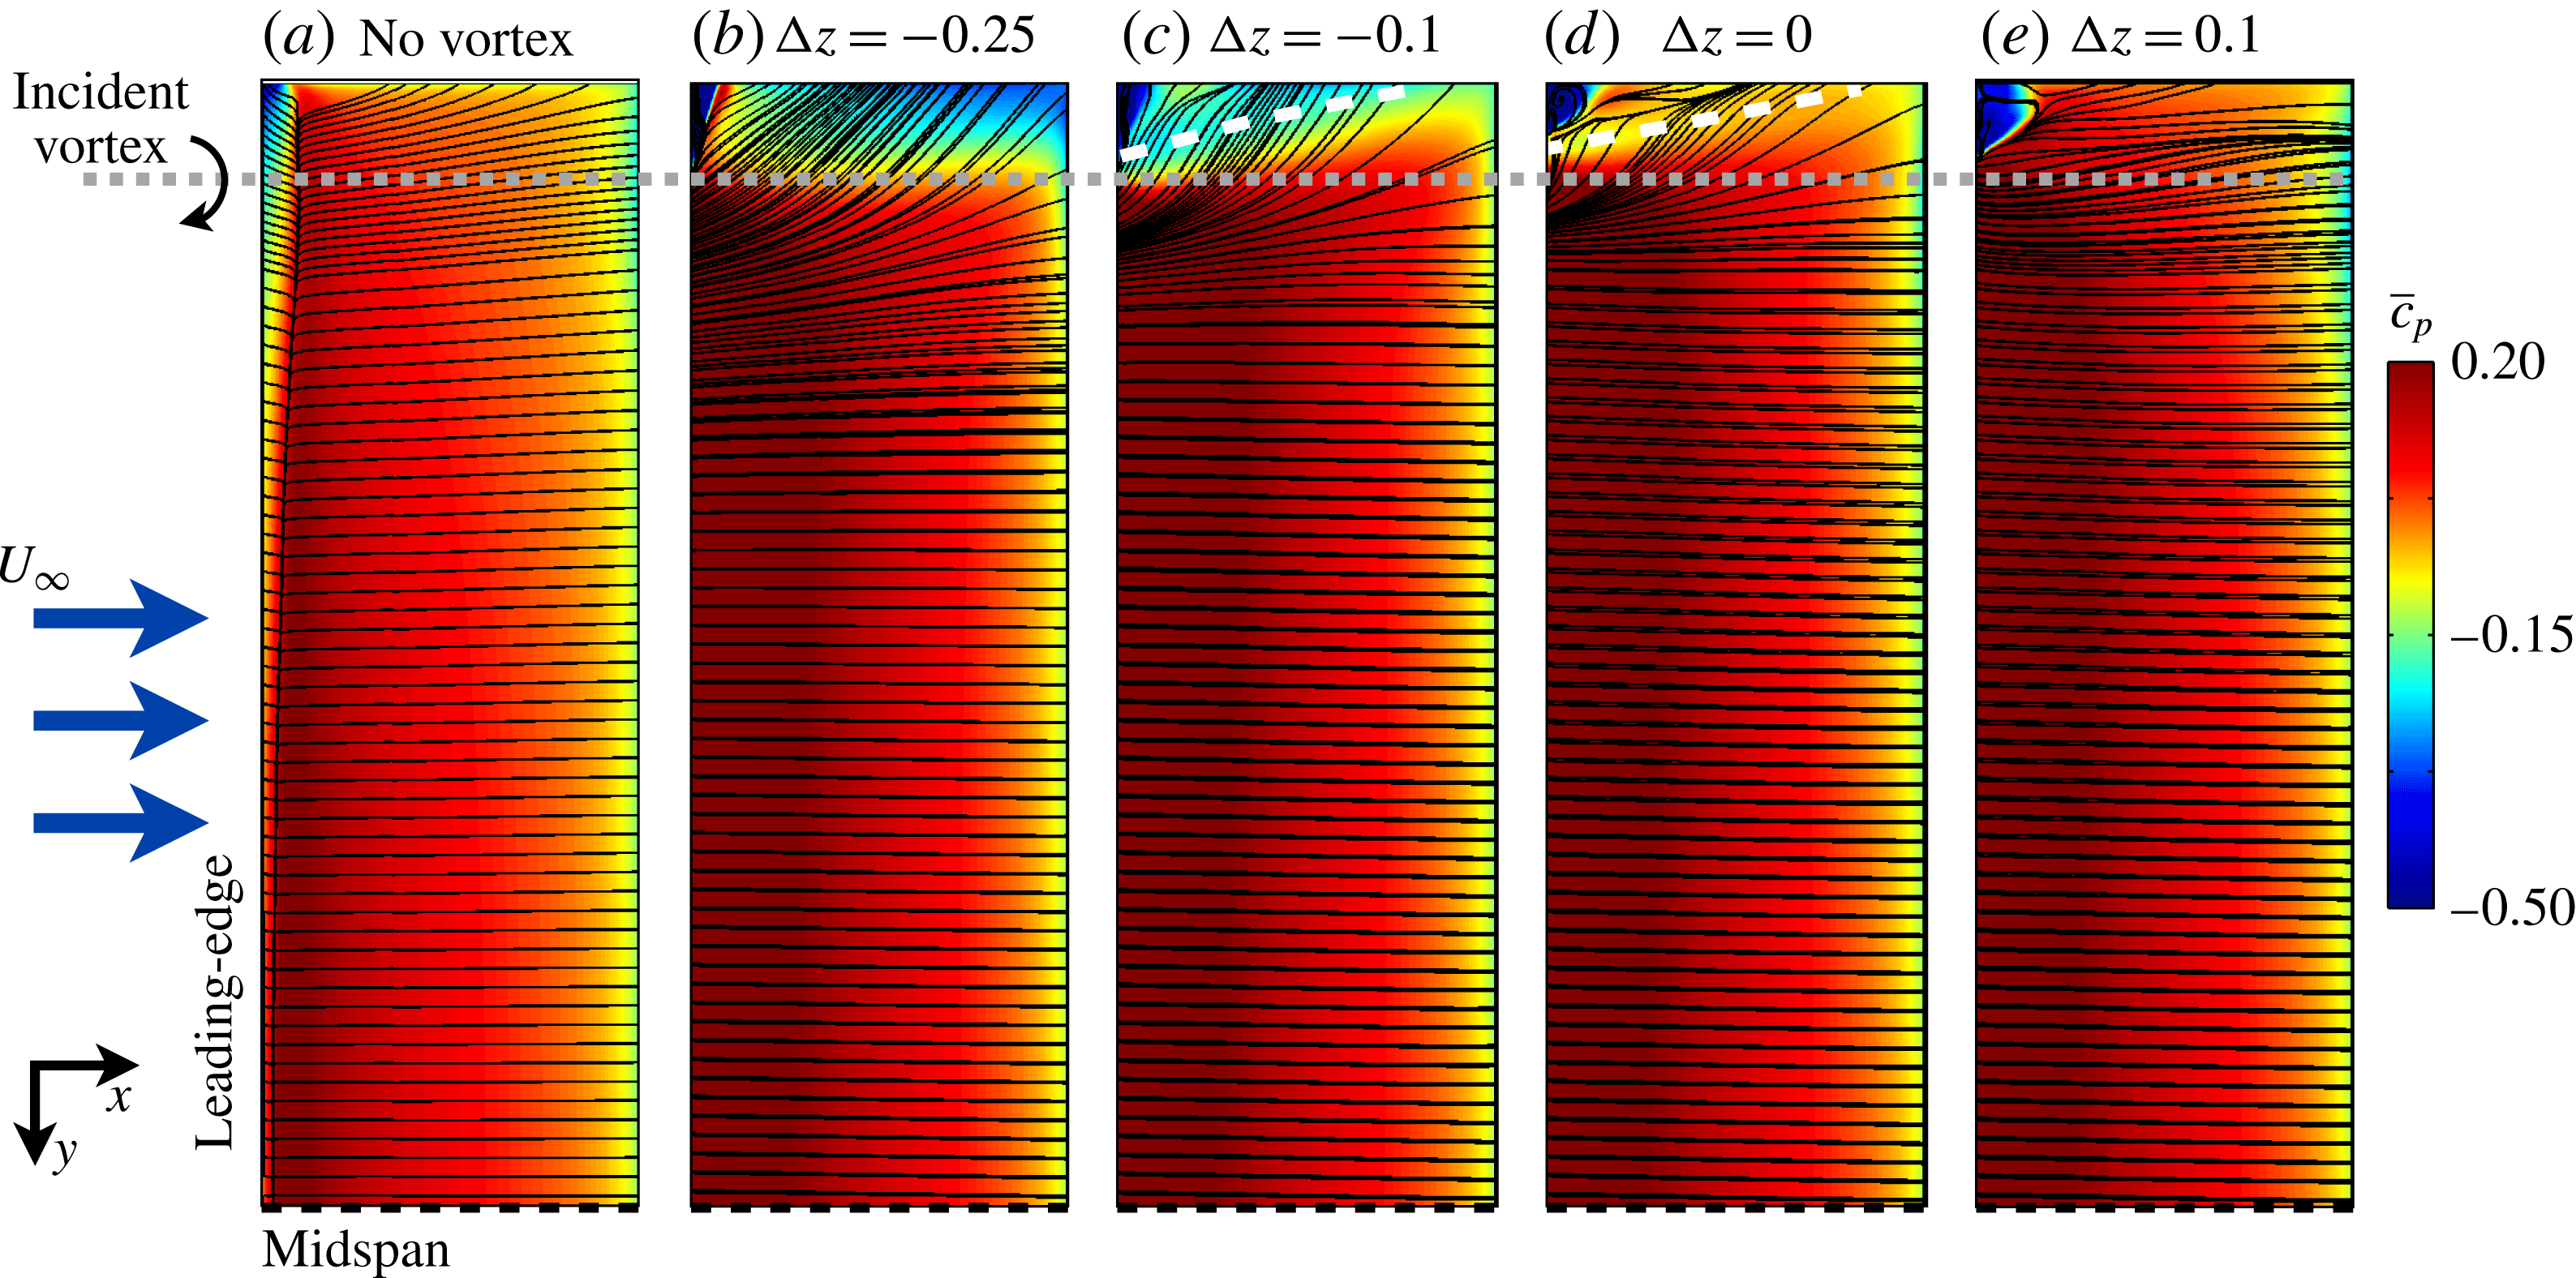
Figure 17. Contours of pressure-side mean-squared surface pressure fluctuations.

Figure 18. Contours of time-mean pressure-side
 $C_{p}$
and surface-restricted streamlines.
$C_{p}$
and surface-restricted streamlines.
Vertical offset has more significant implications for the unsteady loading as demonstrated by the root-mean-square rolling moment fluctuations
 $C_{M_{x,RMS}}$
portrayed in figure 16(c).
$C_{M_{x,RMS}}$
portrayed in figure 16(c).
 $C_{M_{x,RMS}}$
is largest for the
$C_{M_{x,RMS}}$
is largest for the
 ${\rm\Delta}z/c=-0.1$
case consistent with enhancement of lower-surface pressure fluctuations, figure 17(c), provided by the most unstable incident vortex. Increasing the vertical position to a direct impingement,
${\rm\Delta}z/c=-0.1$
case consistent with enhancement of lower-surface pressure fluctuations, figure 17(c), provided by the most unstable incident vortex. Increasing the vertical position to a direct impingement,
 ${\rm\Delta}z/c=0$
, reduces rolling moment fluctuations as the instability begins to attenuate. A decrease in
${\rm\Delta}z/c=0$
, reduces rolling moment fluctuations as the instability begins to attenuate. A decrease in
 $C_{M_{x,RMS}}$
appears between the direct-impingement case,
$C_{M_{x,RMS}}$
appears between the direct-impingement case,
 ${\rm\Delta}z/c=0$
, and the small positive offset,
${\rm\Delta}z/c=0$
, and the small positive offset,
 ${\rm\Delta}z/c=+0.05$
, cases where the upstream vortex instability disappears.
${\rm\Delta}z/c=+0.05$
, cases where the upstream vortex instability disappears.
 $C_{M_{x,RMS}}$
increases between the
$C_{M_{x,RMS}}$
increases between the
 ${\rm\Delta}z/c=+0.05$
and
${\rm\Delta}z/c=+0.05$
and
 $+0.1$
cases but remains below values for vortex positions that experience upstream instability. The increase in
$+0.1$
cases but remains below values for vortex positions that experience upstream instability. The increase in
 $C_{M_{x,RMS}}$
between the two positive vertical offset cases (
$C_{M_{x,RMS}}$
between the two positive vertical offset cases (
 ${\rm\Delta}z/c=+0.05$
and
${\rm\Delta}z/c=+0.05$
and
 $+0.1$
) is likely a consequence of a growing suction-side vortex instability visible in figure 12. The lowest rolling moment fluctuations occur for the
$+0.1$
) is likely a consequence of a growing suction-side vortex instability visible in figure 12. The lowest rolling moment fluctuations occur for the
 ${\rm\Delta}z/c=-0.25$
case which have dropped to values close to the isolated wing due to a weaker interaction and reduced instability.
${\rm\Delta}z/c=-0.25$
case which have dropped to values close to the isolated wing due to a weaker interaction and reduced instability.
The time-mean pressure-side surface-restricted streamlines and
 $\overline{c}_{p}$
contours in figure 18 help to differentiate the aerodynamic loading between each case. The imprint of the pressure-side incident vortex component is visible for the
$\overline{c}_{p}$
contours in figure 18 help to differentiate the aerodynamic loading between each case. The imprint of the pressure-side incident vortex component is visible for the
 ${\rm\Delta}z/c=0$
case as a band of decreased pressure near the wingtip and traced by a dashed white line. This locally increased suction strengthens in the presence of the more dominant lower-surface component for the
${\rm\Delta}z/c=0$
case as a band of decreased pressure near the wingtip and traced by a dashed white line. This locally increased suction strengthens in the presence of the more dominant lower-surface component for the
 ${\rm\Delta}z/c=-0.1$
case. Both of these vertical offsets exhibit a streamline pattern that tends more outboard than that for the isolated wing and, as previously discussed, is consistent with the self-induced velocity between a vortex and its mirror-image in the wing surface. The band of suction disappears for
${\rm\Delta}z/c=-0.1$
case. Both of these vertical offsets exhibit a streamline pattern that tends more outboard than that for the isolated wing and, as previously discussed, is consistent with the self-induced velocity between a vortex and its mirror-image in the wing surface. The band of suction disappears for
 ${\rm\Delta}z/c=+0.1$
, which lacks a pressure-side vortex component. A small low-pressure region appears for the
${\rm\Delta}z/c=+0.1$
, which lacks a pressure-side vortex component. A small low-pressure region appears for the
 ${\rm\Delta}z/c=+0.1$
case near the leading edge wingtip due to flow separation induced by vortex downwash. The larger offset of the
${\rm\Delta}z/c=+0.1$
case near the leading edge wingtip due to flow separation induced by vortex downwash. The larger offset of the
 ${\rm\Delta}z/c=-0.25$
case elicits a streamline pattern that tends outboard, again consistent with mirror-image effects of the wing surface. Outboard acceleration of the flow due to the orientation of the vortex relative to the surface induces a relatively strong suction region near the wingtip. Being located a large distance from the midspan, this feature helps to partially counteract the induced rolling moment, shown in figure 16(b), compared to the other cases while retaining much of the
${\rm\Delta}z/c=-0.25$
case elicits a streamline pattern that tends outboard, again consistent with mirror-image effects of the wing surface. Outboard acceleration of the flow due to the orientation of the vortex relative to the surface induces a relatively strong suction region near the wingtip. Being located a large distance from the midspan, this feature helps to partially counteract the induced rolling moment, shown in figure 16(b), compared to the other cases while retaining much of the
 $L/D$
benefit.
$L/D$
benefit.

Figure 19. An iso-surface of instantaneous
 $Q$
-criterion for (a,c,e) top and (b,d,f) bottom views for (a,b)
$Q$
-criterion for (a,c,e) top and (b,d,f) bottom views for (a,b)
 $r_{v}/c=0.05$
, (c,d)
$r_{v}/c=0.05$
, (c,d)
 $r_{v}/c=0.10$
and (e,f)
$r_{v}/c=0.10$
and (e,f)
 $r_{v}/c=0.15$
, all positioned at
$r_{v}/c=0.15$
, all positioned at
 ${\rm\Delta}z/c=0$
.
${\rm\Delta}z/c=0$
.
6 Effect of vortex size
To further explore the ramifications of vortex–surface interaction, the effect of vortex size is evaluated in this section using two additional radii of
 $r_{v}/c=0.05$
and
$r_{v}/c=0.05$
and
 $0.15c$
in addition to the nominal size of
$0.15c$
in addition to the nominal size of
 $r_{v}/c=0.1$
discussed previously, all positioned at
$r_{v}/c=0.1$
discussed previously, all positioned at
 ${\rm\Delta}z/c=0$
. The initial swirl ratio of
${\rm\Delta}z/c=0$
. The initial swirl ratio of
 $q_{o}=2$
and velocity deficit of
$q_{o}=2$
and velocity deficit of
 ${\rm\Delta}u=0.4$
remain unchanged between cases. It should be noted that a larger core size provides a broader region of vortex-induced increase in angle of attack on the inboard side which enlarges the separation region above the wing, while the opposite is true for the smaller core size.
${\rm\Delta}u=0.4$
remain unchanged between cases. It should be noted that a larger core size provides a broader region of vortex-induced increase in angle of attack on the inboard side which enlarges the separation region above the wing, while the opposite is true for the smaller core size.
Figure 19 shows top and bottom views of the instantaneous flow structure using an iso-surface of instantaneous
 $Q$
-criterion for each core size. Compared to the baseline
$Q$
-criterion for each core size. Compared to the baseline
 $r_{v}/c=0.1$
vortex, the larger radius,
$r_{v}/c=0.1$
vortex, the larger radius,
 $r_{v}/c=0.15$
in figure 19(e,f), experiences a more severe influence from the wing where a similar spiral instability initiates much further upstream. This effect is better quantified by the spectra of turbulent kinetic energy sampled at three different streamwise locations upstream of the leading edge in figure 20. Energy is concentrated at a lower dominant peak,
$r_{v}/c=0.15$
in figure 19(e,f), experiences a more severe influence from the wing where a similar spiral instability initiates much further upstream. This effect is better quantified by the spectra of turbulent kinetic energy sampled at three different streamwise locations upstream of the leading edge in figure 20. Energy is concentrated at a lower dominant peak,
 $St_{c}=0.7$
, and several orders of magnitude larger than for the
$St_{c}=0.7$
, and several orders of magnitude larger than for the
 $r_{v}/c=0.1$
case at
$r_{v}/c=0.1$
case at
 $x/c=-0.45$
. The increase in instability for this vortex is likely a result of the broader region of the wing experiencing an induced increase in angle of attack noted previously. The enhanced separation provides for an effectively larger obstruction from the perspective of the incident vortex which results in an enhanced feedback from the wing. The resulting streamwise attenuation of axial velocity in the vortex core diminishes the swirl ratio below the stability threshold much sooner than for
$x/c=-0.45$
. The increase in instability for this vortex is likely a result of the broader region of the wing experiencing an induced increase in angle of attack noted previously. The enhanced separation provides for an effectively larger obstruction from the perspective of the incident vortex which results in an enhanced feedback from the wing. The resulting streamwise attenuation of axial velocity in the vortex core diminishes the swirl ratio below the stability threshold much sooner than for
 $r_{v}/c=0.1$
, portrayed in figure 21, consistent with the early onset of the vortex spiral.
$r_{v}/c=0.1$
, portrayed in figure 21, consistent with the early onset of the vortex spiral.
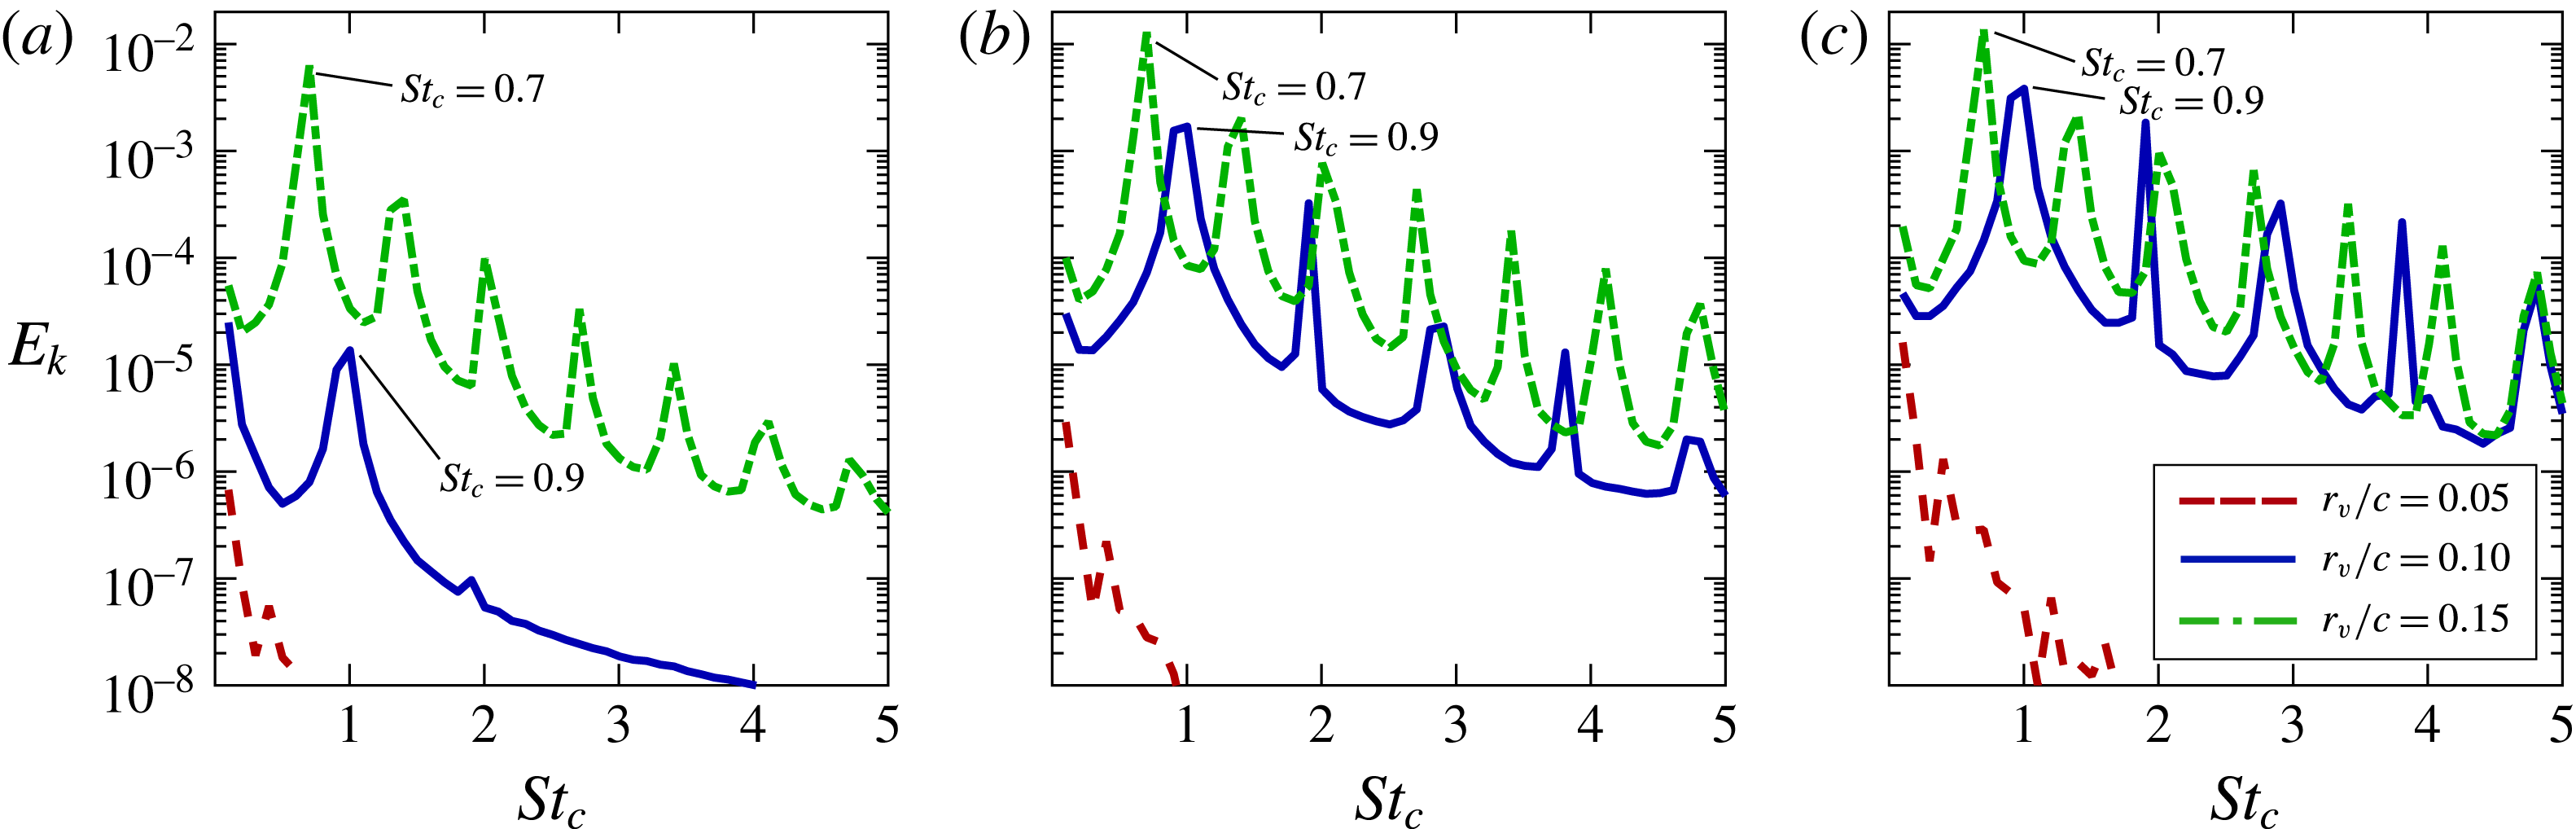
Figure 20. Turbulent kinetic energy spectra for several
 $r_{v}$
placed at
$r_{v}$
placed at
 ${\rm\Delta}z/c=0$
measured at several streamwise locations: (a)
${\rm\Delta}z/c=0$
measured at several streamwise locations: (a)
 $x/c=-0.45$
, (b)
$x/c=-0.45$
, (b)
 $x/c=-0.25$
and (c)
$x/c=-0.25$
and (c)
 $x/c=-0.10$
.
$x/c=-0.10$
.

Figure 21. Effect of core size on streamwise variation of swirl ratio,
 $q$
, for several
$q$
, for several
 $r_{v}$
at
$r_{v}$
at
 ${\rm\Delta}z/c=0$
.
${\rm\Delta}z/c=0$
.
Decreasing the vortex size, as in
 $r_{v}/c=0.05$
shown in figure 19(a,b), has an opposite effect in which the vortex core fails to develop a clear instability upstream of the leading edge. Rather, the vortex appears to divert primarily over the suction side of the wing, figure 19(a), with a small portion splitting along the lower surface, figure 19(b). This lack of instability is further demonstrated in the frequency spectra of turbulent kinetic energy, shown in figure 20(c), which lacks any clearly defined peak upstream of the leading edge measured as close as
$r_{v}/c=0.05$
shown in figure 19(a,b), has an opposite effect in which the vortex core fails to develop a clear instability upstream of the leading edge. Rather, the vortex appears to divert primarily over the suction side of the wing, figure 19(a), with a small portion splitting along the lower surface, figure 19(b). This lack of instability is further demonstrated in the frequency spectra of turbulent kinetic energy, shown in figure 20(c), which lacks any clearly defined peak upstream of the leading edge measured as close as
 $x/c=-0.1$
. Contrary to the
$x/c=-0.1$
. Contrary to the
 $r_{v}/c=0.15$
case, the reduced core size provides a narrower region of interaction with the wing and therefore diminished feedback in the form of an adverse pressure gradient. This culminates in the vortex crossing the stability threshold much later in figure 21 than the larger core sizes.
$r_{v}/c=0.15$
case, the reduced core size provides a narrower region of interaction with the wing and therefore diminished feedback in the form of an adverse pressure gradient. This culminates in the vortex crossing the stability threshold much later in figure 21 than the larger core sizes.
The lack of instability despite the swirl ratio falling beneath the linear stability threshold is interesting to note. A smaller radius proportionately decreases the vortex Reynolds number,
 $Re_{v}=r_{v}{\rm\Delta}u/{\it\nu}$
, indicating a more significant influence of viscosity. Because viscosity is typically stabilizing (Wu, Ma & Zhou Reference Wu, Ma and Zhou2006) it is increasingly likely to support a stable vortex within the linearly unstable regime as
$Re_{v}=r_{v}{\rm\Delta}u/{\it\nu}$
, indicating a more significant influence of viscosity. Because viscosity is typically stabilizing (Wu, Ma & Zhou Reference Wu, Ma and Zhou2006) it is increasingly likely to support a stable vortex within the linearly unstable regime as
 $r_{v}$
decreases.
$r_{v}$
decreases.
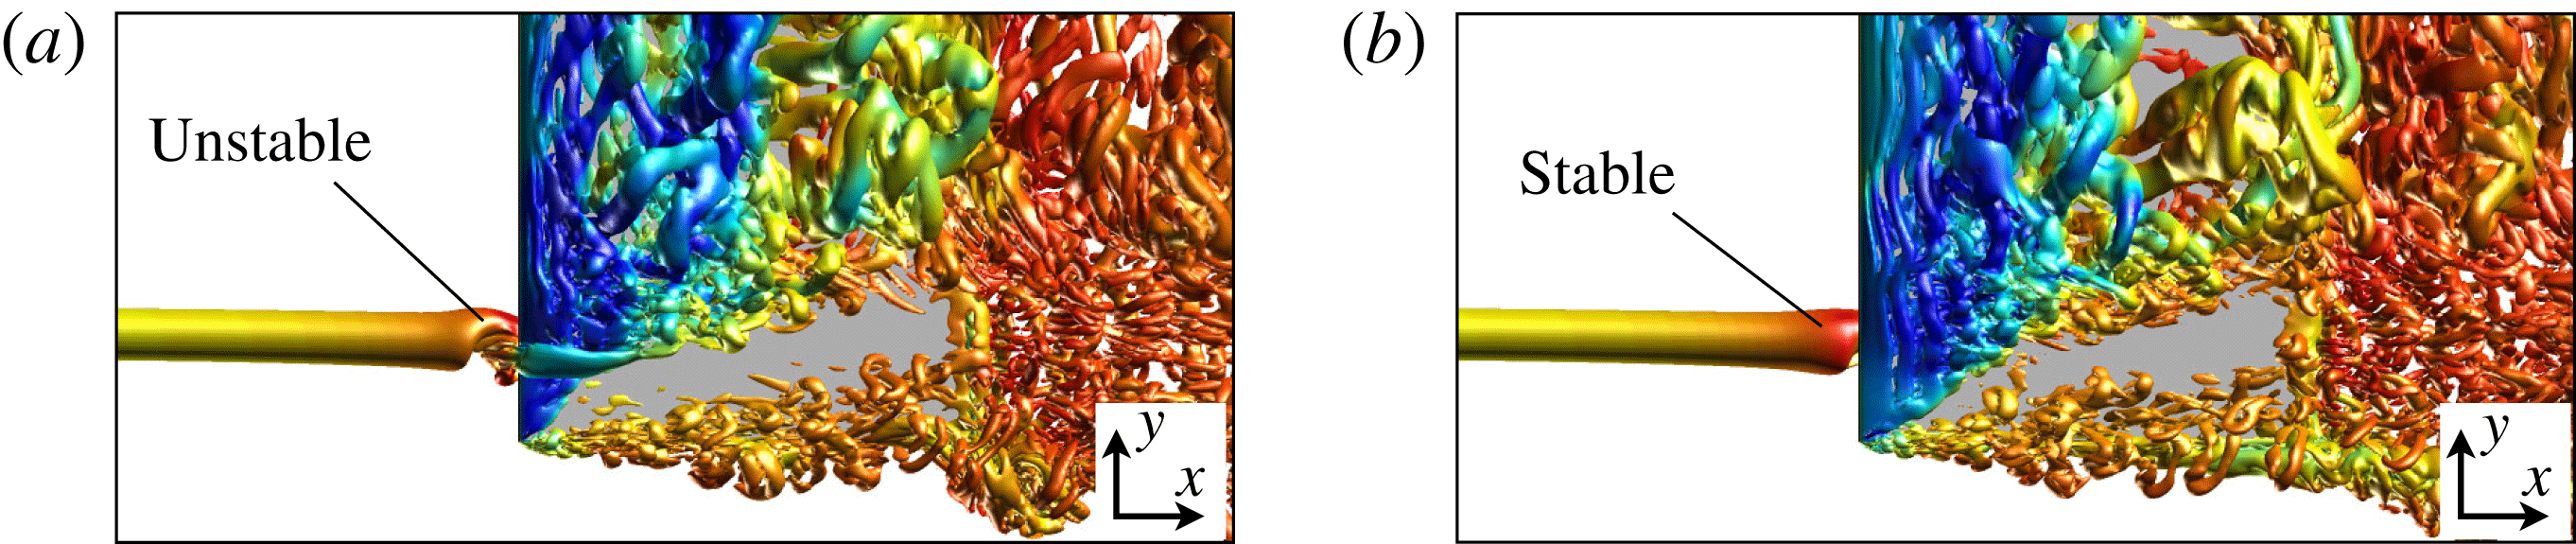
Figure 22. An iso-surface of instantaneous
 $Q$
-criterion (
$Q$
-criterion (
 $Q=15$
) for a vortex radius of
$Q=15$
) for a vortex radius of
 $r_{v}/c=0.05$
positioned at (a)
$r_{v}/c=0.05$
positioned at (a)
 ${\rm\Delta}z/c=-0.05$
and (b)
${\rm\Delta}z/c=-0.05$
and (b)
 ${\rm\Delta}z/c=-0.1$
.
${\rm\Delta}z/c=-0.1$
.

Figure 23. Effect of vertical position for a vortex radius of
 $r_{v}/c=0.05$
: (a) turbulent kinetic energy spectra at
$r_{v}/c=0.05$
: (a) turbulent kinetic energy spectra at
 $x/c=-0.10$
and (b) streamwise variation of swirl ratio,
$x/c=-0.10$
and (b) streamwise variation of swirl ratio,
 $q$
.
$q$
.
The
 $r_{v}/c=0.05$
case was evaluated at two additional offsets of
$r_{v}/c=0.05$
case was evaluated at two additional offsets of
 ${\rm\Delta}z/c=-0.05$
and
${\rm\Delta}z/c=-0.05$
and
 $-0.1$
in order to reveal the effect of vertical positioning on the smaller core size. The instantaneous flow structure for these cases is compared in figure 22 using an iso-surface of
$-0.1$
in order to reveal the effect of vertical positioning on the smaller core size. The instantaneous flow structure for these cases is compared in figure 22 using an iso-surface of
 $Q$
-criterion. The
$Q$
-criterion. The
 ${\rm\Delta}z/c=-0.05$
case, shown in figure 22(a), results in a spiral instability just upstream of the leading edge. The frequency spectra in figure 23(a) demonstrate a general increase in energy content with a clearly defined peak at a higher frequency of
${\rm\Delta}z/c=-0.05$
case, shown in figure 22(a), results in a spiral instability just upstream of the leading edge. The frequency spectra in figure 23(a) demonstrate a general increase in energy content with a clearly defined peak at a higher frequency of
 $St_{c}=1.3$
associated with the helical instability. A further shift to the pressure side, as in
$St_{c}=1.3$
associated with the helical instability. A further shift to the pressure side, as in
 ${\rm\Delta}z/c=-0.1$
, again removes instability upstream of the wing. The swirl ratio, shown in figure 23(b), drops beneath the linear stability threshold at some point upstream of the leading edge for all three cases. Notably, variations in swirl ratio for the
${\rm\Delta}z/c=-0.1$
, again removes instability upstream of the wing. The swirl ratio, shown in figure 23(b), drops beneath the linear stability threshold at some point upstream of the leading edge for all three cases. Notably, variations in swirl ratio for the
 ${\rm\Delta}z/c=-0.05$
and
${\rm\Delta}z/c=-0.05$
and
 $-0.1$
cases are nearly identical despite the very different upstream behaviours visible in figure 22. This indicates that the relative position of the vortex appears to play an important role in not only modifying the stability characteristics upstream of the wing, but also in terms of exciting instabilities within the unstable regime. The closely positioned vortex at
$-0.1$
cases are nearly identical despite the very different upstream behaviours visible in figure 22. This indicates that the relative position of the vortex appears to play an important role in not only modifying the stability characteristics upstream of the wing, but also in terms of exciting instabilities within the unstable regime. The closely positioned vortex at
 ${\rm\Delta}z/c=-0.05$
results in a strong interaction with the wing which perturbs the vortex sufficiently to overcome the stabilizing effects of viscosity and develop hydrodynamic instability. The weaker interaction at
${\rm\Delta}z/c=-0.05$
results in a strong interaction with the wing which perturbs the vortex sufficiently to overcome the stabilizing effects of viscosity and develop hydrodynamic instability. The weaker interaction at
 ${\rm\Delta}z/c=-0.1$
is not sufficient to facilitate a significant growth of unstable modes.
${\rm\Delta}z/c=-0.1$
is not sufficient to facilitate a significant growth of unstable modes.
Figure 24 shows the temporal variation of the spiral instability for the three core sizes where iso-surfaces of streamwise vorticity were extracted at several fixed streamwise locations over
 ${\it\tau}=10$
characteristic times. The
${\it\tau}=10$
characteristic times. The
 $x$
-axis represents time while the
$x$
-axis represents time while the
 $y$
-axis is the spanwise direction. This figure demonstrates changes to the unsteady core structure as the vortex approaches the wing. All three core sizes follow a similar development of spiral instability, but reach the wing at different stages. The largest core size, depicted in figure 24(c), shows the most complete progression of unsteady behaviour. For this case, the vortex initially develops a region of diminished positive vorticity along its axis at
$y$
-axis is the spanwise direction. This figure demonstrates changes to the unsteady core structure as the vortex approaches the wing. All three core sizes follow a similar development of spiral instability, but reach the wing at different stages. The largest core size, depicted in figure 24(c), shows the most complete progression of unsteady behaviour. For this case, the vortex initially develops a region of diminished positive vorticity along its axis at
 $x/c=-0.75$
, similar to the time mean flow for the
$x/c=-0.75$
, similar to the time mean flow for the
 $r_{v}/c=0.1$
,
$r_{v}/c=0.1$
,
 ${\rm\Delta}z/c=0$
case in figure 7. The initial stages of instability are visible at this streamwise location which appears as small undulations in the hollowed-out core. Moving closer to the wing,
${\rm\Delta}z/c=0$
case in figure 7. The initial stages of instability are visible at this streamwise location which appears as small undulations in the hollowed-out core. Moving closer to the wing,
 $x/c=-0.45$
, the ring of positive vorticity begins to unravel into the spiral form while the diminished region of vorticity along the axis becomes a second spiral of oppositely signed vorticity but of much smaller magnitude. This secondary helix lags behind the dominant spiral as it revolves around the axis. At
$x/c=-0.45$
, the ring of positive vorticity begins to unravel into the spiral form while the diminished region of vorticity along the axis becomes a second spiral of oppositely signed vorticity but of much smaller magnitude. This secondary helix lags behind the dominant spiral as it revolves around the axis. At
 $x/c=-0.25$
the instability advances to a well-defined spiral and continues to expand in diameter as it approaches the leading edge at
$x/c=-0.25$
the instability advances to a well-defined spiral and continues to expand in diameter as it approaches the leading edge at
 $x/c=-0.1$
.
$x/c=-0.1$
.

Figure 24. Temporal variation of streamwise vorticity at several streamwise positions (top-down view) using iso-surfaces of
 ${\it\omega}_{x}c/U_{\infty }$
: (a)
${\it\omega}_{x}c/U_{\infty }$
: (a)
 ${\rm\Delta}z/c=-0.05$
,
${\rm\Delta}z/c=-0.05$
,
 $r_{v}/c=0.05$
, (b)
$r_{v}/c=0.05$
, (b)
 ${\rm\Delta}z/c=0$
,
${\rm\Delta}z/c=0$
,
 $r_{v}/c=0.10$
and (c)
$r_{v}/c=0.10$
and (c)
 ${\rm\Delta}z/c=0$
,
${\rm\Delta}z/c=0$
,
 $r_{v}/c=0.15$
.
$r_{v}/c=0.15$
.
7 Effect of axial velocity profile
Finally, two additional simulations were conducted in order to evaluate the effects of the axial velocity. The core size and tangential velocity profiles are unchanged from the baseline
 $r_{v}/c=0.1$
wake-like vortex described in § 5. Only the axial velocity profile is modified in this section and by extension the initial swirl ratio. The first case is a Lamb–Oseen vortex in which the axial velocity profile is uniform with the freestream resulting in an infinite swirl ratio,
$r_{v}/c=0.1$
wake-like vortex described in § 5. Only the axial velocity profile is modified in this section and by extension the initial swirl ratio. The first case is a Lamb–Oseen vortex in which the axial velocity profile is uniform with the freestream resulting in an infinite swirl ratio,
 $q_{o}=\infty$
. The second case is a jet-like
$q_{o}=\infty$
. The second case is a jet-like
 $q$
-vortex in which the Gaussian streamwise velocity profile is reversed providing a
$q$
-vortex in which the Gaussian streamwise velocity profile is reversed providing a
 ${\rm\Delta}u=-0.4$
excess relative to the freestream. This choice provides the same initial swirl ratio as the baseline wake-like vortex of
${\rm\Delta}u=-0.4$
excess relative to the freestream. This choice provides the same initial swirl ratio as the baseline wake-like vortex of
 $q_{o}=2$
. Both of the new vortices are placed in a direct impingement with an initial vertical position of
$q_{o}=2$
. Both of the new vortices are placed in a direct impingement with an initial vertical position of
 ${\rm\Delta}z/c=0$
.
${\rm\Delta}z/c=0$
.
Figure 25 portrays the streamwise variation of swirl ratio for the jet-like and Lamb–Oseen vortices as they approach the leading edge of the wing alongside the wake-like vortex for comparison. The Lamb–Oseen vortex is shown to decay at an increasing rate toward the leading edge as the upstream influence of the wing strengthens. This case nears the stability threshold without crossing, providing an interaction with the aerodynamic surface in the stable regime. The rapid decay of vortex swirl for this case near the wing suggests the unstable regime is a likely outcome for wake-like vortices of sufficient size for any
 $q_{o}$
. The upstream influence of the wing is opposite for the jet-like vortex in which the decreasing axial velocity excess increases swirl as the vortex nears the wing.
$q_{o}$
. The upstream influence of the wing is opposite for the jet-like vortex in which the decreasing axial velocity excess increases swirl as the vortex nears the wing.
Several views of the instantaneous flow structure are provided for both cases in figure 26 using two transparent iso-surfaces of
 $Q$
-criterion. Contrary to all previous cases experiencing a direct impingement, both vortices remain stable laminar features upstream of the leading edge. Rather than divert to one side of the wing, or alternate between the two sides via spiralling instability, the laminar vortex splits into two branches of positive vorticity before encountering the leading edge. One component of the divided vortex passes over the upper surface and becomes susceptible to disturbances provided by the separated transitional flow on the inboard side. This behaviour is similar in nature to that observed for the baseline
$Q$
-criterion. Contrary to all previous cases experiencing a direct impingement, both vortices remain stable laminar features upstream of the leading edge. Rather than divert to one side of the wing, or alternate between the two sides via spiralling instability, the laminar vortex splits into two branches of positive vorticity before encountering the leading edge. One component of the divided vortex passes over the upper surface and becomes susceptible to disturbances provided by the separated transitional flow on the inboard side. This behaviour is similar in nature to that observed for the baseline
 ${\rm\Delta}z/c=+0.1$
case. A second, smaller portion of the vortex passes beneath the wing. In a similar fashion, this component interacts with transitional flow emerging from downwash induced separation on the outboard side of the vortex. Both sides of the jet-like vortex appear to be more susceptible to disturbances compared to the Lamb–Oseen case.
${\rm\Delta}z/c=+0.1$
case. A second, smaller portion of the vortex passes beneath the wing. In a similar fashion, this component interacts with transitional flow emerging from downwash induced separation on the outboard side of the vortex. Both sides of the jet-like vortex appear to be more susceptible to disturbances compared to the Lamb–Oseen case.

Figure 25. Effect of axial velocity profile on streamwise variation of swirl ratio,
 $q$
.
$q$
.

Figure 26. Instantaneous flow structure using iso-surfaces of
 $Q$
-criterion (
$Q$
-criterion (
 $Q=20$
in blue and
$Q=20$
in blue and
 $Q=5$
in grey) for (a,c,e) Lamb–Oseen vortex and (b,d,f) jet-like vortex.
$Q=5$
in grey) for (a,c,e) Lamb–Oseen vortex and (b,d,f) jet-like vortex.
8 Summary
In this work, an
 $AR=6$
flat plate wing operating at a Reynolds number of
$AR=6$
flat plate wing operating at a Reynolds number of
 $Re_{c}=30\,000$
and
$Re_{c}=30\,000$
and
 ${\it\alpha}=5^{\circ }$
angle of attack was subjected to a stable, laminar wake-like
${\it\alpha}=5^{\circ }$
angle of attack was subjected to a stable, laminar wake-like
 $q$
-vortex superimposed upstream of the leading edge. The incident streamwise vortex was positioned
$q$
-vortex superimposed upstream of the leading edge. The incident streamwise vortex was positioned
 ${\rm\Delta}y/c=0.25$
inboard from the wingtip. Exploration over a range of vertical offsets,
${\rm\Delta}y/c=0.25$
inboard from the wingtip. Exploration over a range of vertical offsets,
 $-0.25\leqslant {\rm\Delta}z/c\leqslant +0.1$
, provided a rich variation in the unsteady fluid dynamics and revealed several characteristic factors that influence vortex–wing interaction.
$-0.25\leqslant {\rm\Delta}z/c\leqslant +0.1$
, provided a rich variation in the unsteady fluid dynamics and revealed several characteristic factors that influence vortex–wing interaction.
When the vortex was aligned with the leading edge, the incident vortex core developed a helical instability upstream of the wing. This feature is distinct from spiral breakdown in that it lacks a stagnation point or flow reversal. This feature has more in common with hydrodynamic instabilities for swirling flows. Placing the vortex a small distance beneath the wing caused the instability to become much more pronounced and initiate further upstream. Moving the vortex slightly above the wing removed the upstream instability in the incident vortex.
The onset or lack of stability in the vortex was found to be related to the pressure gradients experienced at different vertical positions. Direct impingement and negative vertical offsets, in which vortex instability manifested, subjected the incident vortex to adverse pressure gradients that tended to enhance the axial velocity deficit in the incident vortex core. This effect reduced the swirl ratio of the initially stable, laminar
 $q$
-vortex into its linearly unstable regime permitting the growth of short-wavelength perturbations. The onset of helical instability in each case became visible a short distance downstream from where the incident vortex entered the unstable regime. Placing the vortex slightly above the wing, which removed instability, aligned the vortex with the favourable pressure gradient provided by the acceleration of flow over the leading edge. This favourable gradient preserved axial velocity and stretched the vortex enhancing the tangential velocity component – both effects facilitating a stable value for the swirl ratio. Adverse pressure gradients above the wing as the vortex approached the trailing edge appeared to promote the growth of suction-side instabilities in the streamwise vortex for the positive vertical offset.
$q$
-vortex into its linearly unstable regime permitting the growth of short-wavelength perturbations. The onset of helical instability in each case became visible a short distance downstream from where the incident vortex entered the unstable regime. Placing the vortex slightly above the wing, which removed instability, aligned the vortex with the favourable pressure gradient provided by the acceleration of flow over the leading edge. This favourable gradient preserved axial velocity and stretched the vortex enhancing the tangential velocity component – both effects facilitating a stable value for the swirl ratio. Adverse pressure gradients above the wing as the vortex approached the trailing edge appeared to promote the growth of suction-side instabilities in the streamwise vortex for the positive vertical offset.
Incident vortex behaviour was shown to provide a significant impact to the unsteady loads experienced by the wing. The more pronounced instability elicited by a negative offset increased the rolling moment fluctuations while the stabilizing effects of a small positive offset reduced the overall fluctuations of the rolling moment. The range of vertical offsets explored produced fairly little change in the time-mean lift or drag, suggesting the choice of vertical position is dictated by its unsteady load characteristics rather than optimization of aerodynamic benefit. The rolling moment is influenced by vertical positioning where suction imposed by the vortex passing beneath the wing helps to counteract some of the vortex-induced moment. If a streamwise vortex were to be intentionally encountered in the context of formation flight, a weaker interaction may be beneficial. The
 ${\rm\Delta}z=-0.25$
case produced comparable aerodynamic benefits to the closer positions with markedly diminished rolling moment fluctuations and trim penalty.
${\rm\Delta}z=-0.25$
case produced comparable aerodynamic benefits to the closer positions with markedly diminished rolling moment fluctuations and trim penalty.
Exploration of core size demonstrated that larger vortices experience a stronger feedback effect from the wing along with earlier onset of instability, while smaller size vortices were less affected. The frequency of instability varied inversely with the core size. A small core vortex was capable of retaining stability in the unstable regime where stability characteristics are likely augmented by viscosity. A stronger interaction with the aerodynamic surface demonstrated that the small vortex is still susceptible to disturbances.
In addition to the wake-like vortex, jet-like and zero-velocity deficit (Lamb–Oseen vortex) cases were considered. The stability characteristics of the jet-like vortex were enhanced as the velocity excess diminished approaching the wing, increasing swirl near the wing. The initially large swirl ratio for the Lamb–Oseen vortex decayed rapidly near the leading edge and approached the unstable regime. Both cases encountered the leading edge in the stable regime for the
 $q$
-vortex, revealing a second outcome for a direct impingement in streamwise-oriented vortex interactions. Rather than alternate between the two sides of the wing via spiralling instability or divert to either side of the wing, the vortex splits into two branches shortly upstream of the leading edge.
$q$
-vortex, revealing a second outcome for a direct impingement in streamwise-oriented vortex interactions. Rather than alternate between the two sides of the wing via spiralling instability or divert to either side of the wing, the vortex splits into two branches shortly upstream of the leading edge.
These findings motivate further study on this topic. Stronger adverse pressure gradients under more severe conditions, such as a higher Reynolds number or angle of attack, could evolve instabilities into breakdown of the streamwise vortex and elicit harsher buffeting loads. This could occur upstream for direct impingement/negative vertical offset cases or above the wing for a positive vertical offset. Incident vortex behaviour could be modified by adjusting pressure gradient regimes using flow control or wing curvature. The taxonomy of flow regimes exhibited for the stationary vortices in this article are useful for understanding the implications of relative motion between tandem wings or the outcomes of aeroelastic effects of large aspect-ratio wings. For instance, static aeroelastic deformations could facilitate a change in vertical position that shifts the incident swirling flow away from a stable interaction.
Acknowledgements
This work was supported in part by AFOSR under a task monitored by Dr D. Smith, and by a grant of HPC time from the DoD HPC Major Shared Resource Center at AFRL, WPAFB.
Supplementary movie
Supplementary movie is available at http://dx.doi.org/10.1017/jfm.2016.320.