


Introduction
At present, depression is diagnosed by medical practitioners in both primary and secondary medical care settings. The diagnostic criteria are subjective: the patient's symptoms are evaluated during a clinical interview (American Psychiatric Association, 2013; National Institute for Health and Care Excellence, 2009). Major depressive disorder (MDD) remains a challenge for reliable diagnosis and evidence indicates a relatively low rate of diagnostic agreement between specialists (Freedman et al., Reference Freedman, Lewis, Michels, Pine, Schultz, Tamminga and Yager2013). This is in part because MDD ranges from mild illness which merges with normal experience, to moderate illness, to gravely ill patients, while the DSM (Diagnostic and Statistical Manual of Mental Disorders) does not capture this distinction. MDD also often co-occurs with anxiety and this can cause diagnostic confusion. Over the past decade, many studies have attempted automated diagnostic classification of depression in standardised settings with machine learning methods and neuroimaging data. Very good results – depression detection accuracies up to 90% – have been achieved with brain structural measures (Johnston, Steele, Tolomeo, Christmas, & Matthews, Reference Johnston, Steele, Tolomeo, Christmas and Matthews2015; Mwangi, Ebmeier, Matthews, & Steele, Reference Mwangi, Ebmeier, Matthews and Steele2012), brain functional connectivity measures (Wei et al., Reference Wei, Qin, Yan, Li, Yao and Lu2013; Zeng et al., Reference Zeng, Shen, Liu, Wang, Li, Fang and Hu2012), and task-related activation measures (Johnston, Tolomeo, et al., Reference Johnston, Tolomeo, Gradin, Christmas, Matthews and Steele2015; Rosa et al., Reference Rosa, Portugal, Hahn, Fallgatter, Garrido, Shawe-Taylor and Mourao-Miranda2015). Despite generally promising results (review in Kambeitz et al., Reference Kambeitz, Cabral, Sacchet, Gotlib, Zahn, Serpa and Koutsouleris2017), brain scanning remains logistically expensive and requires technical expertise, which could limit translation of findings to clinical practice (online supplementary section S1.3). In contrast to neuroimaging, some behavioural aspects of depression (‘signs’) can be relatively inexpensive to measure. Studies which applied facial electromyography (EMG) (e.g. Gehricke & Shapiro, Reference Gehricke and Shapiro2000; Rottenberg, Gross, & Gotlib, Reference Rottenberg, Gross and Gotlib2005) or manual face movement ratings (e.g. Renneberg, Heyn, Gebhard, & Bachmann, Reference Renneberg, Heyn, Gebhard and Bachmann2005; Sloan, Strauss, Quirk, & Sajatovic, Reference Sloan, Strauss, Quirk and Sajatovic1997) indicate altered eyebrow, cheek and mouth movements when imagining or viewing affective materials (pictures, scenery or clips) – although the direction of change could be dependent on the experimental conditions and the participant sample. Automated video-based facial behaviour analysis methods have also been applied in several studies to characterise behaviour in clinical interviews (e.g. Girard et al. Reference Girard, Cohn, Mahoor, Mavadati, Hammal and Rosenwald2014; Stratou, Scherer, Gratch, & Morency, Reference Stratou, Scherer, Gratch and Morency2015), but these methods have not yet been used to study reactions to affective material. Changes in eye movements have also been reported, with evidence indicating that patients with depression fixate more often and for longer on negative affective materials and less on positive materials (Armstrong & Olatunji, Reference Armstrong and Olatunji2012; Carvalho et al., Reference Carvalho, Laurent, Noiret, Chopard, Haffen, Bennabi and Vandel2015). Several studies have also been successful at the diagnostic classification of depression with eye movement measures (e.g. Alghowinem, Goecke, Wagner, Parker, & Breakspear, Reference Alghowinem, Goecke, Wagner, Parker and Breakspear2013) or with automated face movement analysis (review in Pampouchidou et al., Reference Pampouchidou, Simos, Marias, Meriaudeau, Yang, Pediaditis and Tsiknakis2019), but only in the context of clinical interviews. In the present study, we aimed to develop an inexpensive system for detecting signs of depression based on combined face and eye movement tracking during cognitive performance with affective distractions. We designed two novel cognitive tasks with affective distraction elements and recorded face and eye movements from a cohort of young non-clinical participants, with or without elevated symptoms of depression – when they performed the cognitive tasks. We then applied a machine learning technique to assess how well the recorded face and eye movement measures could discriminate between symptomatic and non-symptomatic participants. We hypothesised that classification with combined face and eye movement measures may perform better compared to either modality separately. We provide additional rationale for investigating face and eye movement for the detection of depression in section S1 of the online supplementary material.
Methods
Experiment participants
A total of 75 participants were recruited mainly from the student and recent graduate population at the University of Edinburgh. General participant requirements included having normal or corrected to normal vision and either being a native English speaker, or having lived in a mainly English-speaking country and using English as the primary language for the past 7 years. Recruitment criteria for symptomatic participants included low mood and/or loss of interest in daily activities over the past two weeks. Each participant was paid £15 for their participation, which took up to 1.5 hours.
In the first part of the experiment, participants reported their age and caffeine consumption, and then completed Alcohol Use Disorders Identification Test (AUDIT) and Center for Epidemiologic Studies Depression Scale (CES-D) questionnaires, as well as the National Adult Reading Test (NART) (Bright, Jaldow, & Kopelman, Reference Bright, Jaldow and Kopelman2002; Radloff, Reference Radloff1977; Saunders, Aasland, Babor, de la Fuente, & Grant, Reference Saunders, Aasland, Babor, de la Fuente and Grant1993). Caffeine consumption was measured in cups of coffee per day, where one cup of tea was assumed to be equal to half a cup of coffee. Caffeine was measured primarily because it may have an effect on cognitive performance (McLellan, Caldwell, & Lieberman, Reference McLellan, Caldwell and Lieberman2016), although some evidence also indicates that it may be associated with a lower risk for depression (Wang, Shen, Wu, & Zhang, Reference Wang, Shen, Wu and Zhang2016). Participants were classed as symptomatic if they scored strictly above the threshold of 16 in CES-D, and non-symptomatic (control) if they scored strictly below the threshold. Three participants who had the CES-D score exactly at the threshold were excluded from the analyses. CES-D was applied because it is a freely available tool designed to screen for depression symptoms in general population samples such as in our study.
All participants were informed about the course and content of the experiment and provided informed consent. All procedures in the study complied with the Declaration of Helsinki of the World Medical Association, as revised in 2013. The experiment was approved by the School of Informatics Ethics committee at the University of Edinburgh.
Technical setup
The technical setup consisted of a desktop computer, a screen with a keyboard, an eye-tracking device, and a digital camera. A black wall-screen was positioned approximately 1.5 metres behind the participant to provide background for visual recordings.
Screen and response capture
Experimental stimuli were presented on a 21.5 inch (54.6 cm) screen. Participants sat approximately 60 cm to 90 cm from the screen as they felt comfortable. Responses during cognitive tasks were captured using a Hewlett Packard keyboard with four distinctively marked response keys. It should be noted that most consumer keyboards cannot provide millisecond-level timing accuracy and typically have variable response delays between 15 and 40 milliseconds (Plant & Turner, Reference Plant and Turner2009). Response times captured during the experiment were hence accurate only to a limited degree.
Face movement recordings
Digital visual recordings were made with an Intel RealSense SR300 camera (Intel Inc.). The camera was positioned directly on top of the screen and captured the participants' faces. Recordings were made at a resolution of 1280 × 720 with a stable frame rate of 30 frames per second. One block-synchronised recording was made per block of trials for each task. Prior to starting the first cognitive task, participants were asked to keep a neutral face expression for approximately 10 s for a recording of baseline facial expression. This was then used for correction during the analysis stage.
Eye movement tracking
Eye-tracking data were collected using a Gazepoint GP3 eye-tracker (Gazepoint, Canada; Zugal and Pinggera, Reference Zugal, Pinggera, Iliadis, Papazoglou and Pohl2014), which was positioned directly below the screen. Eye-tracking data were sampled at a 60 Hz rate, with the advertised device accuracy between 0.5° and 1°, spatial resolution of 0.1°, and up to 50 ms tracking latency. Gazepoint GP3 remains one of the most accessible and least expensive eye-tracking devices available on the market as of 2019. The device was adjusted manually to each participant's height and five-point calibration was performed before the first cognitive task and between trial blocks if it was necessary due to the participant's head movements. Eye-tracking measures for the different visual elements of the tasks were captured in real-time during task performance, with a 40 ms correction to account for tracking latency.
Cognitive tasks
Two cognitive tasks with affective distractions were developed as part of the study. The Delayed Match to Sample (DMS) task probes working memory, whilst the Rapid Detection (RD) task assesses sustained attention. These two cognitive domains have been reported as compromised in depression (McIntyre et al., Reference McIntyre, Cha, Soczynska, Woldeyohannes, Gallaugher, Kudlow and Baskaran2013; Rock, Roiser, Riedel, & Blackwell, Reference Rock, Roiser, Riedel and Blackwell2014). The number of trials in the tasks was defined to limit the total assessment time to approximately 50 minutes or less.
Delayed match to sample task
During the DMS task, participants were required to memorise an initial sample pattern and then identify it among four alternatives, after a brief delay. Each pattern in the task consisted of four coloured quadrants with variable numbers of white marks in each quadrant. During the 12-second delay stage at each trial, four words flashed at different locations on the screen to distract the participant from their task. An additional distraction word was displayed at the response stage alongside the four patterns. Feedback was given to the participant at each trial to indicate a correct or incorrect response. Task trial structure is illustrated in Fig. 1a and further details can be found in online supplementary section S2.1.

Fig. 1. Single-trial timelines for the DMS task (a) and for the RD task (b).
There were three blocks of trials in the task, with 15 trials in each block (45 trials in total). The first block of trials had neutral distraction words, the second had positive words, and the third featured negative words. The block with negative words was always presented last to avoid carry-over of any effects of negative words between the blocks. Each participant was allowed to have brief breaks to rest between trial blocks. A training sequence with four neutral trials was administered before the first block of trials. Task instructions were read by the experimenter and also appeared on screen in the text before the training block.
Rapid detection task
At each trial of the RD task, participants were first presented with a target letter (target stage), and then required to identify it, by pressing the space key, among 44 letters which flashed on the screen one after another (detection stage). Five target letters were distributed uniformly among others, with the first four letters always non-target. Each letter flashed initially, and then faded away for 1000 ms. Participants received feedback when they correctly detected the target letter, when they missed a target letter, or when they made an erroneous response to a non-target letter. Throughout the detection stage, five words appeared alongside the flashing letters, one at a time, to distract the participant from their task. Five distraction words also flashed at the centre of the screen between the target and detection stages, again to distract participants from the task. RD task trial structure is illustrated in Fig. 1b and further details can be found in online supplementary section S2.2.
As with the DMS task, there were three blocks of trials – neutral first, positive second, and negative third. Each block consisted of five trials, with breaks for rest between the blocks (15 trials in total). A single training trial was administered prior to the first block, together with task instructions. Instructions were read by the experimenter and were also displayed on the screen. Participants were explicitly asked to try and look at each distraction word at least once. If a participant did not look at least at one of the distraction words (according to the eye-tracking readings), a feedback message was displayed at the end of the trial, reminding the participant to try and look at each word. In cases where eye-tracking was inaccurate according to calibration results, participants were notified that feedback may be incorrect.
Affective distractions
In total, 60 neutral, 60 positive and 60 negative distraction words were selected from the Warriner database of 13 915 English lemmas (Warriner, Kuperman, & Brysbaert, Reference Warriner, Kuperman and Brysbaert2013). Section S2.3 in the online supplementary material outlines further details on the selected distraction words.
Recorded measures
Behavioural measures
Mean reaction times (RTs) for correct and error responses, as well as accuracies (correct response rates) were computed for the entire DMS task (45 trials). Mean RTs for correct and error responses were also computed for the entire RD task (15 trials). Detection rates were calculated as percentages of correctly detected target letters. Error counts were computed as numbers of erroneous responses.
Face movement measures
Recordings were segmented (epoched) into time-locked parts related to seven trial stages of the DMS task and six trial stages of the RD task (i.e. sample, distraction, selection, feedback and others). For each epoch, time series of intensities (one measurement per frame, scale from 0 to 5) were extracted for 17 facial action units (AUs) from the Facial Action Coding System (FACS, Ekman, Friesen, & Hager, Reference Ekman, Friesen and Hager2002), using OpenFace toolkit (Baltrusaitis, Mahmoud, & Robinson, Reference Baltrusaitis, Mahmoud and Robinson2015, Reference Baltrusaitis, Robinson and Morency2016). AU intensity time series were baseline-corrected using mean AU intensities from the participant's 10-second baseline recording. After baseline correction three metrics of interest were extracted for each AU in each epoch: (1) maximal AU intensity, (2) average AU intensity above threshold, and (3) duration of AU above threshold. The threshold value was here set to 1 (on the scale from 0 to 5). The second and third metrics correspond to average intensity and duration of AU activity in the epoch. Means of the metrics for each AU in each of the 13 task stages were then calculated, which resulted in 663 facial behaviour measures for each participant (3 metrics × 17 AUs × 13 task stages = 663 measures). AU durations were represented in seconds and AU intensity measures were on the scale from 0 to 5. Missing face-tracking measures – for example when the participant did not make any errors at the DMS or RD tasks – were replaced with value −1. A diagram illustrating facial movement measure extraction can be found in Figure S3 in the online supplementary material.
Eye movement measures
Three eye-tracking metrics were recorded for 17 visual elements in each DMS trial and 15 visual elements in each RD trial. These metrics were: (1) latency of the first eye fixation (since the appearance of the element), (2) count of fixations, and (3) total time when fixated on the element. For each participant, the metrics were averaged across trials, which resulted in 51 measures for the DMS task and 45 measures for the RD task. In addition, differences between metric means in positive and neutral conditions, as well as negative and neutral conditions were calculated, resulting in 24 further measures for the DMS task and 12 further measures for the RD task. Tables S1–S4 in the online supplementary material list eye-tracked elements and metric difference measures for the two tasks.
Classification methods
Feature selection
Overall, there were 663 facial movement and 132 eye-tracking measures for each participant. To improve classification results we performed feature selection using a simple statistical filter – two-sample t test with assumed unequal variances between samples (Welch's t test). Only features which were significantly different between the two classes in the training data at a specified p value threshold were selected for classifier training and testing at each cross-validation iteration (fold) (e.g. see Mwangi, Tian, and Soares, Reference Mwangi, Tian and Soares2014). The p value threshold was optimised using grid search within a nested cross-validation scheme (section S4.1 in online supplementary material).
Classification model
Support vector machine (SVM) with a Gaussian (radial basis function) kernel was used as the classification model in the study (Cortes & Vapnik, Reference Cortes and Vapnik1995). SVM is the most frequently used classification technique in neuroimaging classification studies of depression (Kambeitz et al., Reference Kambeitz, Cabral, Sacchet, Gotlib, Zahn, Serpa and Koutsouleris2017). The classifier has two hyperparameters – regularisation (box constraint) and kernel scale. The regularisation parameter was set to 1 and kernel scale parameter was set to 9 (section S4.2 in online supplementary material). Before classifier training and testing, features were standardised – centred and scaled by feature means and standard deviations in the training data. Classifier training and testing was performed with MATLAB R2018a Statistics and Machine Learning Toolbox (Mathworks Inc.). Alternative classification models were investigated post hoc and results of these analyses are described in sections S4.3 and S6 in the online supplementary material.
Cross-validation
Leave-one-out cross-validation (LOOCV) was used to assess the performance of the classification model for detecting elevated symptoms of depression. Briefly, at each iteration of LOOCV, one data sample (participant) is first excluded from the complete dataset. The classification model is then trained on the remaining data and tested on the excluded sample. This is repeated for each sample and test outcomes are averaged to define an overall predictive accuracy. We opted to perform LOOCV because it has been most widely used in the previous studies (Gao, Calhoun, & Sui, Reference Gao, Calhoun and Sui2018), maximizes the amount of training data, and provides the least biased accuracy estimates (Zhang & Yang, Reference Zhang and Yang2015). Cross-validation can in general be interpreted as within-study replication, as the classification model is trained and tested repeatedly for each participant in the study.
Results
Behavioural performance
Participant sample
The behavioural task performance was assessed in 72 participants (34 symptomatic). Symptomatic and control groups were balanced with respect to gender (18 symptomatic and 18 control female participants). The difference in age approached significance (p = 0.0564, mean control age 25.7, mean symptomatic group age 23.4), but the two groups were not significantly different in NART or AUDIT scores. Symptomatic participants on average reported consuming ½ more cups of coffee per day (p = 0.0225). Summary demographic characteristics of the sample can be found in Table S5 in the online supplementary material.
Behavioural results
Mean accuracy at the DMS task for all participants was 90.0% (standard deviation 8.24%). Two-sample t tests did not reveal any significant differences in reaction times (correct or error) and accuracies between symptomatic and control participants. At the RD task participants on average detected 97.3% of target letters and made 1.6 errors. Two-sample t tests did not reveal any significant differences in reaction times between the groups. Differences in detection rates and error counts approached significance – symptomatic participants tended to detect on average 1.15% more target letters (p = 0.057), and tended to make on average 0.66 fewer errors (p = 0.077). The effects of depression symptoms on performance remained non-significant when controlling for age and caffeine consumption within additional one-way ANCOVA tests. Summary performance measures for the sample can be found in Tables S6 and S7 in the online supplementary material.
Case-control classification
Participant sample
Of 72 participants in total, 12 were excluded from classification analyses due to face-tracking problems (OpenFace analysis), 11 due to eye-tracking faults, and one participant due to problems with both. Briefly, eight participants were excluded due to problems in correctly tracking the chin or lower part of the face. Either upper or lower lips were not correctly localised for another four participants. Finally, for one participant there were problems in correctly tracking the left side of the face. With regard to eye-tracking faults, in six cases the eye-tracker could not stably or correctly localise either one or both participant's pupils. For one participant, calibration was inaccurate after several attempts. Two participants moved in and out of the eye-tracking camera field-of-view during the assessment. Finally, the eye-tracker intermittently lost track of eyes due to reflections on participant glasses in another three cases. This resulted in a final sample of 48 participants included in the classification analysis.
Of the analysed 48 participants, 25 were symptomatic and 23 were controls. This sample size is consistent with most of the previous depression classification studies (Kambeitz et al., Reference Kambeitz, Cabral, Sacchet, Gotlib, Zahn, Serpa and Koutsouleris2017). Symptomatic participants were on average 3.8 years younger than controls (p = 0.035), but there was no significant difference in other measures. Table 1 outlines characteristics of the sample used for classification analyses.
Table 1. Characteristics of the sample used for classification analyses

Note: Caffeine is in cups of coffee per day. Standard deviations are in parentheses. p value defined according to two-sample independent t tests.
Classification results
SVM classification accuracy with combined face-tracking and eye-tracking features reached 79.17% (sensitivity 76%, specificity 82.61%). We attempted classification with features from each domain separately to check if combining both domains achieves the best results. Classification with only face-tracking features reached 66.67% accuracy (sensitivity 68%, specificity 65.22%). Classification with only eye-tracking features reached 64.58% accuracy (sensitivity 68%, specificity 60.87%). This indicates that face and eye movement measures complement each other to achieve the best results.
Classification features
Table 2 outlines the set of face-tracking and eye-tracking features selected in at least 80% of LOOCV folds (consensus features), with effect sizes and significance values calculated for the entire analysed sample (48 participants, Table 1). Of the 50 identified face-tracking consensus features, four were related to the DMS task and 46 to the RD task. Of the 11 eye-tracking features, seven were related to the DMS task and four were related to the RD task. All selected face-tracking metrics were reduced in symptomatic participants with medium effect sizes according to Cohen's D criteria, with an exception for mean intensity in AU9 (nose wrinkler), which was increased during the negative distraction stage of the DMS task. Since some participants completed the RD task without missing any target letters, effect sizes are not displayed for the metrics related to the RD missed-target feedback.
Table 2. Identified cross-validation consensus face-tracking and eye-tracking features
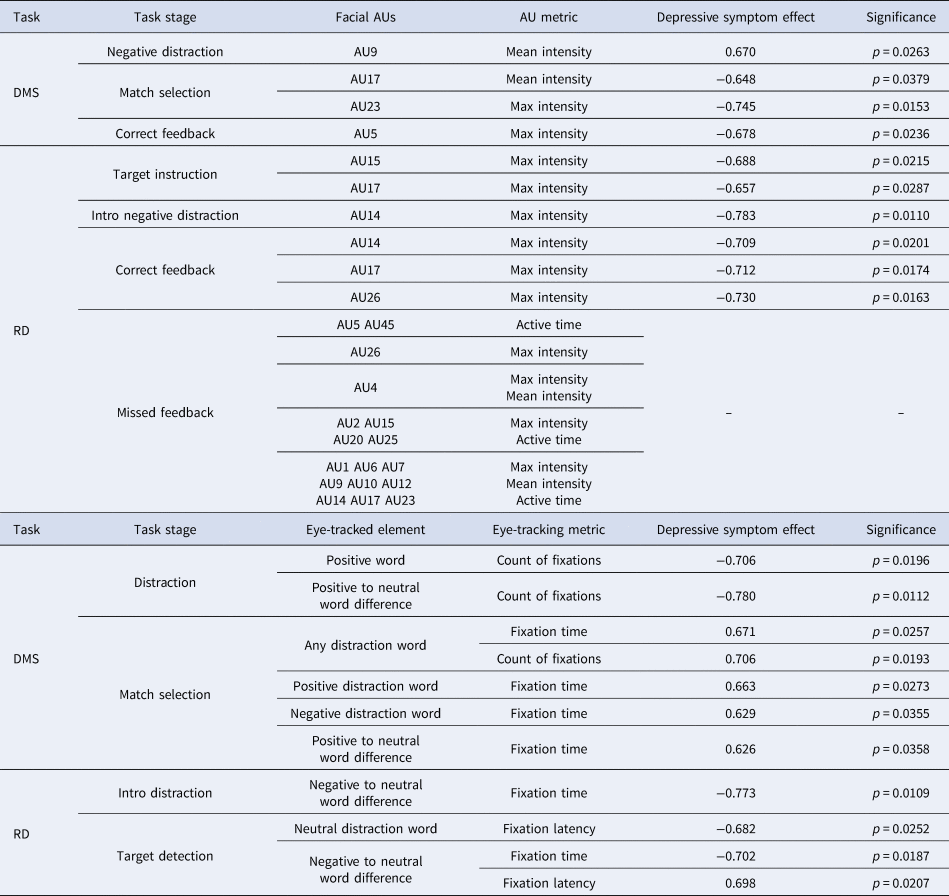
Note: Each feature was selected in at least 80% of LOOCV folds. Effect sizes were calculated according to Cohen's D criteria for the entire sample. Significance (p values) calculated using Welch's t test for the entire sample. RD task missed feedback features were missing and replaced for some participants, hence the effects of depressive symptoms were not shown.
Of the 48 analysed participants, nine detected every target letter at the RD task. Face-tracking features for the RD missed-target feedback stage in these cases were replaced with value −1 (methods section, all features in the analysis are positive and most have numerical values between 0 and 5). The replaced features implicitly incorporate information about cognitive performance – i.e. whether the participant had detected every target letter or not. For classification purposes, this information replaced the missing facial movement data. A post-hoc χ2 test confirmed that the symptomatic sample had a larger proportion of participants who detected every letter at the task (8 out of 25 symptomatic compared to 1 out of 23 controls, χ2 = 6.013, p = 0.0142). Classification based only on the 45 features related to the RD missed-target feedback achieved a 56.25% accuracy – this indicates that information about cognitive performance complemented information about face and eye movements to achieve a higher accuracy.
Discussion
Depressive symptom detection
Depression classification
To the best of our knowledge, our study is the first to assess the application of face and eye movement tracking during cognitive task performance for detection of elevated symptoms of depression. The results suggest that face and eye movement measures may be promising for future research and that the best accuracy can be achieved when these measures are combined.
Our study spans four out of five domains outlined in the Research Domain Criteria (RDoC). RDoC is a leading mental health research initiative supported by the US National Institute for Mental Health (Cuthbert, Reference Cuthbert2014). The initiative aims to define mental health conditions in terms of their characteristics grounded in biology and neuroscience, as compared to symptom-based definitions in the current diagnostic manuals (ICD-10 and DSM-5). RDoC proposes five domains relevant for mental health – negative valence systems, positive valence systems, cognitive systems, social process systems, and arousal systems. It is hoped that different mental health conditions and their subtypes can be defined by characteristics in these domains, leading to more objective diagnoses. Within our study, the tasks assessed the cognitive systems, whilst affective distractions aimed to probe the positive and negative valence systems. Moreover, facial movements are related to systems for social processes. Our results – classification accuracy close to 80% – support the assertion that diagnosis of depression could in principle be performed using behavioural measures related to these four RDoC domains.
Classification accuracy in our study was similar to those in the previous investigations with brain imaging data (Kambeitz et al., Reference Kambeitz, Cabral, Sacchet, Gotlib, Zahn, Serpa and Koutsouleris2017), although lower compared to the most promising results for more severe depression (up to and above 90%, Johnston, Tolomeo, et al. Reference Johnston, Tolomeo, Gradin, Christmas, Matthews and Steele2015; Mwangi et al. Reference Mwangi, Ebmeier, Matthews and Steele2012; Zeng et al. Reference Zeng, Shen, Liu, Wang, Li, Fang and Hu2012). Further work should focus on the improvement of the technical setup and on the assessment of clinical participants – we briefly discuss these aspects below.
Technical design
One distinct advantage of our methods is the simplicity of the technical setup. In brain MRI studies, for example, participants have to undergo a scanning process, which is expensive and requires assistance from highly-trained radiographers. A T1-weighted brain scan, however, only takes around 7 minutes and NHS radiology departments have the necessary equipment (Steele & Paulus, Reference Steele and Paulus2019). In contrast, the technical setup in our study involved only a relatively inexpensive eye-tracking device and a high-resolution colour camera, together with a desktop computer. The accessibility and low cost of these components could make it easier to conduct replication or validation studies and could aid in translating results from research to other settings. In addition, the methods in our study could be more sensitive to first-episode and more mild depression, where structural brain abnormalities may not be present (e.g. Schmaal et al., Reference Schmaal, Veltman, van Erp, Sämann, Frodl, Jahanshad and Hibar2016). It is possible that the studied methods could be more suitable for screening depression in primary healthcare settings – for example in general practices or community hospitals. MRI, on the other hand, could then be used in larger hospitals and specialised clinics for determining best courses of treatment for severe cases.
An important technical limitation in our study was participant exclusion due to face-tracking or eye-tracking problems. Face-tracking problems occurred for 12 participants and eye-tracking faults were present for another 11. In future studies face-tracking could be improved by increasing resolution of visual recordings, and by asking participants to wear a collar to make the jawline easily discernible during automated face-tracking analysis. Extra lighting focused on the participant's faces during the assessment could also be added. To reduce eye-tracking faults, additional methods to restrict participant movement may be explored, together with the application of eye-tracking devices with higher resolution.
Experiment participants
A general limitation of our study was the participant sample. We assessed largely young and non-clinical participants, recruited from a student population (Table 1). No clinical diagnostic information was used. We thus do not yet have evidence that the results are directly translatable to clinical populations or to participants with severe and enduring unipolar or bipolar illnesses. Further investigations should apply similar methods to investigate participants with formal diagnoses and other age groups, as well as larger sample sizes.
Control and symptomatic groups in our study were largely similar with regard to demographic characteristics, but symptomatic participants were on average 3.8 years younger compared to controls (Table 1). No studies to date indicate age-related differences in face or eye movements in young adults. We opted to avoid additional correction for age in order to preserve any effects of interest as much as possible, and also because all participants were young and the difference in age between the groups was relatively small. Future studies could investigate if face and eye movements may be differentially affected by depression in younger or older age.
Depressive symptom features
Face-tracking features
Symptomatic participants displayed reduced intensities of mouth or eyelid movements when selecting match pattern at the DMS task, when receiving target instruction at the RD task, and when receiving correct feedback at both the DMS and RD tasks (Table 2, Fig. 2). Cross-validation consensus features included maximal intensities of upper eyelid raiser (AU5), lip dimpler (AU14), lip corner depressor (AU15), chin raiser (AU17), and lip tightener (AU23). Reduced facial action intensities could be indicative of lower concentration on the task, although this was not reflected in reaction times and accuracies. To the best of our knowledge, no study to date has analysed face movements during cognitive task performance in depression – although patterns of reduced facial activity during clinical interviews have been reported (Cohn et al., Reference Cohn, Kruez, Matthews, Yang, Nguyen, Padilla and De la Torre2009; Gaebel & Wölwer, Reference Gaebel and Wölwer1992, Reference Gaebel and Wölwer2004). Further work will be needed to validate our results in larger samples.

Fig. 2. Identified consensus face movement features which characterise symptomatic participants (excluding those related to the RD missed-target feedback). Each feature was selected in at least 80% of LOOCV folds.
With regard to affective distractions – symptomatic participants displayed increased nose wrinkling (AU9) at the negative distraction stage of the DMS task and decreased maximal intensity of lip dimpling (AU14) at the introductory negative distraction stage of the RD task. This supports the proposition that facial reactions to negative affective material are altered in depression, although the precise pattern of changes needs to be confirmed in the future. The previous literature is inconsistent: some reports indicate reduced facial movements during sad mental imagery (Gehricke & Shapiro, Reference Gehricke and Shapiro2000, Reference Gehricke and Shapiro2001), and when viewing negative affective pictures or clips (Renneberg et al., Reference Renneberg, Heyn, Gebhard and Bachmann2005; Schneider et al., Reference Schneider, Heimann, Himer, Huss, Mattes and Adam1990; Wexler, Levenson, Warrenburg, & Price, Reference Wexler, Levenson, Warrenburg and Price1994). Others, on the other hand, reported increased facial muscle activities (mouth and eyebrow) or increased facial movement frequencies in response to sad mental imagery (Greden, Genero, Price, Feinberg, & Levine, Reference Greden, Genero, Price, Feinberg and Levine1986; Schwartz, Fair, Salt, Mandel, & Klerman, Reference Schwartz, Fair, Salt, Mandel and Klerman1976a, Reference Schwartz, Fair, Salt, Mandel and Klerman1976b), depression-related thoughts (Teasdale & Bancroft, Reference Teasdale and Bancroft1977; Teasdale & Rezin, Reference Teasdale and Rezin1978), or negative affective pictures (Sloan et al., Reference Sloan, Strauss, Quirk and Sajatovic1997). It is possible that different contexts and different types of affective material are related to different effects in depression, and future studies could clarify which changes are related to which stimuli.
Eye-tracking features
All of the identified eye-tracking consensus features in our study were related to distraction words (Table 2). Previous literature indicates that depressed participants fixate more and for longer on negative material and less on positive material (reviews in Armstrong & Olatunji, Reference Armstrong and Olatunji2012; Carvalho et al., Reference Carvalho, Laurent, Noiret, Chopard, Haffen, Bennabi and Vandel2015). In our study, symptomatic participants fixated fewer times on positive words during the DMS distraction stage and longer on all distraction words during the DMS selection stage, but no specific negative bias was observed. Lack of a negative bias effect could have been because the participants were a non-clinical group and because the distraction words in our study may have been less salient than affective material in other studies. Nonetheless, our results indicate that verbal affective distractions can be useful for detecting elevated symptoms of depression.
Conclusion
Our proof-of-concept study indicates that elevated symptoms of depression can in principle be predicted using face and eye movement tracking during cognitive task performance. Symptomatic participants were identified mainly by reduced intensities of mouth or eye movements during different stages of the cognitive tasks, as well as differences in eye fixations on verbal distraction stimuli. Future work will be needed to investigate larger samples and clinical participants, to improve the technical setup and reduce participant drop-out rates, and to define which specific depression symptoms may be related to which changes in the face and eye movements.
Supplementary material
The supplementary material for this article can be found at https://doi.org/10.1017/S0033291720003608.
Acknowledgements
The current work was funded by grants EP/F500385/1 and BB/F529254/1 for the University of Edinburgh, School of Informatics, Doctoral Training Centre in Neuroinformatics and Computational Neuroscience from the UK Engineering and Physical Sciences Research Council (EPSRC), the UK Biotechnology and Biological Sciences Research Council (BBSRC), and the UK Medical Research Council (MRC).
Conflict of interest
JDS previously received funding via an honorarium associated with a lecture from Wyeth, and research funding from Indivior. None of these funding sources is connected to the present study. No potential conflicts of interest are reported for other authors.


