


1. INTRODUCTION
At present, with the rapid development in global economies, the demand for maritime transport has increased. Therefore, traffic engineers and managers are required to be in good control of marine traffic situations and regulation, providing engineering measures and traffic management control procedures that meet current and future traffic needs. In the early 1980s, EEC's COST-301 project concluded that ‘a VTS should be designed as a system whose function is to collect, process, present to operators, disseminate to users, store and print out data of all types relating to the marine traffic situations which it monitors’ (Wepster, Reference Wepster1981; Degré, Reference Degré1995). Now, with the advent of new technologies, the information that needs to be processed by VTS has grown; traditional VTS operation no longer satisfies the port and shipping industries' development needs. Therefore, to improve existing traffic, as well as to plan future traffic developments, and to minimize the risk of collisions, an advanced, in-depth marine traffic survey and analysis is required.
In recent years, due to the International Maritime Organization (IMO) imposed requirement to install shipboard AIS, an overabundance of information is often received from the VTS; VTS now faces the same problem as general enterprises, described by American futurist John Naisbitt (Reference Naisbitt1982), who claims ‘We are drowning in information, but starving for knowledge.’ In fact, much of the enormous amount of information held by enterprises (and, we claim, VTS) is potentially of great value and importance. Typically, though, these resources are not fully exploited. This is at present an important issue for business intelligence (BI) discovery in customer relation management (CRM). According to the IMO Performance Standard, ‘AIS should improve the safety of navigation by assisting in the operation of Vessel Traffic Services (VTS)’. However, the effectiveness of AIS as a VTS tool for traffic management and information provision depends heavily on the quality of AIS information and intelligent applications for information processing, integration, and presentation (Bradshaw and Jones, Reference Bradshaw and Jones1980; Carter, Reference Carter2001; Chang, Reference Chang2004).
The present research simulated the Keelung Harbour (north Taiwan) VTS station via a station established at National Taiwan Ocean University (NTOU); the simulated station is similar to the Keelung Harbour VTS station in terms of its service coverage. This facilitated the analysis and research areas in marine traffic engineering as well as serving as a case study. We used an implementation framework similar to BI discovery used in CRM business marketing, and applied the data mining techniques used in that framework to the processing and analysis of information provided by the VTS. The difference between the two applications is that information received by AIS includes spatial and temporal features. In order that these features can be distinguished and the relevant knowledge extracted, we decoded the AIS received data and converted it to the readable format. The database management system is used for storage and management, while the GIS analyses and processes the information, converting text data to meaningful spatial and temporal data. This data is warehoused, and subsequently the GIS and BI analysis tools are used separately to perform visual, spatial and temporal data mining to discover the status and regularities of marine traffic flow. This provides marine traffic managers with a useful strategic planning resource.
2. MARINE TRAFFIC SURVEYS AND MARINE TRAFFIC ENGINEERING
Vessel traffic is commonly restricted by several factors such as water depth, route, traffic separation scheme, marine traffic rules and port operations. Thus, through analysis of a large body of ship navigation information, hidden navigation patterns may emerge. Marine traffic surveys are real-time investigations of vessel traffic situations, and are fundamental to all statistical analysis, improving the quality of the analysis and strategy.
2.1. AIS and marine traffic surveys
The first traffic survey to fully deserve the name was carried out by Yamaguchi et al in 1963 in Japan (Fujii, Reference Fujii1977). For marine traffic engineering, traffic surveys are most important and provide the fundamental materials necessary for harbour and fairway design, traffic control planning, etc. Such surveys cover numerous items, the main subjects being traffic volume, speed, distribution of ships' tracks, origin and destination and type of cargo. Traditionally, the methods for doing marine traffic surveys include visual observation, radar observation and airborne photography (Yao et al., Reference Yao, Liu and Wu2010), requiring at least three days or 72 hours of continuous observation. This is expensive and consumes manpower (Yamaguchi and Sakaki, Reference Yamaguchi and Sakaki1971). Nevertheless, the situation at present has improved as IMO has determined that AIS is to be fitted aboard all ships of 300 gross tonnage and upwards engaged on international voyages, cargo ships of 500 gross tonnage and upwards not engaged on international voyages, and all passenger ships irrespective of their size. This widespread use of AIS led to navigation safety improvements, and also made available a new and reliable method for marine traffic surveys. AIS combines the Self Organizing Time Division Multiple Access (SOTDMA) communications technology, GPS positioning and other advances in IT, thereby expanding VTS's control range and functions, and strengthening its message collection, processing capabilities, and information accuracy.
The integration of AIS into VTS enhances VTS's identification, tracking and vessel monitoring capabilities. Ships with AIS will, according to their own speed and navigation status, automatically send dynamic, static and voyage related messages to VTS and surrounding ships on VHF designated radio frequency. After VTS receives a ship's position, the data appears on the Electronic Chart Display and Information System (ECDIS) or radar screen. It also receives a plentiful supply of data about the ship. The received data can be stored in a database so that it can subsequently be replayed, analyzed or used for maritime survey, reducing the manpower and resources required by marine traffic surveys. Thus, AIS-enabled VTS has an increasingly important role in marine traffic management. The impact of innovations in AIS on the functionality and role of VTS is revolutionary (Harre, Reference Harre2000).
2.2. Marine traffic engineering
Marine traffic engineering may be defined as the investigation of marine traffic and the application of the subsequent results to the improvement of port and fairway facilities and to traffic regulation (Toyoda and Fujii, Reference Toyoda and Fujii1971). Through marine traffic surveys and marine traffic engineering analysis, we can understand the distribution of ships density (Beattie, Reference Beattie1971), distribution of track (Hara, Reference Hara1977; Yao et al., Reference Yao, Liu and Wu2010), traffic flow, traffic volume, speed distribution, time pattern of traffic flow, ship domain (Ciletti, Reference Ciletti1978), traffic capacity (Fujii and Tanaka, Reference Fujii and Tanaka1971), encounter rate (Draper and Bennett, Reference Draper and Bennett1972; Barratt, Reference Barratt1973; Goodwin, Reference Goodwin1978), collision avoidance behaviours (Colley et al., Reference Colley, Curtis and Stockel1984) and other navigational statuses. Among these, the distribution of ships density and distribution of track reflects the marine traffic spatial distribution (spatial characteristics of ship movement combinations). On the basis of these two statuses, we can formulate a traffic flow concept and model. The traffic flow model and time pattern of traffic flow reflect the spatial distribution and temporal characteristics of traffic flow. Speed distribution reflects the characteristics of ship movement changes. Traffic volume and traffic capacity reflect the ability of route processing on vessel traffic and actual situations. Ship domain, encounter rate and collision avoidance behaviour are ship navigation concepts, models and rules derived from vessel traffic spatial distribution. Through the understanding of these navigational statuses, marine traffic management standards can be improved.
Marine traffic survey and engineering was an important maritime research topic in the 1970s and 1980s. As the required observation times were long, and there were technological limitations in those times, a majority of the research works emphasized empirical analysis. After the 1990s, relevant literature or research projects appeared less frequently. Today, due to new data processing techniques and the widespread use of AIS, information can be obtained quickly and easily. Accordingly, we feel that there is a need to re-examine current VTS observation data, bring in new processing and analysis methods, and refresh marine traffic engineering research.
3. DATA MINING AND AIS DATA
Due to progress in information technology, the process of information collection has increasingly been automated and computerized. Different types of information available are rapidly increasing, and the resulting quantity is larger than previously imagined. The greatest issue faced at present is how to extract valuable knowledge from the data. According to Frawley et al's (Reference Frawley, Piatesky-Shapiro, Matheus, Fayyad, Piatestky-Shaprio, Smyth and Ulthurusamy1991) definition, data mining is a technique to discover hidden, previously unknown and useful knowledge from a large database. It is a new domain that is rapidly developing and combines techniques from other domains such as machine learning, databases, expert systems, pattern recognition, statistics, knowledge-based systems as well as visualization (Koperski et al., Reference Koperski, Adhihary and Han1996; Miller and Han, Reference Miller and Han2001). Knowledge types that can be mined include generalization, classification, association, deviation, prediction, estimation, and visualization (Berry and Linoff, Reference Berry and Linoff2000). At present, data mining has been applied to solve various business problems. Processes in a standard data mining task can include the following seven stages (Roiger and Geatz, Reference Roiger and Geatz2002; Han and Kamber, 2000):
1. Set the target: To understand the domain in which data is to be mined, there is a need to clearly describe the objectives and list possible assumptions and anticipated desired results.
2. Establish target data set: Choose the initial data set to be analyzed, such as the collection of AIS data.
3. Data pre-processing: Use effective or readily available approaches to process noisy data and decide how to handle data loss, such as decoding and amending AIS original data into database or GIS processing on spatial information.
4. Data cleaning and transformation: Delete or add some attributes and information. Methods to standardize, convert and modify data are determined in this step. After it has been decoded, AIS data is then processed by GIS, including addition of appropriate attributes, before being converted to a format suitable for data mining and stored in a data warehouse.
5. Data mining: Use the most appropriate data mining algorithms to optimally process the data.
6. Explanation and evaluation: From results obtained, search for useful and interesting information. If there is none, then repeat the previous steps with other new attributes and samples.
7. Action: If the mined knowledge is determined to be useful, this knowledge can be integrated and directly applied to solve the appropriate problem, supporting decision-making.
Data mining is a multi-stage and repetitive process. Each stage requires the participation of the domain expert, data analyst and data miner. The results from data mining are normally presented in the form of concepts, rules, regularities, patterns, constraints and visualizations. This knowledge can be directly provided to the decision-maker as well as to the corresponding domain expert. It can be used to amend the existing knowledge system and also stored as new knowledge in the application system to act as the basis for decision support.
Due to the advantage offered by AIS in terms of observation data collection, after long periods of automated data collection, VTS also faces a problem common to typical enterprises, i.e. a large quantity of marine traffic observation is accumulated and it is unclear how to effectively use the data. Application of data mining techniques can enable reorganization of a set of raw marine traffic data to form knowledge, allowing it to not only service marine traffic management but also provide facts to the decision-making system. However, marine traffic survey data differs from the text-only data typically found in ordinary business management domains. More specifically, ship trajectory data includes text, spatial (ship's latitude and longitude) and temporal (UTC) information.
In its early days, spatial data mining research focused on basic algorithm development. Nowadays, many other kinds of spatial analysis and practical application are being conducted in the domain. (Ester et al. Reference Ester, Kriegel and Sander1997; Koperski et al. Reference Koperski, Adhihary and Han1998; Miller et al., Reference Miller and Han2001). Recently, due to the proliferation of mobile positioning and mobile communication technologies, the topic of spatio-temporal data mining has been receiving increasing attention. Coincidentally, marine traffic data also has spatio-temporal characteristics. Currently, spatio-temporal data mining research related to marine traffic has mainly progressed in the direction of algorithm development. For instance, Dahlbom and Niklasson (Reference Dahlbom and Nuklasson2007) explore trajectory clustering as a means of representing the normal behaviour of vessels in coastal surveillance scenarios. Li et al. (Reference Li, Han and Kim2006) use object movement features, called motifs, to execute anomaly detection and apply it to coastal surveillance, law enforcement, and homeland security. However, these researches have not considered practical issues faced during marine navigation and thus, their solutions are not yet suitable for implementation. Zheng et al. (Reference Zheng, Chen, Xia and Jin2009) use two machine learning methods, clustering and graphical property analysis, to analyze characteristics of vessel traffic flow data. However, this research has only used data based on ships entering and leaving port for data mining analysis, and has not considered spatial relationships between ship trajectories and neighbouring waters. Thus, the issue addressed by their research is only a traditional data-mining problem. Thus, performing data mining on AIS observation data for VTS is an important method in doing systematic research on marine traffic.
4. KNOWLEDGE DISCOVERY FROM AIS DATABASE
In particular, this research targets spatial and temporal characteristics possessed by AIS, combines GIS, database management systems, data warehousing and business intelligence tools to process and analyze data. It uses association rule mining, sequential pattern mining and visualization techniques to perform spatial and temporal data mining, converting output results from regularities and visualization forms to knowledge, providing a basis for marine traffic management decision-making. The proposed research architecture and processes in Figure 1 follow the seven steps described in Section 3. Next, we further describe these steps:

Figure 1. Research framework and flow chart.
4.1. Data collection
As shown in Figure 2, this research makes use of an AIS receiver station on the NTOU campus, 2 km from Taiwan's Keelung Harbour, simulating Keelung Harbour's VTS station. We receive ship AIS data similar to the VTS station's surveillance area, then, using computer programs developed with Visual Basic.Net 2008 to receive AIS original messages and transfer them through the RS-232 interface to the connected PC's SQL Server 2005 database server (acting as the data storage platform). In this way, the database management system not only facilitates management but also can be readily integrated with other software. Data was collected from 6 March 2009 until 28 April 2009, and altogether contains data on 3486 voyages; the total quantity of static and dynamic messages reached 1·5 Gb. The original AIS data is as shown in Figure 3. From this figure, we can observe a very dense spatial distribution of ship position points. However, some important characteristics and spatial relationships of traffic flow are concealed from view; more importantly, AIS data temporal patterns or situation changes are not observable from the figure. We note that Keelung Harbour is not a very busy port, and the period of data collection is only 2 months. However, the data presented is highly complex. This causes concern for processing the far greater data amounts required by major ports and key sea areas. Next, therefore, data is pre-processed prior to mining spatial and temporal patterns as well as hidden regularities in AIS data.

Figure 2. AIS station location map.

Figure 3. Original AIS received data.
4.2. Data preprocessing and selection
The AIS messages can be classed as static information, dynamic information and voyage related information. Each of these data types is refreshed at different intervals and under different navigational conditions. Static information is entered during AIS installation and only needs to be changed when the ship has changed name or type. Dynamic information is automatically updated using a sensor connected to AIS. Voyage related information is entered by officers on watch during navigation, and updated. Apart from this, the AIS system can also send safety-related and short messages.
AIS broadcast information consists of two types, VDM (VHF Data-link Message) and VDO (VHF Data-link Own-vessel Report). VDM is data received by own ship from other ships, while VDO is own ship's broadcast information. The format of the VDM message and VDO message is identical. VDM message type is embedded in VDM message compressed data and it can only be recovered after decompression. In the AIS technical specification, there are 22 different types of messages. These 22 message types include not only transmission data but also functions to support various other systems or data links. In this research, we use Visual Basic.Net 2008 to develop a computer program to decode only types 1, 2 and 3 (target vessel position report) and type 5 (dynamic information and voyage related information) messages.
4.2.1. AIS data pre-processing
This step is mainly to decode AIS messages. Decoding operations are as follows:
• AIS message analysis: On the basis of the AIS data format protocol set in accordance with the IEC61162 and IEC91993-2 standards, we interpret the original message. For example, suppose the original message is:
!AIVDM,2,1,5,A,53P7v6P2=wutlq93J21A>0dDDiDpN22222222216C0>:?4Ob0IU0B@j5CQp8,0*18 Here,“!AIVDM” represents VDM information received by the AIS system; “2” in “2, 1” means that one complete message is formed by 2 messages, while “1” represents the serial number in the complete message; “A” represents receiving via AIS channel A. “0” in “0*18” means that this sentence's fill character is 0, while “18” is the check code. The specific information transmitted by the whole sentence is:
“53P7v6P2=wutlq93J21A>0dDDiDpN22222222216C0>:?4Ob0IU0B@j5CQp8”. If one AIS message is conveyed by more than one message, then the specific information communicated by the messages needs to be linked together sequentially according to the serial number.
• AIS message decoding: Based on analysis of the AIS message, we map the characters in the message using the 6-bits ASCII code to produce a binary string. Then, we perform conversion based on the defined format of the ITU-RM. 1371-1 protocol. Different data bits convey different information. Notice for instance that the first character in the above message is “5”, and its 6-bit binary string is “000101”. Based on the ITU-RM. 1371-1 protocol, we can derive the marking of the message as “5”, meaning that this message is of message type 5 (i.e. static and voyage related message). The whole message can thus be sequentially decoded. If the message's character represents an integer variable, the binary data still needs to be converted to decimals and still needs to undergo unit conversion before it can be sent to the database. If the message characters represent some text variable, then every six bits are to be treated as one unit ASCII code to be converted to characters and combined to form the final message data to be stored into the SQL Server database's dynamic message and static message data table. In Figure 4, these two data tables respectively represent the decoded and decompressed dynamic and static message data. Through the use of MMSI as a relational key, each ship's static and dynamic message can be joined together to compose each ship's complete trajectory.
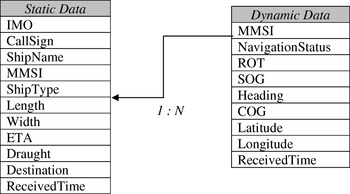
Figure 4. Static and dynamic data table stored in SQL server.
4.2.2. AIS data selection
The AIS transceiver sends dynamic messages every two to ten seconds depending on the vessel's speed while underway, and every three minutes while the vessel is at anchor. In terms of the overall analysis, there is no need to note such minute changes in position. Therefore, we considered the research suggestion in Goodwin (Reference Goodwin1978) and filtered out position points with ship speed lower than three knots so that non-typical navigation position points such as anchorage entry/exit and pick and drop pilot operations can be easily removed. This increases data mining efficiency and accuracy.
4.3. Data cleaning and transformation
After the processing described above, the obtained data is considerably simplified. However, the most important spatial data within AIS data still resides in the data table's latitude and longitude textual records. The associations between this information and spatial positions are not yet established. Therefore, the main objective of this step is to use GIS software on AIS data to conduct spatial processing and analysis, obtaining spatial associations between the spatial data and port regions.
4.3.1. Data import to GIS
Using GIS software (ArcGIS), we imported pre-processed text data on the SQL Server database into GIS to form an AIS trajectory GIS layer.
4.3.2. Assigning geographic grids to the research area
Traditional marine traffic analysis takes the area of study as an entire region when running the assessment. In contrast, this research converts the area of study into geographic grids to facilitate integration of AIS data and GIS's spatial analysis. Results are overlaid on a chart in the form of grids. This can highlight sensitive waters and the results are more intuitive. We use the dimensions 0·01°×0·01° as the size of a grid to divide up the area (as in Figure 5) and give each grid a unique number. Then, according to the distance from the shore (which has a varying impact on marine traffic), a sea area is divided into different regions and each region is individually studied. In this way, apart from facilitating unit spatial analysis on individual grids, we also preserve the potential to integrate with other background geographic data (such as water depth, tide, current, meteorological data, geology), carrying out more complicated spatial analyses with flexibility.

Figure 5. Geographic unit cell.
4.3.3. Spatial analysis
Principal spatial analysis functions used include spatial object intersection and spatial join.
• Spatial object intersection: Grids are planar objects, while voyages are linear. Through intersection analysis, we can determine the grids crossed by every voyage and simplify the original series of position points that establish voyages into a series of grids. This problem abstraction is beneficial in pattern discovery.
• Spatial join: We perform spatial join analysis on voyage (linear) objects and grid (planar) objects, thereby aggregating all voyage information on each grid. This enriches the information held by each grid: for instance, every cell unit's traffic density or distribution of course. Other spatial analysis modules can also be combined to perform unit analysis, and the results after statistical analysis can be intuitively displayed, a key goal of visualization data mining.
4.3.4. Data transformation and data warehouse
Through processing in the previous steps, apart from removal of redundant information, useful information has also been added. Furthermore, after homogenizing the data, the data may be deemed “clean”. In order that the data mining model can read the information smoothly and perform analysis (to avoid the risk of errors being introduced by the additional data conversion), we transform the pre-processed data into SQL Server's data warehouse. Data warehouse is a technique closely related to data mining. It is an integrated and analysis-focused database environment developed from the traditional database. It first extracts required data from a large operational database. After processing, it is converted into a defined format to speed up search and analysis. In this research, several layers of processing and conversion are required from the handling of initial received AIS messages until the end, when the data-mining model can be provided for use. For this purpose, it is necessary for the data warehouse to be provided.
4.4. Data mining
This step is based on the research goal of selecting appropriate data mining methods to perform analysis. As this research focuses on association rules between ship movement behaviour and space/time, we use ArcGIS to perform visualization data mining, and SQL Server 2005 Business Intelligence module's association rule mining and sequential pattern mining methods to perform analysis. Visualization data mining is beneficial for quick intuitive decisions, while association rule mining and sequential pattern mining can generate rules to construct the model base, performing more complicated predictions.
4.4.1. GIS Visualization
One of the goals of data mining is to use an easy to understand method to explain the occurrence of any event in a complex data repository. A visual state diagram display or a correct description can enhance understanding of the state and hint where to begin the search for the explanation. Visualization is a strong and powerful descriptive data mining method. An appropriate visualization display is more valuable than having many rules because we, as humans, are experts at extracting meaningful information from diagrams. Before a typical data mining software tool does its work the appropriate visualization tool is provided to allow the user to manage the overall data trends; such a tool helps the user decide how to approach the data or perform data configuration, and more precisely, find the desired results. However, this type of tool is limited to general data and is not suitable for attribute data such as latitude and longitude. Thus, this research has, apart from performing spatial analysis and statistics on AIS data, also handled display through the GIS software spatial display capability. The visualization approach is as follows:
• Graduated colour settings: There are many types of configurations, involving options such as equal interval, standard deviation, quantile, natural breaks and geometrical interval. There are extreme differences in the researched area's navigation track distribution (ranging from dense to none), and we wished to avoid impacts due to outlier values. After experimentation, therefore, we used geometrical intervals to divide up the traffic density, assigning one of eight rank classifications to each interval. In this way, we were able to display detailed information in navigation route distribution. Through assigning different graduated colours to different geographic grids, distribution of traffic density, distribution of track, traffic flow, speed distribution and time pattern of traffic flow state can be discerned. These diagrams show a lot of valuable knowledge, apart from providing intuitive information; it can lead to subsequent analysis or provide beneficial clues for data mining, shortening search time.
• Supplementary diagrams: As for effects that may not be displayed by the graduated colour, these can be supplemented by statistical tables and charts. We created a rose chart to express the distribution of courses, a pie chart to express distribution formed by ship types and a histogram to express the traffic volume. The manner of creation uses available tools provided by GIS software as well as ArcGIS's common component library – ArcObject creates special diagrams (for the rose chart, for example).
4.4.2. Association rule mining and sequential pattern mining
Visualization mining is useful for intuitively displaying knowledge. However, if this knowledge is to be applied on other future cases, then there is a need to rely on other data mining methods that can generate models such as association rule mining and sequential pattern mining. These two data mining methods have the main objective of generating interesting rules (knowledge) that may be used to understand data features as well as construct prediction models to be used for predicting incidents.
Association rule mining is a well-known application in data mining, otherwise termed Market Basket Analysis. It was first proposed by Agrawal et al. (Reference Agrawal, Imielinske and Swami1993) and was developed into the Apriori algorithm (Agrawal and Srikant, Reference Agrawal and Srikant1994). It is a data mining method to mine associations between variables, commonly used in business marketing/CRM and is the basis for sequential pattern mining. Its original idea is to analyze consumer behaviour. Consider the situation when a customer enters the marketplace to shop, the shopping cart will subsequently be filled with different types of products and after payment has been made, the database will record each and every transaction a customer has made. From these transaction records, association rule mining then attempts to discover those products that customers buy at the same time. In this way, product shelf arrangements or customized sales strategies can be implemented. If we consider the present research as analogous to the retail marketing problem, the corresponding associations would be as shown in Table 1. All the grids in the area of study can be viewed as a collection of all retail products, where each grid represents each product and the grid number correspond to the product number. Each customer's basic information is equivalent to the static message, the transaction data equivalent to voyage related message, ship's MMSI equivalent to customer's number, every product list in a transaction equivalent to grids passed by a voyage. Every customer's transaction (i.e. voyage) background is different and every product's (i.e. grid's) characteristics are different. Through data mining, we can discover consumer (voyage) behaviour and discover the popular (high traffic density) frequent products (grids), to be used as a marketing strategy. By applying this method to marine traffic, we can then discover ship navigation regularities and traffic distribution, to be used as reference for marine traffic management.
Table 1. CRM data and corresponding AIS data.
Using shopping transactions as an example: Data comes from customer basic data and transaction list. Assume that I={i1, i2, i3,….im} represents all product collections in the marketplace (equivalent to all grids in the research area), termed itemsets and every transaction T (equivalent to every voyage) is a subset of all itemsets, denoted T⊂I. The format of the association rule “Consumer with some kind of profile who normally buys product X will also buy product Y” is:
X→Y [Support, Confidence]
where X⊂I, Y⊂I and X∩Y=Ø
Support=Probability(XY)
Confidence=Probability(XY)/ Probability(X)
Applying this to marine traffic, it can mean that ships that possess certain features (for example, navigation status, ship type, ship length, nationality, cargo type) normally would pass region X to region Y and so, we can discover the traffic rules and traffic distribution variables such as convergence, divergence regions and hotspots with high encounter rate. X and Y can be itemsets or a collection of basic individual attributes, which can contain multiple items. There are two important indicators in the rule's metrics, namely support and confidence.
• Support: Refers to the fact that within the transaction database, product items X and Y exist at the same time, taking a percentage of the total number of transactions, i.e. the value of (the number of transactions containing X and Y)/(the number of transactions).
• Confidence: Represents the conditional probability that a rule is accurate. In other words, the probability that a customer buying product X would at the same time buy product Y, i.e. (the number of transactions containing X and Y)/(the number of transactions containing X). The higher the confidence, the more valuable is the rule as a reference.
Although a high confidence means that the rule has a high degree of accuracy, it needs to be noted that the occurrence of that particular transaction must be high so that the rule is more representative. Before running association rule mining, we normally have to first set the minimum confidence and minimum support threshold to filter out unqualified rules and thereby select qualifying or useful rules from a large number of candidate rules.
Sequential pattern mining is similar to association rule mining with the only difference being the consideration of the relationship with time, determining the order in time in which the events happen. For instance, if X→Y, then event X must happen before event Y. Here, this implies a causal relationship, while association rule mining is only concerned with which events happen at the same time. Due to this property of sequential pattern mining, we apply it to the discovery of the time pattern of traffic flow. The Microsoft sequential pattern-mining algorithm used in this research is different from the traditional Apriori algorithm and combines the idea of clustering with a Markov chain, allowing it to predict the probability of an incident. If paired with the model constructed by association rule mining, it may be applied to maritime traffic flow simulation in the future.
Apart from this, in order to find more meaningful knowledge about marine traffic, new derived attributes need to be created in the data table. The method is as follows:
• Data discretized: It is difficult to extract meaningful information from very detailed data, especially continuous numerical data. Therefore, there is a need to perform abstraction on the original data. Data discretization is a commonly used abstraction method. The AIS data discretized include:
1. Course over ground: Every 45° interval, eight bearings are obtained, namely N, NE, E, SE, S, SW, W and NW.
2. Ship speed: According to AIS specification and AIS messages transmission interval, classify ship speed as one of Slow, Medium, High and Very High.
3. Received time: We did not use UTC but instead, taking the local time of received AIS messages as standard, the abstraction is such that the precise time data is classified into every 24 hour period or the six time periods night, late night, early morning, morning, afternoon and evening.
4. Ship length: Directly discretized by the data mining tool after analysis.
• Attribute value concatenation: Traditional association rule mining uses a product number product name and customer basic information as mining data. Analysis on this data only emphasizes the relationship between the customer and the purchased products and as such, the characteristics of the product are not considered, in which further follow-up analysis is required. By doing the same when performing data mining on marine traffic, only associations between vessel static data or voyage related data and navigated waters are obtained. A large amount of dynamic data (which contains a lot of valuable information) such as COG, speed and time will not be fully utilized. We use the attribute value concatenation method to combine all this information and produce a new derived attribute. This attribute can be viewed as a new product number, but at the same time contains more information. Using Figure 6 as an example, first consider CellID, COG, speed and received time as separate attribute values, then discretize COG, speed, and ReceiveTime to obtain SE (south east), H (high speed) and 5 (5 AM). Lastly, concatenate the CellID and the attributes to obtain the value:
245_5_SE_H
The new derived attribute value's actual meaning is that some ship, at 5 AM, navigates at geographic unit cell number 245, in a south easterly direction at high speed. This value is then taken as a product number to replace the original basic information with only CellID. The obtained inference rules would then possess spatial, temporal and the typical attribute values information. The concatenation of attribute values can select more meaningful attributes, rather than all attributes. Through different combinations, more interesting rules can be produced, while preserving the flexibility to combine future background information from geology, meteorology and hydrology.

Figure 6. Attribute discretized and concatenation.
5. EXPERIMENTAL RESULTS
5.1. GIS Visualization
Using geographic grid division and statistical analysis on the grids, we used multiple display effects to present multi-faceted data embedded in the original data. The results obtained are not only easy to perform decision-making upon but also, more importantly, can provide clues to subsequent data mining tasks.
5.1.1. Traffic density diagram
See Figure 7 (Top). We calculated the total number of voyages across each grid within the observation period and then differentiated by the graduated colour and geometrical interval to present the final results. To display spatial distribution of traffic density, note the denser the traffic areas, the deeper the colour. Through this method, the following information can be presented:
• Traffic volume: if the grid size is appropriately decreased in size with its axial coordinates rotated so as to coincide with the observation line and then recomputed, the ship volume that passed some observation line within an observation period can be displayed.
• Traffic flow: for the original AIS trajectory diagram in Figure 2, Figure 7 (Top) has clearly displayed a few traffic flows with varying density and wideness.
• Time pattern of traffic flow diagrams. Shown in Figures 7 (Left) and (Right).
• Encounter condition: as every grid's size is 0·01°×0·01°, which is approximately 0·6×0·6 nautical miles, the size is similar to a typical ship domain. If we follow Goodwin's (Reference Goodwin1978) suggestion and extract out the average ship domain in the waters to calculate the encounter rate (with grid size adjusted according to ship domain size), the resulting display effects would contain hidden encounter rate information.

Figure 7. (Top) Traffic flow and density diagram. (Left) Time Pattern of traffic at 5 AM; (Right) Time Pattern of traffic at 1 PM
5.1.2. Distribution of speed diagram
We calculated the average speed of ships passing through every grid within the observation period; shown in Figure 8 (Left).

Figure 8. (Left) Distribution of speed; (Right) Distribution of COG.
5.1.3. Distribution of COG diagram
A rose chart (Figure 8 (Right)) is use to express each grid's distribution of COG. This allows understanding of each grid's traffic complexity situation and whether it is a convergent or divergent region.
5.2. Association rule mining and sequential pattern mining results
These two types of data mining focus on generating rules to construct prediction models. However, the focus of this research is on understanding the marine traffic regularities of the research area. At this stage, there is no need to run prediction tasks and thus, the generated prediction models are preserved for use later on as the basis for constructing traffic simulation model bases. However, as the data grows more complex and the resultant generated rules grow, it becomes difficult to intuitively observe the results. In order to understand the effects of data mining on knowledge discovery, apart from executing prediction validation used by typical prediction models, as we also hope to understand whether the data mining tasks have given us directly applicable interesting rules, we used association analysis tools within SQL Server Business Intelligence module to analyze the extracted rules and perform visual-based validation, identifying interesting phenomena.
5.2.1. Association rule mining results
We use the data warehouse and Business Intelligence module constructed in Microsoft SQL Server Tradition Chinese Version as the data-mining tool. Figure 9 (Left) illustrates one of the results obtained from association rule mining, and shows support counts, alongside Cell IDs for which the support count is relatively high (also known as frequent itemsets). This represents cells with high traffic density. Figure 9 (Right) shows the rules and rule confidence values obtained from association rule mining. Take the rule 2081, 1911→1996 as an example: the rule means that after passing through Cell 2081 and Cell 1911, Cell 1996 will be passed through. On the other hand, the rule ShipType=60, 2315, 1467→1766 means that if ship type is equal to 60 (passenger ship) and it has passed through Cell 2315, Cell 1467, then it will pass through Cell 1766. By this method, traffic rules in the area of study can be understood. However, by using only the rules for presentation it is not easily understandable. We use the association analysis tool within SQL Server Business Intelligence module to perform a visualization rule induction. As shown in Figure 10 (Left), every node represents a cell with high traffic density. From this figure, we can understand the mutual states of heavy traffic nodes. In particular, we can note that the node 3543_4 has displayed a divergent phenomenon, showing that at 4 AM, traffic diverges at grid 3543. In Figure 10 (Right), node 3685_5_SW_H presents a convergent phenomena, showing that at 5 AM, ships frequently converge at high speeds in Cell 3685 region. Divergent or convergent regions represent traffic junctions where traffic situations are more complex and deserve extra attention. This form of display at the same time shows spatial and temporal characteristics.

Figure 9. (Left) Support for association rules; (Right) Confidence for association rules.

Figure 10. (Left). Node for traffic divergence; (Right) Node for traffic convergence.
5.2.2. Sequential pattern mining results
Figure 11 shows the result of using sequential pattern mining and the interaction between nodes displayed embodies chronological relationships. We have discovered that, between 4 AM and 5 AM, evident traffic convergence phenomena exists in the north or north-east grids of the study area, with ships turning into the cell at south or south-west direction at a high speed, arriving at Keelung Harbour after approximately 2 hours. Apart from this, at 6 PM and 11 PM, there is evident traffic flow pattern as ships of medium speed exit the port and head towards the north-east and north-west, leaving the area of study. This type of result matches the operating conditions of Keelung Harbour. As the port mainly operates from 8 AM, ships would adjust their speed to enter port around 7 AM and berth at the port around 8 AM to begin harbour operations. Therefore, between 4 AM and 5 AM, ships will start to converge at the north and north-east of the area of study, and traffic will become heavier. As the convergence time is the early morning and the region's winter monsoon is strong, the visibility would be poor and so, the convergence region will require VTS staff attention. As for the 6 PM exit port traffic flow, this is caused by container ships (that enter the ports in the morning) leaving the port after eight hours of operation in the day. The 11 PM exit port traffic flow is caused by ships rushing out of port before midnight in an effort to avoid an extra day's port charges. It can be noted that, for these two after-dark traffic flows, the visibility is poor and could converge with the busy transit traffic flow at the Taiwan Strait. Thus, at those times, the convergence locations require attention from VTS staff. Apart from the factors considered above, we have also added properties such as ship type, ship length and nationality to investigate their relationship with traffic flow, though we have not found obvious relationships here. However, we discovered that at around 11 PM, the outer harbour has a clear port exit pattern for ships of type 60. After further investigation, we found that this is due to ferries of Taiwan to offshore islands exiting port at 10 PM.

Figure 11. Traffic flow sequential patterns.
By observation of these two data mining methods' experimental results, we discover that spatial and temporal traffic flow regularities of sea areas can be found, which has potential to be used in the future in traffic flow simulation.
6. CONCLUSION AND RECOMMENDATIONS
Owing to the widespread installation of AIS transponders, VTS has rapidly accumulated large amounts of ship navigation data. Therefore, there is a need to perform effective and systematic analysis to uncover the hidden valuable information. Data mining techniques that originated from business marketing are a useful tool for obtaining valuable knowledge from a large amount of data. The present research applies data mining to knowledge discovery of data received from the AIS of VTS, recasting the business marketing problem as a marine traffic problem and solving it in a similar way. Standard data mining processing procedure is used as the framework for this research. By combining techniques such as Geographic Information System (GIS), database management systems, data warehousing and spatial and temporal data mining, processing and analysis operations on AIS observation data are performed with greater efficiency. Interesting insights are obtained as well as an understanding of Keelung Harbour's sea area with respect to navigation conditions such as ship distribution density, distribution of track, traffic flow, traffic volume, speed distribution and time pattern of traffic flow. In the future, following the installation of Long Range Identification and Tracking (LRIT), the extended range will be greater, the received data will be more abundant and the application domains of this research would be more widespread. The application domains can range from current VTS, marine traffic engineering, global traffic flow study to homeland security. Lastly, we have combined the experiences gained from the process of this research to provide the following suggestions for future research:
• At present, this research uses commercial vessels with AIS installed as the research subject. This does not truly reflect the actual shipping situation as there exist ships that do not follow conventional standards with no AIS installed. However, this can be improved through installation of Class B AIS Transceiver.
• It is possible that, due to instrument failure or human error, AIS received data may contain erroneous data or anomalous values. Such information would affect the results analyzed. Future research needs to design a more intelligent method to process and analyze data.
• In this research, the observation period was only 2 months. As such, month specific or season specific marine traffic patterns cannot be discovered. In the future, the observation period needs to be extended and longer periodic changes be investigated.
• In the future, additional spatial information of every grid, such as current speed, tide, geology and meteorology can be spatially joined into the dynamic data table to generate new derived attribute values. More complex relationship investigations and model construction could then be performed.
• Currently, we are only constructing association rule mining and sequential pattern mining models. The suitability of adding other data mining models could be investigated to construct a complete model base, thereby providing more prediction and simulation functions to facilitate marine traffic management decision-making support.
ACKNOWLEDGMENTS
We are grateful to Dr. Sheng-Long Kao and Mr. Chien-Min Su of the Marine GIS Research Centre in National Taiwan Ocean University for their assistance in providing resources for the AIS.


