


INTRODUCTION
Archaeological lime mortars offer the possibility of obtaining radiocarbon (14C) dates from the calcium carbonate (CaCO3) binder, which results from the incorporation of atmospheric CO2 during the carbonation of Ca(OH)2 (Labeyrie and Delibrias Reference Labeyrie and Delibrias1964; Boaretto and Poduska Reference Boaretto and Poduska2013; Ringbom et al. Reference Ringbom, Lindroos, Heinemeier and Sonck-Koota2014). Given the heterogeneous nature of lime mortars, which often include a mixture of pyrogenic, geogenic and diagenetic CaCO3, considerable efforts have been directed towards the identification of geogenic, 14C-free contaminants that may affect measurements by increasing the age of the mortar (Heinemeier et al. Reference Heinemeier, Ringbom, Lindroos and Sveinbjörndóttir2010; Hajdas et al. Reference Hajdas, Lindroos, Heinemeier, Ringbom, Marzaioli, Terrasi, Passariello, Capano, Artioli and Addis2017; Hayen et al. Reference Hayen, Van Strydonck, Fontaine, Boudin, Lindroos, Heinemeier, Ringbom, Michalska, Hajdas and Hueglin2017 and references therein). To date, CL by optical microscopy (OM-CL) has been one of the main screening methods for the identification of geogenic CaCO3 aggregates in powdered mortars, accompanied by thin section petrography of the relative undisturbed sample (e.g. Elsen Reference Elsen2006; Lindroos et al. Reference Lindroos, Heinemeier, Ringbom, Braskén and Sveinbjörndóttir2007; Al-Bashaireh Reference Al-Bashaireh2013; Hayen et al. Reference Hayen, Van Strydonck, Boaretto, Lindroos, Heinemeier, Ringbom, Hueglin, Michalska, Hajdas and Marzaioli2016). This method is based on the observation of luminescence of varying colors emitted by grains of CaCO3 when irradiated with a beam of electrons (Boggs and Krinsley Reference Boggs and Krinsley2006). However, much less emphasis has been placed on the assessment of the degree of preservation of binders, which may contain a significant amount of younger, diagenetic CaCO3 that can produce more recent ages (e.g. Lindroos et al. Reference Lindroos, Heinemeier, Ringbom, Braskén and Sveinbjörndóttir2007; Boaretto and Poduska Reference Boaretto and Poduska2013). Furthermore, high-resolution CL studies of archaeological mortars by scanning electron microscopy (SEM-CL) are scant (see Toffolo et al. Reference Toffolo, Regev, Mintz, Kaplan-Ashiri, Berna, Dubernet, Xin, Regev and Boaretto2020 in this volume). LIF, another luminescence-based analytical method, has not been used in the characterization of CaCO3 in archaeological plasters and mortars to select suitable samples for dating, but rather in the identification of pigments and organic molecules on CaCO3 substrates (e.g. Anglos et al. Reference Anglos, Solomidou, Zergioti, Zafiropulos, Papazoglu and Fotakis1996; Fantoni et al. Reference Fantoni, Caneve, Colao, Fiorani, Palucci, Dell’Erba and Fassina2013). Except for a recent SEM-CL/LIF study of experimental plasters (Toffolo et al. Reference Toffolo, Ricci, Caneve and Kaplan-Ashiri2019), LIF studies of mortars used for 14C dating have not been published to date. Nevertheless, the MoDIM 2018 conference highlighted the growing interest of the mortar dating community for these methods and their recent advancements. Therefore, the aim of this article is to provide an overview of the principles of CL and LIF, to review their application to the characterization of CaCO3 aggregates and binders in lime mortars selected for 14C dating, and to discuss current issues and possible solutions in the assessment of the degree of contamination of these materials. In addition, we provide examples of SEM-CL and LIF analyses of archaeological lime mortars using state-of-the-art instrumentation.
PRINCIPLES OF LUMINESCENCE
Cathodoluminescence
When a beam of high-energy electrons impinges on a semi-conductor crystal, most of the energy is absorbed and it generates phonons that are eventually released as heat, whereas part of the beam is converted to X-rays, secondary electrons, backscattered electrons, Auger electrons, and photons in the near UV, visible and near IR ranges. The latter phenomenon is called cathodoluminescence. The energy applied to the crystal promotes non-localized electrons from the valence band to the conduction band, where they remain for a short time. Upon decay to ground state, electrons move randomly through the gap between valence and energy bands, where they are trapped in defects of the crystal lattice, called luminescence centers, that occupy discrete energy levels. When electrons vacate traps part of the energy lost is converted into photons. The wavelength (color) of this emission is diagnostic for the identification of the type of trap in specific minerals (Boggs and Krinsley Reference Boggs and Krinsley2006). If we refer to the disciplinary field of mineralogy, luminescence centers may be intrinsic, such as vacancies and lattice imperfections, or extrinsic, such as ion substitutions. The latter can function as luminescence activators or quenchers, depending on the element and on the nature of the crystal. In CaCO3, intrinsic centers generate emissions that range from the near UV to the visible spectrum, where they exhibit a blue color (Table 1). The most common extrinsic centers include the activator Mn2+, which substitutes for Ca2+ and generates orange-red luminescence, and the quencher Fe2+ that suppresses luminescence intensity. Other activators are the rare earth elements, such as Pr3+, Nd3+, Sm3+, Eu2+/3+, Tb3+, Dy3+, Ho3+, and Er3+, which yield emissions ranging from blue to red (Machel Reference Machel, Pagel, Barbin, Blanc and Ohnenstetter2000). Most geogenic forms of CaCO3, e.g. limestone, exhibit orange-red luminescence caused by the occurrence of MnCO3 sites within the calcite crystal lattice (Richter et al. Reference Richter, Götte, Götze and Neuser2003).
Table 1 CL and LIF centers of CaCO3. Data from Toffolo et al. (Reference Toffolo, Ricci, Caneve and Kaplan-Ashiri2019).

Fluorescence
Luminescence in solids is formally divided into many types of phenomena according to the type of excitation source. As a result of absorption of photons, photoluminescence may give rise to fluorescence or phosphorescence, depending on the nature of the excited state. Fluorescence is the most common form of photoluminescence and is the preferred term when the emitting state and the final state have the same spin multiplicity, typically as a result of singlet-singlet electronic relaxation with lifetime near 10 ns. In phosphorescence, the emission is the result of triplet-singlet electronic relaxation—from a triplet excited state to singlet ground state—with longer lifetime from milliseconds to hours. The energy of the radiation emitted by decay depends on the levels affected by the transition of the electron, and therefore on the energy supplied for the excitation. The emitted fluorescence radiation has a lower energy and a longer wavelength than the incident radiation. The fluorescence phenomenon is influenced by the molecular structure, its rigidity, the state in which the molecule is located and a series of factors such as pressure and temperature. Another important factor is the molar absorption coefficient ε, present in the Lambert-Beer law, which is characteristic of each substance and on which the average lifetime of the excited state depends (Lakowicz Reference Lakowicz2006; Baudelet Reference Baudelet2014).
The photoluminescence of calcium carbonate involves transitions between electronic states in the crystal caused by specific activator elements often present in carbonates (Table 1). Fluorescence in minerals is sensitive to activator elements, impurity ions, defects, as well as chemical composition and crystal lattice (Gaft et al. Reference Gaft, Reisfeld, Panczer, Blank and Boulon1998; Salh Reference Salh and Basu2011), and it may be useful in detecting trace elements in minerals (Bozlee et al. Reference Bozlee, Misra, Sharma and Ingram2005; MacRae and Wilson Reference MacRae and Wilson2008). In laser-induced fluorescence (LIF) the excitation photons are provided by a laser. The narrow frequency spread of a laser has advantages in spectral resolution over incoherent light sources and temporal resolution. LIF is a non-destructive molecular spectroscopic technique used in various fields, including environmental monitoring and cultural heritage. Recently, LIF has been used as a diagnostic tool for artworks with successful results; however, despite the remarkable results obtained with this method, only a few archaeometric studies based on LIF have been published to date (Anglos et al. Reference Anglos, Solomidou, Zergioti, Zafiropulos, Papazoglu and Fotakis1996; Lazic et al. Reference Lazic, Colao, Fantoni, Palucci, Spizzichino, Borgia, Brunetti and Sgamellotti2003; Colao et al. Reference Colao, Caneve, Fantoni and Fiorani2008; Nevin et al. Reference Nevin, Spoto and Anglos2011; Vieira Ferreira et al. Reference Vieira Ferreira, Ferreira Machado, Ferraria, Casimiro and Colomban2013; Ricci et al. Reference Ricci, Caneve, Pedron, Holesch and Zendri2016). LIF spectroscopy can be considered as an innovative technique applied to the characterization of archaeological artworks that provides non-destructive and non-invasive qualitative analyses. Ongoing research at the Department of Geosciences at the University of Padua, in collaboration with the ENEA research center, explores the potential of LIF applied to the characterization of ancient mortars with the goal of determining their suitability for 14C dating.
Fluorescence spectroscopy alone cannot always provide an exhaustive assessment of the nature of the material analyzed, as the emission spectra are generally characterized by broad peaks where several factors of difficult interpretation influence the observed signal. Among these factors there are spectroscopic quantities, such as quenching, and experimental quantities, such as observation angle and optics transmission. Other characterization methods, e.g. infrared spectroscopy, may provide complementary phase identification (Toffolo et al. Reference Toffolo, Ricci, Caneve and Kaplan-Ashiri2019). Yet, fluorescence lifetime measurements, intensity of the emission and its spectral features may yield information that can assist in phase assessment (Donovan et al. Reference Donovan, Telle, Gonza, Telle, Ureña and Donovan2007).
ANALYTICAL SETUP
Cathodoluminescence by Optical Microscopy (OM-CL)
To date, most geologic and archaeological studies have been conducted using petrographic microscopes equipped for CL analysis, given their relatively low cost and ease of use. These instruments allow the observation of minerals and sediments in thin section (30 µm) or in powdered form through polarized transmitted light. The CL attachment consists of a vacuum chamber characterized by two windows of leaded glass, one at the top for observation and one at the bottom for the passage of transmitted light, which contains the sample holder and a stage for X-Y movement. An electron gun linked to the chamber provides a stationary, defocused beam of a few hundred micrometers aimed at the sample (resulting in an irradiated area up to 1 cm2 depending on the distance from the beam outlet), which generates the CL visible through the eyepiece of the microscope (Figure 1). The gun may be a “cold cathode” or a more powerful “hot cathode”. The former produces electrons at 10−2 torr (~1.3332 Pa) vacuum through steady discharge from a cathode at negative high voltage that are directed to an anode at ground potential, and it is used mostly for carbonates. The latter utilizes a heated tungsten filament at 10−5–10−6 torr (~0.0013–0.0001 Pa) to generate electrons, which are directed to the anode at lower voltages; this arrangement is used for the excitation of silicates (Richter et al. Reference Richter, Götte, Götze and Neuser2003; Boggs and Krinsley Reference Boggs and Krinsley2006).
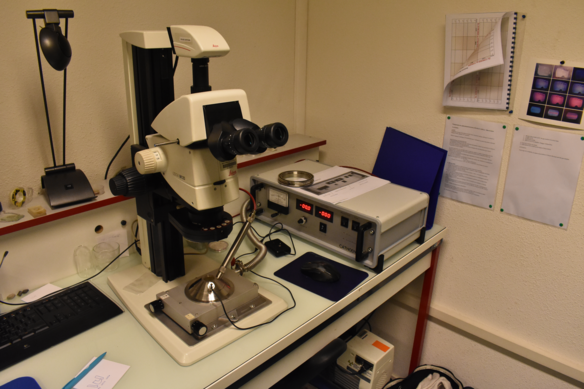
Figure 1 Petrographic microscope equipped with CL apparatus (IRAMAT-CRP2A, Université Bordeaux Montaigne).
The advantage of this setup lies in the possibility of observing the sample in thin section form in plane polarized light, crossed polarized light, and CL (Stoops Reference Stoops2003). However, it is less suitable for high-resolution structural studies, as the microscope cannot magnify over 500×. In addition, given the relatively large spot size of the electron beam, small crystals cannot be resolved. Furthermore, OM-CL does not provide a measurement of the wavelengths emitted by the sample and thus the observer must rely on the subjective interpretation of visible colors, which are often the result of two or more components and may include emissions in the UV and IR portions of the spectrum that are invisible to the human eye (Boggs and Krinsley Reference Boggs and Krinsley2006). A spectrograph with charged-couple device (CCD) detector may be attached to the microscope to obtain CL spectra, although it requires precise wavelength and intensity calibration with external standards and cannot provide accurate measurements below 380 nm (Götze et al. Reference Götze, Plötze and Habermann2001). Alternatively, hyperspectral imaging may be performed using an electron microprobe equipped with an optical microscope and a silicon CCD spectrograph with different diffraction gratings, which allow wavelength measurement between ~350–850 nm and point spacing of ~0.5 nm (Lee et al. Reference Lee, Martin, Trager-Cowan and Edwards2005).
Cathodoluminescence by Scanning Electron Microscopy (SEM-CL)
Scanning electron microscopes may be equipped with a CL detector, which captures the photons emitted by a sample after bombardment with an electron beam using a parabolic mirror that reflects photons to a light guide, and from there to a photomultiplier tube or solid-state diode that measures the intensity of the signal. The latter is recorded at each scanned location of the sample and presented as a 2D map. The wavelength of the emitted signal may be restricted to a specific range by using an optical filter or a spectrometer locked at a specific wavelength. Most recent instruments can perform wavelength-resolved CL, whereby emitted photons are dispersed through a diffraction grating-based spectrometer and collected by a CCD detector that determines intensity as a function of wavelength. As a result, a complete wavelength-resolved CL spectrum may be recorded pixel by pixel and displayed as a 3D output including intensity and wavelength spectrum (Figure 2). Samples may be analyzed in the form of powder, pellet, polished cast and thin section, and require carbon coating to avoid charging in the case of non-conductive materials such as CaCO3. Coating is not necessary for low-vacuum SEM. In addition, casts and thin sections should be prepared by embedding the sample in a non-luminescent resin, and should be polished to 1 µm using diamond paste for best results (Boggs and Krinsley Reference Boggs and Krinsley2006).

Figure 2 Scanning electron microscope equipped with CL detector (Moskowitz Center for Nano and Nano-Bio Imaging, Weizmann Institute of Science).
Compared to optical microscopy, SEM-CL allows much higher magnification using a scanning, focused beam characterized by a significantly smaller spot size of about 1 nm in diameter. State-of-the-art instrumentation offers the possibility of analyzing materials at 2-nm resolution while providing intensity and wavelength values for each point analysis or map in the 300–900 nm range. Therefore, CL spectra include the near UV and near IR ranges, which may be used in the study of luminescence centers in parallel with other methods, such as LIF, UV-induced fluorescence, thermoluminescence and Fourier transform infrared (FTIR) spectroscopy (e.g. Calderón et al. Reference Calderón, Aguilar, Jaque and Coy-Yll1984; Ricci et al. Reference Ricci, Caneve, Pedron, Holesch and Zendri2016; Mounier et al. Reference Mounier, Le Bourdon, Aupetit, Lazare, Biron, Pérez–Arantegui, Almazán, Aramendia, Prieto-Taboada and Fdez-Ortiz de Vallejuelo2018). Information from CL maps can be combined with views in secondary electrons and backscattered electrons modes, which allow the comparison of different phases within the same grain (Götze Reference Götze2012). A minor shortcoming in the analysis of unknown components in thin section is that minerals cannot be identified using transmitted light. However, energy dispersive spectroscopy (EDS) provides elemental characterization and in several cases, compounds may be determined by stoichiometry. Further, thin section analysis using OM may be performed prior to SEM-CL to locate specific areas and minerals of interest. Powders and pellets are usually characterized by FTIR or X-ray diffraction.
Laser-Induced Fluorescence (LIF)
Different types of LIF instruments are available, based on the layout of different components and laser wavelength. Figure 3 shows the LIF apparatus designed and assembled at the ENEA research center in Frascati (Rome) (Colao et al. Reference Colao, Caneve, Fantoni and Fiorani2008; Caneve et al. Reference Caneve, Spizzichino, Antonelli and Bertani2018). The UV beam originating from the laser is reflected by a mirror at 45°, then crosses a perforated mirror (3 mm in diameter) and is directed towards the remote target through a mobile mirror. The latter is mounted on two motorized axial movements controlled by the computer. The collected fluorescence radiation is focused at the entrance of an optical fiber linked to a compact QE PRO spectrometer from Ocean Optics working in the range 200–900 nm. An appropriate filter was placed in front of the fiber in order to avoid the backscattered radiation of the laser emission. No optical elements were used to collimate the laser beam and the resolution was approximately 1–2 mm, inferred from the spot size on the target. The spectrometer is connected to a PC where a LabView software is used to set experimental parameters, control the rotating mirror (thus allowing the scanning of the specimen surface), follow data acquisition and perform preliminary data analysis. Samples do not require preparation and may be analyzed at room conditions in their original form.

Figure 3 LIF apparatus (Technical Unit for the Development of Applications of Radiations, ENEA).
Materials and Methods of SEM-CL and LIF Examples
In addition to a review of the literature dealing with CL of mortars selected for 14C dating, in the following sections we provide practical examples of how SEM-CL and LIF analyses of experimental and archaeological lime binders may be used to identify carbon contaminants. Therefore, below we report the necessary experimental procedure.
SEM-CL
For this study, we selected an archaeological lime plaster from the medieval settlement of Shivta (Israel; henceforth “SHV”) (Tepper et al. Reference Tepper, Erickson-Gini, Farhi and Bar-Oz2018). The plaster was crushed in a mortar and the resulting powder was sieved to collect the fraction smaller than 50 µm. The latter was treated following the method of Toffolo et al. (Reference Toffolo, Regev, Mintz, Poduska, Shahack-Gross, Berthold, Miller and Boaretto2017), based on density separation using buffered sodium polytungstate (SPT) at 2.5 g/mL and a centrifuge. The detailed procedure for this sample is reported in Toffolo et al. (Reference Toffolo, Regev, Mintz, Kaplan-Ashiri, Berna, Dubernet, Xin, Regev and Boaretto2020 in this volume). By exploiting specific gravity, it is possible to roughly separate the light, pyrogenic carbonates that bear the 14C signature of the atmosphere at the time of plaster carbonation from the heavy, diagenetic/geogenic carbonates that introduce contamination (Toffolo et al. Reference Toffolo, Regev, Mintz, Poduska, Shahack-Gross, Berthold, Miller and Boaretto2017). Since residual geogenic contamination may occur in the light fraction, SEM-CL was used to detect orange emissions typical of limestone. For SEM-CL analysis, 5 mg of a purified binder were pressed into a 3-mm pellet using a hand press (PIKE Technologies). The pellet was mounted on an SEM stub using carbon tape and coated with a layer of carbon 7–8 nm thick using a sputter coater (Safematic CCU-010). To collect SEM-CL spectra we used a Gatan MonoCL Elite system equipped with a retractable diamond-turned mirror. The collected light was first imaged in panchromatic mode using a high-sensitivity PMT (photomultiplier tube) with a spectral range of 160–930 nm. The collected light was then directed to a monochromator and a CCD for parallel spectroscopy. The spectral range was set to 300–800 nm with a band pass of 20 nm by choosing the 150 lines/mm grating centered on 550 nm and 1 mm entrance slit. The CL system is installed on a Zeiss Gemini SEM 500, a high-resolution SEM equipped with a two-mode field emission gun. CL measurements were performed at 20 kV with an aperture of 20 µm in analytical gun mode. CL was collected in spectrum imaging (SI) mode, the pixel size and exposure time were fixed for each sample according to its CL intensity. The simultaneous SEM images were collected using the SE2 detector (Everhardt-Thornely detector). For each sample the SI was collected at several different regions of interest (ROI), then the spectra were analyzed by Gaussian fitting in order to extract the emission wavelength, the intensity and the full width half maximum (FWHM) of the different bands.
LIF
The samples presented in this article include geogenic CaCO3 standards (limestone and travertine from the Carnia region in Italy, chalk from Israel, different types of marble from the Carrara and Paros quarries) and archaeological lime binders isolated by wet gravimetric separation in a water column following the method of Addis et al. (Reference Addis, Secco, Preto, Marzaioli, Passariello, Brogiolo, Chavarria Arnau, Artioli and Terrasi2016, Reference Addis, Secco, Marzaioli, Artioli, Chavarria Arnau, Passariello, Terrasi and Brogiolo2019). Geogenic standards represent common contaminants introduced in mortars in the form of aggregate. Archaeological lime binders were obtained from mortars SS-V1 and ML-1, collected respectively at the Saint Vitale and Saint Agricola church in Bologna, Italy (11th–12th c.) and at a fortified complex located on the hill of Monte Lucio in Reggio Emilia province (13th c.). These mortars were characterized (see Supplementary Information) within the framework of two archaeological projects conducted by the Department of Cultural Heritage and Department of Geosciences at the University of Padua (Bandieri Reference Bandieri2017; Bergamo Reference Bergamo2017). Mortars were pretreated using the Cryo2Sonic method version 2.0 in order to extract from the bulk mortar the fine dateable fraction of the binder (Addis et al. Reference Addis, Secco, Marzaioli, Artioli, Chavarria Arnau, Passariello, Terrasi and Brogiolo2019; see also Ricci et al. Reference Ricci, Secco, Marzaioli, Terrasi, Passariello, Addis, Lampugnani and Artioli2020 in this volume). Binders were analyzed with LIF in order to evaluate the efficiency of the binder separation method based on the presence of fluorescent geogenic contaminants. Geogenic standards were used to build a reference database of contaminants. In the case of carbonate rocks, fresh breaks were analyzed to avoid altered surfaces that may influence the luminescence signal (Polikreti and Christofides Reference Polikreti and Christofides2007). In order to evaluate the spectra of archaeological binders against a known control sample, two aggregate-free lime plasters were analyzed for reference. One was obtained by drying lime putty at room conditions for 10 weeks (henceforth “LC”). The second was prepared by heating nari (chalk recrystallized by pedogenic processes) powder to 900°C for 1 hr to obtain quicklime, which was then mixed with excess deionized water and left to carbonate at room conditions (henceforth “PL”). Samples required no further preparation. LIF analyses were performed at the ENEA research center in Frascati (Rome). Experiments were carried out using a Thomson DIVA diode pulsed Nd:YAG laser with excitation wavelength of 266 nm, a repetition rate of 20 Hz with a pulse duration of 8 ns and a laser fluence of 0.9 mJ/cm2. Measurements were performed by scanning point by point and covering a surface of ca. 1.5 cm2. For each sample, 16 spectra were collected. Characteristic spectra were evaluated and spectral post-processing was carried out using Origin Pro 2018.
APPLICATIONS TO ARCHAEOLOGICAL LIME MORTARS
Mortars are composed of a lime binder whose mechanic properties and durability are enhanced by the addition of a coarse aggregate, which may include silicates (e.g. quartz sand, ceramic fragments, pozzolana), carbonates (e.g. limestone, dolomite), or both (Artioli Reference Artioli2010; Artioli et al. Reference Artioli, Secco and Addis2019). Aggregates are usually mixed with the Ca(OH)2 paste before it sets. With regard to CL, lime binder and aggregate have been investigated to significantly different degrees of detail. Given that they include different types of carbon contamination, we divide the following discussion of the literature on the subject based on this distinction. In addition, we provide representative analyses and propose new directions for future research.
Aggregate
Carbonate Rocks
Carbonate aggregates, such as limestone, chalk, marble, travertine and dolomite, are a major problem for accurate dating of mortars, as they do not contain 14C or they undergo dissolution and reprecipitation processes that introduce an unknown amount of younger 14C (for contamination from younger carbon, see following section on “Binder”). In addition, unaltered or partially calcined fragments of the raw material may end up as coarse inclusions in quicklime before the latter is mixed with the aggregate (Boaretto and Poduska Reference Boaretto and Poduska2013; Murakami et al. Reference Murakami, Hodgins and Simon2013). The presence of these contaminants prompted the use of OM-CL in the investigation of mortars samples with the aim of avoiding unwanted phases and improving the accuracy of 14C measurements.
CL characterization of ancient mortars for 14C dating was first proposed by Heinemeier et al. (Reference Heinemeier, Jungner, Lindroos, Ringbom, von Konow and Rud1997), who reported that limestone exhibits orange-red luminescence in thin section, whereas the lime binder is “tile-red to brown” in color. This information was used in the selection of suitable size fractions for CO2 recovery through acid hydrolysis of CaCO3. Several mortars from churches in the Åland Islands (Finland) were extensively characterized and provided a testing ground for the method (Lindroos Reference Lindroos2005; Lindroos et al. Reference Lindroos, Heinemeier, Ringbom, Braskén and Sveinbjörndóttir2007; Heinemeier et al. Reference Heinemeier, Ringbom, Lindroos and Sveinbjörndóttir2010). In following years, OM-CL became a routine step in the analysis of mortars prior to dating and a number of studies focused on Europe, Levant and Mesoamerica showed its effectiveness as initial screening method for samples affected by geogenic “dead” carbon (Lindroos et al. Reference Lindroos, Regev, Oinonen, Ringbom and Heinemeier2012; Al-Bashaireh and Hodgins Reference Al-Bashaireh and Hodgins2012; Murakami et al. Reference Murakami, Hodgins and Simon2013; Al-Bashaireh Reference Al-Bashaireh2013; Lindroos et al. Reference Lindroos, Orsel, Heinemeier, Lill and Gunnelius2014b; Lichtenberger et al. Reference Lichtenberger, Lindroos, Raja and Heinemeier2015; Michalska and Czernik Reference Michalska and Czernik2015; Prevosti et al. Reference Prevosti, Lindroos, Heinemeier and Coll2016; Murakami Reference Murakami2016). Quantification of contaminants by image analysis of OM-CL photomicrographs provides rough estimates, which are however difficult to relate to size fractions due to the overall heterogeneity of the sample and variable luminescence of some components (Lindroos et al. Reference Lindroos, Heinemeier, Ringbom, Braskén and Sveinbjörndóttir2007: 60). This method was used by Murakami et al. (Reference Murakami, Hodgins and Simon2013) to correlate the presence of varying amounts of partially calcined limestone fragments in lime plasters from Teotihuacan (Mexico) with δ13C values of the same samples obtained through sequential acid hydrolysis. Results show that there is a direct correlation between CL image analysis and carbon stable isotopes, i.e. samples with low percentage of partially calcined or unburnt limestone observed with CL exhibit low δ13C values (e.g. <–12.00‰), the latter being characteristic of pyrogenic carbonates (e.g. Pachiaudi et al. Reference Pachiaudi, Marechal, Van Strydonck, Dupas and Dauchot-Dehon1986). The best-preserved sample based on CL image analysis and δ13C results (–14.00‰) produced a 14C date that matched its expected age, whereas other samples that appeared poor in partially calcined/unburnt fragments and had relatively low δ13C (–11.00‰ to –13.00‰) yielded ages older by a few hundred calendar years caused by dead carbon contamination (Murakami et al. Reference Murakami, Hodgins and Simon2013). This means that CL image analysis of thin sections cannot be used as a secure proxy for the absence of geogenic components, and that the relationship between δ13C value of each acid hydrolysis step and relative 14C content is still poorly understood. This may be explained by the fact that micrometer-sized geogenic components cannot be resolved by OM-CL. These components affect only slightly the δ13C values, which for pyrogenic CaCO3 may range between –12.00 and –30.00‰, yet they affect much more 14C measurements. In fact, only 1% contamination from dead carbon is necessary to add 80 years of apparent age to the sample (Bowman Reference Bowman1990).
From the abovementioned studies, it appears that OM-CL is effective in the identification of relatively coarse geogenic contaminants belonging to the aggregate fraction or to the unreacted raw material used for quicklime production, but not in determining the presence of crystals that are too small to be resolved, especially when mixed with other phases in a thin section or powder (Heinemeier et al. Reference Heinemeier, Ringbom, Lindroos and Sveinbjörndóttir2010: 189). This finer fraction may however affect age determinations by lowering their accuracy. One response to this issue was proposed by Heinemeier et al. (Reference Heinemeier, Ringbom, Lindroos and Sveinbjörndóttir2010), who used 14C profiles built on sequential acid hydrolysis of mortars to identify contamination based on comparison with estimates of the expected age of the sample. More recent studies focused instead on removing all geogenic contaminants by exploiting their specific gravity, which is higher compared to that of the pyrogenic lime binder. More specifically, Addis et al. (Reference Addis, Secco, Preto, Marzaioli, Passariello, Brogiolo, Chavarria Arnau, Artioli and Terrasi2016, Reference Addis, Secco, Marzaioli, Artioli, Chavarria Arnau, Passariello, Terrasi and Brogiolo2019) and Ricci et al. (Reference Ricci, Secco, Marzaioli, Terrasi, Passariello, Addis, Lampugnani and Artioli2020 in this volume) used particle settling in water columns to separate different size fractions, whereas Toffolo et al. (Reference Toffolo, Regev, Mintz, Poduska, Shahack-Gross, Berthold, Miller and Boaretto2017) and Toffolo et al. (Reference Toffolo, Regev, Mintz, Kaplan-Ashiri, Berna, Dubernet, Xin, Regev and Boaretto2020 in this volume) employed centrifugation of a buffered sodium polytungstate (SPT) solution at predefined density. These purification methods allowed accurate age determinations, although some materials may still show evidence of contamination due to the presence of micritic geogenic crystals intergrown with pyrogenic ones, which result in a composite specific gravity. Toffolo et al. (Reference Toffolo, Regev, Mintz, Poduska, Shahack-Gross, Berthold, Miller and Boaretto2017) proposed to overcome this problem by recovering carbon via thermal decomposition of the purified fraction in vacuum, based on the fact that pyrogenic carbonates decompose at lower temperature compared to their geogenic counterparts. However, the presence of geogenic contamination may be determined prior to carbon recovery using SEM-CL. Figure 4 shows an example of SEM-CL analysis of the SHV archaeological plaster purified by density separation (see Toffolo et al. Reference Toffolo, Regev, Mintz, Kaplan-Ashiri, Berna, Dubernet, Xin, Regev and Boaretto2020 in this volume for details about 14C dating results). Figure 4A displays a secondary electron SEM image including the analyzed ROI, whereas Figure 4B reports a spectrum imaging map with colored pixels representing the different acquisitions (4.3 × 4.3 µm). Most point analyses of CaCO3 locales (based on EDS elemental maps) indicate a strong blue intrinsic luminescence at 450 nm that is characteristic of the pyrogenic lime binder (see following section), whereas geogenic contaminants are represented by only a few orange emissions at 620 nm caused by the presence of Mn2+ in the crystal lattice of CaCO3 (Figure 4C). This information may be used in the assessment of the degree of purity of powders for thermal decomposition or acid hydrolysis. Considered the small size of the pellet (3 mm), automated mapping may yield large datasets in a relatively short time.

Figure 4 Example of SEM-CL data output based on a medieval plaster from Israel: (a) secondary electron image of pellet; the green square highlights the region of interest; (b) spectrum imaging map showing emission colors; each pixel represents a measurement; (c) representative CL spectrum.
At present, no LIF studies of mortars are available in the literature. Therefore, we present here the results obtained from a few representative samples of common contaminants introduced as aggregates in mortars. Spectra show strong luminescence bands characteristic of calcite that are caused by activator elements, defects and intrinsic luminescence. As stated, spectra interpretation may be difficult for broad luminescence peaks, in which case peak deconvolution becomes necessary. LIF spectra of marble (Figure 5) are characterized by a transition at high energy represented by one or multiple peaks in the region 340–364 nm, as well as a peak at 470 nm, which may be due to structural defects and the contribution of Ce3+, Pb2+, Tm3+ and Dy3+. The peaks at 343 and 364 nm are most likely due to the occurrence of Ce3+ (Chapoulie et al. Reference Chapoulie, Bechtel, Borschneck, Schvoerer and Remond1995). The band at 470 nm is not symmetrical and thus it is the result of multiple components. Peak deconvolution (Figure 6) may show the presence of a band at higher wavelength (570–604 nm) that can be associated with Mn2+ and Mn4+ substituting for Ca2+ in the crystal lattice (Calderón et al. Reference Calderón, Aguilar, Jaque and Coy-Yll1984; Habermann et al. Reference Habermann, Neuser and Richter1998; Polikreti and Christofides Reference Polikreti and Christofides2007; Gaft et al. Reference Gaft, Reisfeld and Panczer2015). Limestone, chalk and travertine are characterized by an intense and broad band at 505-563 nm (Figure 5). Peak deconvolution showed that the main band may be a composite of three different contributions at 434–465 nm (intrinsic center), 531–546 nm (extrinsic centers such as Tm3+, Tb3+ and Dy3+) and 639–657 nm (extrinsic centers Mn2+ and Mn4+). Furthermore, the presence of Fe2+, which can act as luminescence quencher, has to be considered since it may suppress bands around 400–420 nm, whereas bands from 520 nm up to 700 nm are observed (Habermann et al. Reference Habermann, Neuser and Richter1998). The luminescence spectrum of limestone presents the main broad band shifted to higher wavelength due to the presence of dolomite. The main emission appears to be composed by two bands, one at lower wavelength related to Mn2+ substitution for Ca2+ and the second at higher wavelength to Mn2+ substitution for Mg2+ in the dolomite crystal lattice (Boggs and Krinsley Reference Boggs and Krinsley2006). This information may be used in the identification of geogenic contaminants in mortars. Furthermore, supporting the LIF data presented herein, REE and trace elements concentrations related to the typical extrinsic luminescence centers of CaCO3 were previously investigated by inductively coupled plasma mass spectrometry (ICP-MS) and the results are available in Toffolo et al. (Reference Toffolo, Ricci, Caneve and Kaplan-Ashiri2019).

Figure 5 LIF spectra of carbonate rocks, including: (a) different types of marbles; (b) chalk, limestone and travertine. Travertine should be compared to the blue scale on the right, whereas limestone and chalk should be compared to the black scale on the left.

Figure 6 Peak fitting of LIF spectra of white Carrara marble (a), travertine (b) and limestone (c), with relative peak locations (d).
Pozzolana and Ceramics
In antiquity, Romans made extensive use of pozzolana and crushed ceramics (the latter also known as cocciopesto) as aggregate to produce hydraulic binders able to set underwater (Artioli Reference Artioli2010; Artioli et al. Reference Artioli, Secco and Addis2019). Pozzolana is an amorphous silicate produced during volcanic eruptions, and its luminescence properties are poorly known (e.g. Correcher et al. Reference Correcher, Gomez–Ros, Dogan, Garcia-Guinea and Topaksu2017). Ceramics, on the other hand, have been extensively studied using CL from the point of view of provenience and manufacturing techniques (e.g. Bechtel and Schvoerer Reference Bechtel, Schvoerer, Hackens and Schvoerer1984; Chapoulie et al. Reference Chapoulie, Delery, Daniel and Vendrell-Saz2008; Hunt Reference Hunt2013). Quartz, one of the main components of ceramics has usually a purple CL color, potassic feldspars an intense blue-green, plagioclase feldspars yellow, calcites orange, zircons intense yellow, kyanites red, and these associations may be used to distinguish entire ceramic assemblages (e.g. Chapoulie and Daniel Reference Chapoulie and Daniel2007; Chapoulie et al. Reference Chapoulie, Robert and Casenave2016; Chapoulie Reference Chapoulie2018; Chapoulie and Del Solar-Velarde Reference Chapoulie and Del Solar-Velarde2018). Different groups of ceramics may be determined using a chemometric approach to data treatment including CL image processing based on RGB color histogram analysis (Ammari et al. Reference Ammari, Del Solar, Chapoulie and Bousquet2016). High-temperature phases, such as gehlenite, anorthite, mullite and wollastonite, can be identified by CL in order to reconstruct firing temperatures, atmospheres, and starting materials (Piponnier et al. Reference Piponnier, Bechtel, Floorin, Molera, Schvoerer and Vendrell1997; Cultrone et al. Reference Cultrone, Rodriguez-Navarro, Sebastian, Cazalla and De La Torre2001). The occurrence of these silicate phases and the possibility to map their distribution inside ceramic and pozzolana fragments and dispersed within the lime binder becomes especially important when considering their reaction with hydrated lime. Pozzolana and ceramic fragments trigger hydraulic reactions, which in turn promote the nucleation of a number of secondary phases, including carbon contaminants such as the layered double hydroxides (LDH) (Artioli Reference Artioli2010; Mills et al. Reference Mills, Christy, Génin, Kameda and Colombo2012; Addis et al. Reference Addis, Secco, Preto, Marzaioli, Passariello, Brogiolo, Chavarria Arnau, Artioli and Terrasi2016; Artioli et al. Reference Artioli, Secco, Addis, Bellotto and Pöllmann2017). Despite the large body of CL data on ceramics, little is known about phases produced by their reaction with Ca(OH)2 during mortar carbonation. Currently, the dearth of CL and LIF studies on these materials hinders a proper understanding of their role as carbon-bearing contaminants for 14C dating, given that only some of them are known to produce fluorescence and photoluminescence (e.g. Zhao et al. Reference Zhao, Li, Fang, Chu, Ma and Yang2012; Li et al. Reference Li, Qi, Li, Li and Hou2014). Spatially resolved CL and LIF characterization of ceramic fragments embedded in mortars, together with their degradation products, alteration rims and secondary phases formed during hydraulic reactions, could provide crucial information regarding the occurrence and distribution of contaminants.
Binder
Except for the assessment of their overall color, lime binders are practically terra incognita in CL studies. Yet, this is the portion of mortars that is supposed to provide accurate age determinations, since it forms from the reaction of atmospheric CO2, which contains 14C, with Ca(OH)2 (Labeyrie and Delibrias Reference Labeyrie and Delibrias1964; Artioli Reference Artioli2010). When Ca(OH)2 aggregates (which we call here “lime lumps”) do not immediately react with CO2 due to insufficient exposure to air, CaCO3 nucleates at a later stage, thus introducing significant amounts of younger carbon (Boaretto and Poduska Reference Boaretto and Poduska2013). However, another major contamination issue in lime binders is the tendency of CaCO3 to dissolve when exposed to groundwater enriched in carbonic acid. This process favors the incorporation of older or younger environmental carbon into CaCO3, which reprecipitates into larger crystals following Ostwaldʼs Rule of Stages (Ostwald Reference Ostwald1897). As a result, the original isotopic composition of CaCO3 is lost and accurate dating may not be possible if the mortar is extensively recrystallized (Poduska et al. Reference Poduska, Regev, Berna, Mintz, Milevski, Khalaily, Weiner and Boaretto2012; Boaretto and Poduska Reference Boaretto and Poduska2013).
Contamination from secondary CaCO3 in lime binders has been somewhat overlooked in mortar dating (e.g. Michalska and Czernik Reference Michalska and Czernik2015), and consequently CL characterization has been limited to the identification of lime binder and lime lumps based on colors, with no insights into diagenetic phases. Lime binders have been described using a large number of hues, including tile red, dull purple, brown, dark brown, grey, dull grey and black, which highlight the subjective nature of the observation rather than pronounced compositional differences between samples (Lindroos et al. Reference Lindroos, Heinemeier, Ringbom, Braskén and Sveinbjörndóttir2007; Heinemeier et al. Reference Heinemeier, Ringbom, Lindroos and Sveinbjörndóttir2010; Murakami et al. Reference Murakami, Hodgins and Simon2013). Lime lumps instead show a mixture of non-luminescent and orange-red areas (Lindroos et al. Reference Lindroos, Heinemeier, Ringbom, Braskén and Sveinbjörndóttir2007; Murakami et al. Reference Murakami, Hodgins and Simon2013; Lindroos et al. Reference Lindroos, Ranta, Heinemeier and Lill2014a).
As stated above, one major shortcoming of OM-CL is its reliance on colors, especially when multiple emissions from the same crystal result in a composite hue, e.g. blue and red may result in brown or purple (e.g. Richter et al. Reference Richter, Götte, Götze and Neuser2003). Since each color component represents one discrete energy level and thus one specific CL center, when these are mixed it is impossible to assess with confidence the origin of some signals that may be important for tracking the diagenetic history of the binder. This problem may be tackled by analyzing powders with wavelength-resolved SEM-CL. In a recent study using SEM-CL and LIF, Toffolo et al. (Reference Toffolo, Ricci, Caneve and Kaplan-Ashiri2019) showed that experimental, aggregate-free lime plasters composed of pyrogenic calcite or mixtures of pyrogenic calcite and aragonite exhibit strong blue luminescence at 450 nm, together with minor orange luminescence at 610 nm, whereas chalk used to produce plasters emits almost only orange luminescence (see also Figure 4). A similar trend emerged using LIF, which shows blue emissions from surface analysis of the same plaster specimens. When seen together, these color components produce a purple hue similar to what was observed with OM-CL in previous studies. The authors interpreted the strong blue component as a result of the displacement of Mn2+ out of the crystal lattice of CaCO3 during thermal decomposition of limestone, and preferential precipitation of CaCO3 over MnCO3 during the carbonation of Ca(OH)2 in the binder (e.g. Sternbeck Reference Sternbeck1997), resulting in lower concentrations of MnCO3 sites that give rise to orange luminescence in the final product. In addition, the relatively high Eh of setting mortars favors the precipitation of Mn in oxide form, rather than carbonate (Machel Reference Machel, Pagel, Barbin, Blanc and Ohnenstetter2000). According to this model, the non-luminescent areas in lime lumps are presumably unreacted Ca(OH)2 aggregates that do not emit light, whereas orange-red areas are well-carbonated portions that incorporated Mn2+ upon nucleation of CaCO3. Therefore, the emission at 450 nm would represent intrinsic luminescence centers caused by lattice distortions accumulated by calcite during its nucleation, although at present it is not possible to assign the 450 nm peak and its minor components to specific defects. A similar process was postulated by Kusano et al. (Reference Kusano, Nishido and Inoue2014), who observed a double blue-orange luminescence in SEM-CL spectra of limestone and dolomite altered by temperatures >800°C during metamorphic processes in geologic skarn formations.
In their study, Toffolo et al. (Reference Toffolo, Ricci, Caneve and Kaplan-Ashiri2019) also observed a correlation between FTIR and SEM-CL. Experimental and archaeological plasters composed of poorly ordered (i.e. pyrogenic) calcite crystals as determined using FTIR grinding curves, show also a dominant blue luminescence, which can thus be used as a proxy for good preservation of the lime binder. In the future, the relative intensities of blue and orange emissions could be calibrated against known amounts of well-ordered and poorly ordered calcites to produce quantitative assessments of the degree of preservation of lime binders prior to carbon recovery. In addition, SEM-CL could be used in combination with FTIR to better characterize orange luminescence caused by diagenesis as opposed to similar luminescence produced by pristine geogenic components. Furthermore, as stated above other minerals besides CaCO3 may form in the binder and introduce contaminants. For instance, hydraulic reactions between Ca(OH)2 and silicate phases such as crushed ceramics or volcanic ash produce LDH that contain carbonate groups (e.g. Mills et al. Reference Mills, Christy, Génin, Kameda and Colombo2012; Artioli et al. Reference Artioli, Secco, Addis, Bellotto and Pöllmann2017). Some of these minerals have been shown to incorporate CO2 when exposed to the atmosphere, and therefore are a major concern for 14C dating (Ishihara et al. Reference Ishihara, Sahoo, Deguchi, Ohki, Tansho, Shimizu, Labuta, Hill, Ariga and Watanabe2013; Sahoo et al. Reference Sahoo, Ishihara, Yamada, Deguchi, Ohki, Tansho, Shimizu, Eisaku, Sasai and Labuta2014). Characterization with SEM-CL and LIF could help their identification prior to dating (e.g. Zhao et al. Reference Zhao, Li, Fang, Chu, Ma and Yang2012; Li et al. Reference Li, Qi, Li, Li and Hou2014).
In this study, LIF was used to distinguish pure binder fractions from those which present contamination from geogenic carbonates. Here we present for the first time an example of the application of LIF to the characterization of archaeological lime binders purified by wet gravimetric separation. The two purified archaeological binders were first investigated by OM-CL, which showed a widespread orange luminescence caused by the presence of finely dispersed geogenic calcite (Supplementary Figure 3). Mortar SS-V1 includes partially carbonated lime lumps that emit orange luminescence. Mortar ML-1 contains a large proportion of carbonate aggregate that could not be eliminated completely by gravimetric sedimentation. Experimental lime plasters (LC and PL) analyzed using LIF show weak luminescence in the blue range, whereas the fine binder fractions of mortars SS-V1 and ML-1 exhibit luminescence in the green-yellow range with possible additional bands in the orange-red range (Figure 7). Peak deconvolution suggests the occurrence of other bands in the yellow-orange region due to extrinsic luminescence centers represented by Mn2+ substitution for Ca2+, which is characteristic of geogenic carbonates (Figure 8).

Figure 7 LIF spectra of archaeological and experimental lime binders (a), including comparison with limestone (b). ML-1 and SS-V1 are archaeological binders, whereas LC and PL are experimental binders.

Figure 8 Peak fitting of LIF spectra of ML-1 (a) and SS-V1 (b) mortars, LC (c) and PL (d) experimental binders, and relative peak locations (e).
CONCLUSIONS
The characterization of mortars for 14C dating is crucial in order to avoid unwanted contaminants that may affect the accuracy of measurements. The use of OM-CL has produced encouraging results as pre-screening method to remove coarse geogenic aggregates. However, high-accuracy dating requires taking into consideration other sources of contamination, such as Ca(OH)2, diagenetic CaCO3 and secondary phases produced during hydraulic reactions. These phases may occur in small amounts and yet represent a problem for accurate dating. Recent research has indicated that even small amounts of these secondary phases may considerably alter 14C dates. Therefore, higher resolution is required when characterizing carbonate-bearing phases using luminescence. In this study we have shown that CL performed via SEM and LIF can yield more detailed results and identify small amounts of contamination, which can then be removed prior to dating. Future research will attempt at quantifying the degree of contamination based on the degree of structural order of carbonate phases, targeting especially all of the secondary fractions.
ACKNOWLEDGMENTS
This research was supported by a grant from IdEx Bordeaux to Michael Toffolo (grant n. ANR-10-IDEX-03-02). Giulia Ricci would like to thank Gilberto Artioli (supervisor) and Michele Secco for their support and for encouraging this work in the research topic of radiocarbon dating of historical mortars, and Cecilia Bandieri and Martina Bergamo for the historical mortar characterization data and the OM-CL pictures. Michael Toffolo would like to thank Yan Xin and Elisabetta Boaretto for providing a sample of medieval plaster for SEM-CL analysis. The SEM-CL imaging and spectroscopy were performed at the Moskowitz Center for Nano and Nano-Bio Imaging, Weizmann institute of Science.
SUPPLEMENTARY MATERIAL
To view supplementary material for this article, please visit https://doi.org/10.1017/RDC.2020.21


