Introduction
Landraces and historic varieties are a rich portion of the bread wheat gene pool (Newton et al., Reference Newton, Akar, Baresel, Bebeli, Bettencourt, Bladenopoulos, Czembor, Fasoula, Katsiotis, Koutis, Koutsika-Sotiriou, Kovacs, Larsson, Pinheiro de Carvalho, Rubiales, Russell, dos Santos and Vaz Patto2010). On the one hand, while modern varieties are a result of intended breeding, landraces lack formal crop improvement and are considered dynamic, genetically diverse and locally adapted populations with distinct identity; on the other hand, historic varieties are regarded as relatively homogeneous selections made within landraces, or early breeding releases, that were once on a variety registration list but are no longer in use (Camacho Villa et al., Reference Camacho Villa, Maxted, Scholten and Ford-Lloyd2005; Serpolay et al., Reference Serpolay, Dawson, Chable, Lammerts Van Bueren, Osman, Pino, Silveri and Goldringer2011). Generally, both types of ‘exotic’ wheats have evolved from a broader germplasm pool and therefore are a valuable and yet underutilized resource for breeding purposes.
Since N. I. Vavilov and H. Harlan started to collect seeds in the beginning of the last century, a number of seed genebank collections have been assembled and reproduced (Börner, Reference Börner2006). The extent of the genetic diversity of this germplasm needs to be described and evaluated to safeguard natural genetic variability and genomic integrity, and to provide a wider basis for the choice of parents for breeding purposes. In addition to traditional morphological and agronomic traits (Denčić et al., Reference Denčić, Kastori, Kobiljski and Duggan2000; Dotlačil et al., Reference Dotlačil, Hermuth, Stehno, Dvoráček, Bradová and Leišová2010), and biochemical and physiological characteristics (Gregová et al., Reference Gregová, Hermuth, Kraic and Dotlačil2006), the developments in DNA marker technologies made the genetic variation available in the old germplasm more accessible. Studies on the molecular diversity of landraces and old varieties from France (Roussel et al., Reference Roussel, Koenig, Beckert and Balfourier2004), Russia (Khlestkina et al., Reference Khlestkina, Röder, Efremova, Börner and Shumny2004), Ukraine (Chebotar, Reference Chebotar2004), Portugal (Ribeiro-Carvalho et al., Reference Ribeiro-Carvalho, Guedes-Pinto, Igrejas, Stephenson, Schwarzacher and Heslop-Harrison2004) and Oman (Al Khanjari et al., Reference Al Khanjari, Hammer, Buerkert and Röder2007) have been reported.
Bread wheat is the most important crop in the countries of the Black Sea (BS) region. Old Bulgarian germplasm grown to the west of the BS basin was noted for its stable yield, drought tolerance, high protein content, or good bread-making quality (Majdrakov, Reference Majdrakov1945). The gene pool of wheat grown on the territory of Ukraine, including its southern regions, has a long history, as evidenced by archaeological excavations and historical documents (Khvoiko, Reference Khvoiko1909). High-yielding Crimean hard red wheat varieties have been shown to participate in the pedigrees of popular European and American varieties (Smale, Reference Smale, Crossa, del Toro, Dubin, Fischer, Fox, Khairallah, Mujeeb-Kazi, Nightingale, Ortiz-Monasterio, Rajaram, Singh, Skovmand, van Ginkel, Varughese and Ward1996). The Georgian soft free-threshing landraces are all ancient wheats of various flowering habits, increased tillering, yield stability, disease resistance and grain quality (Jorjadze et al., Reference Jorjadze, Berishvili and Shatberashvili2014). Most of this germplasm is not cultivated any longer and is nearly extinct. Seed samples have been maintained and reproduced by the large European seed genebanks in Germany, Russia, Czech Republic and Ukraine.
This study presents the comparative analysis of molecular genetic diversity based on microsatellite markers, and the agronomic performance of landraces and historic varieties from the BS basin. The genetic relationships within this old germplasm as well as some issues related to diversity preservation in seed genebanks are discussed herein.
Materials and methods
Plant material
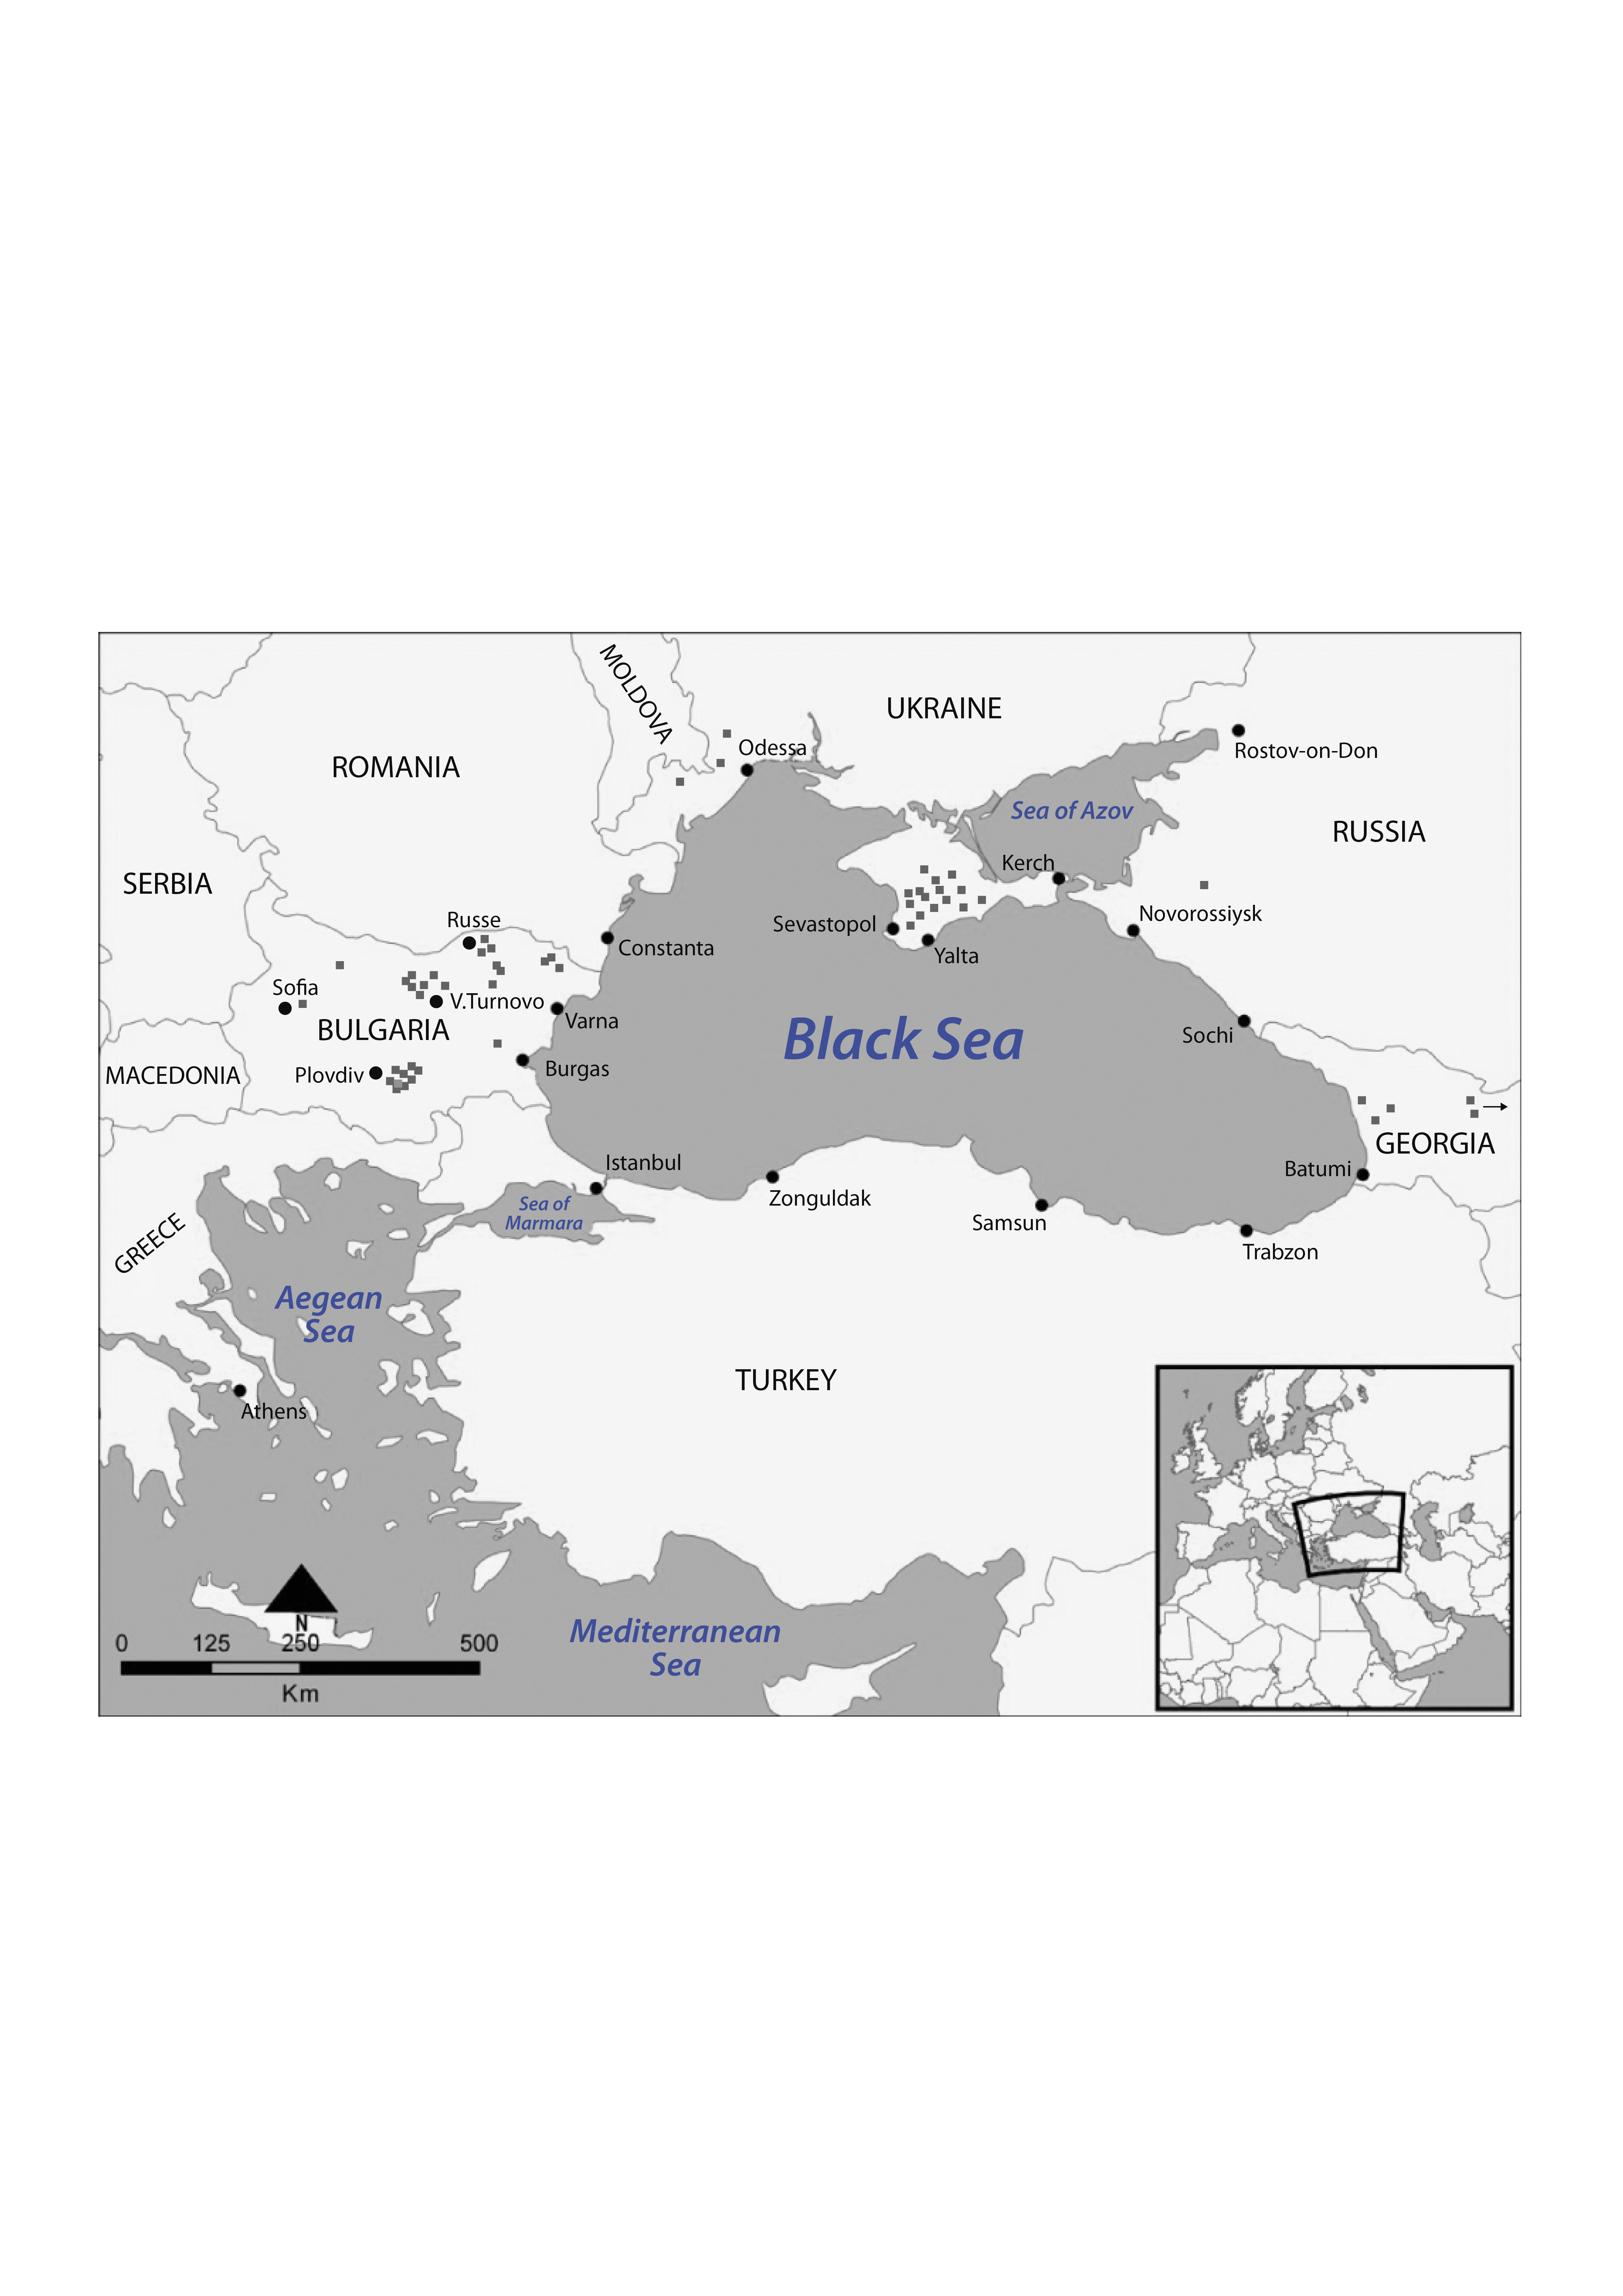
A total of 52 wheat (Triticum aestivum L.) landraces and historic varieties from the countries of the BS region were used in the present study (Table S1; Fig. S1, available online). All accessions were collected or developed before 1950; thereafter, they have been maintained and reproduced by seed genebanks at the Leibniz Institute of Plant Genetics and Crop Plant Research (IPK), Gatersleben, Germany, and the Vavilov Institute for Plant Industry (VIR), St Petersburg, Russia. Seed samples were kindly provided by the two genebanks. The accessions were classified into two groups according to their geographic origin: BS-West, including the accessions from Bulgaria (28), and BS-Northeast, comprising the accessions from Ukraine, Russia and Georgia (24).
DNA extraction and microsatellite analysis
For each accession, four to six (on average five) seedlings were pooled and their DNA was isolated by a mini-prep method adapted from Rogowsky et al. (Reference Rogowsky, Guidet, Langridge, Shepherd and Koebner1991). A total of 24 primer pairs flanking wheat microsatellites and amplifying loci on 14 linkage groups (Table 1) were selected according to their chromosome arm location, level of polymorphism detected and feasibility of allele scoring, including the absence of stutter fragments. Microsatellite designation, composition, primer sequences and chromosome location of the amplified loci have been reported by Devos et al. (Reference Devos, Bryan, Collins, Stephenson and Gale1995) and Röder et al. (Reference Röder, Korzun, Wendehake, Plaschke, Tixier, Leroy and Ganal1998). All the primer pairs amplified a single locus, except for one that amplified orthologous loci, one on each of chromosomes 5A and 5D. The polymerase chain reaction (PCR) was performed according to Röder et al. (Reference Röder, Korzun, Wendehake, Plaschke, Tixier, Leroy and Ganal1998), with 35 instead of 45 cycles of denaturation for 1 min at 94°C, annealing for 1 min at 50°C (55 or 60°C depending on the primer) and extension for 1 min at 72°C followed by a final extension step for 5 min at 72°C. PCR products were separated using the 3130xl Genetic Analyzer (Applied Biosystems, Carlsbad, CA, USA) according to the manufacturer's instruction. The Genotyper® software (Applied Biosystems, Carlsbad, CA, USA) was used to assess the fragment size of the alleles at each microsatellite locus.
Table 1 Microsatellite allelic polymorphism in 52 old bread wheat accessions from the BS region (BS-West, 28 accessions from Bulgaria; BS-Northeast, 24 accessions from Ukraine, Russia and Georgia)

Diversity analysis
For each geographic region and for the total sample, genomic diversity was evaluated based on (1) allelic richness as a measure of genetic variation (number of alleles and average number of alleles per locus); (2) private allelic richness as a measure of genetic distinctiveness (number of specific alleles found in one geographic group but absent in the other); (3) occurrence of unique alleles as another measure of distinctiveness (alleles that occur in one accession in a group or in the whole gene pool); (4) polymorphic information content (PIC) of each marker as a measure of gene diversity, which is calculated by assuming homozygosity according to the formula:
 $$\begin{eqnarray} PIC = 1 - \sum p _{ i }^{2}, \end{eqnarray}$$
where p i is the proportion of the population carrying the ith allele at the locus; (5) locus and variety heterogeneity estimated as the percentage of accessions or loci carrying more than one allele at the corresponding locus or variety, respectively; (6) allele-frequency variation calculated using the formula:
 $$\begin{eqnarray} A _{ XY }(\%) = \frac {\sum \left | P _{ Xi } - P _{ Yi }\right |}{ N _{ XY }}\times 100, \end{eqnarray}$$
where P Xi and P Yi are the proportions of the ith allele at a given locus in groups X and Y, respectively, and N XY is the total number of alleles detected at the corresponding locus (Khlestkina et al., Reference Khlestkina, Röder, Efremova, Börner and Shumny2004). The parameter A XY was calculated only for alleles that were shared by the two geographic groups. To estimate the allelic imbalance at a given locus, its PIC value was compared with the corresponding theoretical PICmax value equivalent to the potentially highest diversity level at the same locus.
Data analyses
Because of the high non-uniformity of all accessions at a number of loci (i.e. presence of more than one allele per locus in a given accession), the data were initially normalized so that the per-variety sum of counts in each locus was 5 to reflect the fact that the expected number of individuals per accession was 5. In such cases, the detected alleles were considered as equally contributing to the genetic make-up of the accession. For example, if only two alleles were present in a genotype at a given locus, it was estimated that each of them has an expected count of 5/2, and if five alleles were present, each of them has an estimated count of 5/5 = 1.
Allelic richness, PICs, heterogeneity, allele frequencies and allele-frequency variations were computed using the software environment for statistical computing and graphics R (R Core Team, 2013). To detect the significance of the difference between the relative PIC values (observed PIC/PICmax) averaged over the loci with low and high variations, Welch's t test was performed in R. To test the significance of the correlations between gene diversity and allelic richness, correlation analysis was performed using the software package Statistica Statsoft version 7 (StatSoft, 2005).
The genetic distance coefficients between each pair of the accessions were calculated as 1–GS (genetic similarity) from the data of 21 microsatellite loci displaying seven or more alleles using the formula:
 $$\begin{eqnarray} GS = 2 Q _{ ij }/( Q _{ i } + Q _{ j }), \end{eqnarray}$$
where Q ij is the number of alleles common to the varieties i and j, and Q i +Q j is the sum of the number of alleles in each of the two varieties. The hierarchical clustering of the accessions was performed using the R hclust function to generate a Ward dendrogram (Ward, Reference Ward1963).
Agronomic evaluation
Seven agronomic traits were evaluated in a 2-year (2009, 2012) field trial in the experimental field of the Institute of Plant Physiology and Genetics, Bulgarian Academy of Sciences, Sofia (42°41’N, 23°19’E). In both seasons, sowing was carried out in October at the optimum time for this climatic zone. A preliminary field trial aiming at seed multiplication did not reveal any within-accession variations in spike morphological traits (spike colour, waxiness, presence/absence of awns, awns colour, etc.), which allowed each accession to be sown in small plots. Each accession was sown as space-planted two-row plots (1 m in length) in two replications (5 cm between the plants within the row and 20 cm between the rows). To cover the genotypic heterogeneity, seeds from a bulk of spikes for each accession were used for sowing. The following characteristics were measured on five representative plants per replication at the harvest time: final plant height (from the soil surface to the bottom of the spike); spike length; spikelet number; grain number and grain mass per spike; 1000-grain mass. Heading time was determined as days from 1 May when approximately half of the ears in a plot have half emerged from the flag leaf. Trait values averaged over the years and accessions are presented for each group of accessions. To assess the effect of the year (accounting for climatic conditions) and the geographic origin of the accessions, two-way analysis of variance (ANOVA) was performed using Statistica Statsoft version 7.
Results
Diversity at microsatellite loci
The applied set of 24 mapped microsatellite markers detected a total of 263 different alleles at 25 microsatellite loci on 14 chromosomes within the 52 accessions (Tables 1 and 2). Allelic richness ranged from 4 (Xgwm272-5D) to 16 (Xgwm294-2A) alleles per locus with an average number of 10.5 alleles. Allelic polymorphism was manifested by the occurrence of unique alleles appearing only once in the whole pool of entries, and by varying frequency of the prevailing alleles. The number of unique alleles varied between loci spanning from 0 (XTaglut, Xgwm205-5D and Xgwm82-6A) to 5 (Xgwm261-2D and Xgwm499-5B). In total, 63 unique alleles were detected at 22 loci, representing 24% of all alleles. Gene diversity expressed as PIC values ranged from 0.37 (Xgwm480-3A) to 0.90 (Xgwm291-5A), with an average of 0.74. The frequency of the prevailing alleles varied considerably between the loci with different polymorphism degrees. For instance, the 161 bp allele at locus Xgwm291-5A displaying a total of 15 alleles occurred at a frequency of 0.15, whereas the 170 bp allele at locus Xgwm480-3A having six alleles appeared with a frequency of 0.78 (Table 1).
Table 2 Comparison of molecular genetic diversity and agronomic characterization (mean±standard error; CV in brackets, in %) between the old bread wheat accessions from Bulgaria (BS-West, 28) and from Ukraine, Russia and Georgia (BS-Northeast, 24)

***Significantly different at P< 0.001.
A highly significant correlation was found between the observed gene diversity (PIC values) and allelic richness (r= 0.66, P< 0.001; Fig. 1). The comparison between the PIC value for a given locus and the corresponding theoretical PICmax value equivalent to the potentially highest diversity level at the same locus presented an estimation of the allelic imbalance at this locus. For the ten loci displaying ten or less alleles (i.e. less than the average of 10.5 alleles/locus), the observed PIC values were much lower and, therefore, suggestive of larger allelic imbalance compared with the remaining 15 loci having more than ten alleles. The relative PIC values (observed PIC/PICmax) averaged over the loci were lower, showing a higher variation for the loci with ten or less alleles (0.7 ± 23.2%) than those with more than ten alleles (0.9 ± 7.9%) (t= − 2.609, P≈ 0.024, df= 11.02, as determined by Welch's t test that does not assume equal variances).

Fig. 1 Scatter plot of PIC values at 25 microsatellite loci against the number of alleles analysed within 52 old bread wheat accessions from the BS region. The corresponding theoretical PICmax values are also presented.
A high level of heterogeneity was found at all loci varying from 11.8% for Xgwm95-2A, 1) with six accessions being heterogeneous at this locus, to 100% for Xgwm160-4A, Xgwm272-5D, Xgwm82-6A and Xgwm570-6A, with all 52 accessions being heterogeneous at these four loci (Table 1).
Diversity in relation to the geographic origin
The size of the two geographic groups differed by only four entries, and since the number of the loci studied was equal for both groups, we directly compared the molecular diversity of the two sets. Genetic diversity was higher for the BS-Northeast population than for the BS-West group. This was evidenced by greater allelic richness (i.e. a higher total and average number of alleles per locus) and greater private allelic richness (i.e. a higher number of group-specific alleles), including a higher number of unique alleles at almost all loci (Table 2). The unique alleles were carried by 18 accessions from the BS-Northeast group and by 17 accessions from the BS-West group, or by 29 accessions when considering the whole sample. More than one-third of the alleles that were unique for the whole population, or 22 alleles, were carried by three Georgian landraces, Ipkli (13), Gomborka (8) and Khulugo (1). The average PIC was also higher for the BS-Northeast pool (Table 2). The correlations between gene diversity (PIC) and the total number of alleles were found to be highly significant (BS-West group: r= 0.83; BS-Northeast group: r= 0.64; P< 0.001). Neither of the groups had completely homogeneous accessions. Varietal heterogeneity ranged from 16 to 52% (or 4 to 13 heterogeneous loci) for the BS-West group, and from 20 to 100 % (or 5 to 25 microsatellite loci) for the BS-Northeast group. The least number of heterogeneous loci (4) was observed in the Bulgarian variety Okerman 804. The Georgian landrace Ipkli was found to be the most heterogeneous with all 25 microsatellite loci having more than one allele.
At 15 of the 25 microsatellite loci, both the BS-West and BS-Northeast groups had the same prevailing allele (Table 1), which was therefore dominant for the whole pool, whereas at the remaining ten loci, the most frequent allele was different for the two groups. The variation in the frequency of shared alleles between the two geographic groups was lowest for Xgwm294-2A (3.1%) and highest for Xgwm333-7B (16.7%), with an average of 8.7% (Table 1).
Figure 2 shows the allele polymorphism at four microsatellite loci associated with important mapped genes or quantitative trait loci (QTL). Large differences between the two geographic groups were found at loci Xgwm294 and Xgwm312 on chromosome 2AL (Fig. 2(a) and (b), respectively) linked to QTL for yield-related traits (Yao et al., Reference Yao, Wang, Liu, Zhao and Zheng2009). At both loci, the two groups differed with respect to the total and private allele number, and had different prevailing alleles. Locus Xgwm294 (six shared and ten private alleles, of which three being unique) was the only one at which the observed prevailing alleles were regionally specific, i.e. allele fragments of size 94 and 92 bp were the most frequent for the BS-West and BS-Northeast groups, respectively, and were not present in the other group. At locus Xgwm261 linked to the semi-dwarfing gene Rht8 on chromosome 2DS (Korzun et al., Reference Korzun, Röder, Ganal, Worland and Law1998), and to QTL for yield components (Heidari et al., Reference Heidari, Sayed-Tabatabaei, Saeidi, Kearsey and Suenaga2011; Zhao et al., Reference Zhao, Cui, Fan, Li, Ding and Wang2013), ten and five alleles were detected among the BS-West and BS-Northeast accessions, respectively (three common and nine private alleles, of which five being unique) (Fig. 2(c)). Allele Xgwm261174 was dominant in both pools. The marker locus Xgwm408 in close linkage to the vernalization response gene Vrn-B1 on 5BL (Leonova et al., Reference Leonova, Pestsova, Salina, Efremova, Röder, Börner and Fischbeck2003) was characterized by large differences between the two geographic groups (three shared and nine private alleles, of which four being unique) and common dominant allele, Xgwm408178 (Fig. 2(d)). The two sets of accessions differed notably also by the number and frequency of allelic variants at locus Xgwm400 on 7BS in the vicinity of the Ppd-B2 gene for photoperiodic response (at 8.8 cM), and a QTL for grain protein content (Khlestkina et al., Reference Khlestkina, Giura, Röder and Börner2009) displaying four common and seven private alleles, of which two being unique (data not shown).

Fig. 2 Allele polymorphism at four microsatellite loci observed within 52 old bread wheat accessions from the BS region, including 28 historic varieties from Bulgaria (BS-West; grey bars) and 24 landraces and historic varieties from Ukraine, Russia and Georgia (BS-Northeast; black bars). (a) Xgwm294-2A, (b) Xgwm312-2A, (c) Xgwm261-2D and (d) Xgwm408-5B.
Cluster analysis
A dendrogram (Fig. 3) was constructed on the basis of the genetic distance at 21 microsatellite loci displaying seven or more alleles by hierarchical clustering of 1–GS using Ward's method (Ward, Reference Ward1963). The genetic distance 1–GS estimates of all possible pairs of accessions ranged from 0.0196 (TRI 191, Dunavka vs. TRI 373, Duravko) to 0.9273 (k8201, a Crimean landrace vs. k38392, the Georgian landrace Lagodehis gruzeltavtava). The 1–GS coefficient of the pair TRI 4974 versus TRI 5095 was 0, implying that the two varieties cannot be differentiated. Two clusters were distinguished. Cluster 1 comprised mostly (17 out of 28) accessions from Bulgaria (BS-West group). Within this gene pool, accessions from various agroecoregions grouped together. For instance, subcluster 1a consisted mostly of accessions from Northern Bulgaria, while subcluster 1b included only accessions from the Southern part of the country. The remaining Bulgarian accessions were distributed among the three subgroups of the more diverse cluster 2. Of the 15 Crimean landraces, eight were grouped in subcluster 2a, closer to the major group of Bulgarian wheats. The five Georgian accessions were very diverse and did not form a separate cluster.

Fig. 3 Hierarchical clustering dendrogram, showing genetic relationships of 52 bread wheat landraces and historic varieties originated from the Western (denoted by ‘TRI’) and Northeastern (denoted by ‘k’) regions of the BS basin. The genetic distance coefficients were calculated as 1–GS from the data of 21 microsatellite loci displaying seven or more alleles. The asterisk indicates the accessions that are identical at all loci.
Agronomic comparison
A considerable variation in agronomic characteristics estimated by the coefficient of variation (CV, %) was recorded in both geographic groups (Table 2). A relatively high variability (CV>10%) was established for all traits (except for plant height), with the variation being largest for grain mass per spike (CV>20%). According to the two-way ANOVA, year and geographic origin, but not their interaction, significantly affected only two yield components (spike length and number of spikelets per spike). Year had more marked effect on both traits (P< 0.001, df= 1) than did geographic origin (P< 0.001, df= 1) as indicated by the F-ratios of 109.1 (spike length) and 117.3 (spikelet number) versus 43.1 (spike length) and 19.9 (spikelet number), respectively. Accessions from the BS-Northeast group had longer spikes and more spikelets per spike (Table 2).
Discussion
Microsatellite diversity
The amount of population genetic variation is a fundamental parameter for diversity preservation and for breeders as a basis for crop improvement in response to environmental challenges, and economic and health demands. Important characteristics of genetic diversity are allelic richness, allelic distinctiveness (number of private, rare and unique alleles) and locally prevailing alleles. When compared with the results reported for old germplasm of bread wheat, our study evidenced comparable or higher microsatellite diversity across the wheat gene pool from the BS basin. For instance, the average number of alleles per locus (10.5) was higher in comparison with the same characteristics obtained for 59 Portuguese landraces ‘Barbela’ (4.8; Ribeiro-Carvalho et al., Reference Ribeiro-Carvalho, Guedes-Pinto, Igrejas, Stephenson, Schwarzacher and Heslop-Harrison2004), 161 Omani landraces (8.7; Al Khanjari et al., Reference Al Khanjari, Hammer, Buerkert and Röder2007), but much lower than the one calculated for the set of 347 diverse old accessions from 44 countries (18.3; Mitrofanova et al., Reference Mitrofanova, Strelchenko, Konarev and Balfourier2009). The proportion of unique alleles (24%) displaying the qualitative aspect of allele diversity was higher compared with that detected in Omani wheats (2.6% Al Khanjari et al., Reference Al Khanjari, Hammer, Buerkert and Röder2007) and the old diverse germplasm (18%; Mitrofanova et al., Reference Mitrofanova, Strelchenko, Konarev and Balfourier2009). Gene diversity expressed as the average PIC value (0.74) was either comparable with (0.8; Mitrofanova et al., Reference Mitrofanova, Strelchenko, Konarev and Balfourier2009) or higher than the PIC values reported for old Omani (0.5), Portuguese (0.52) or Siberian (0.6; Khlestkina et al., Reference Khlestkina, Röder, Efremova, Börner and Shumny2004) germplasm. Landraces and old varieties are expected to be genetically non-uniform. The average heterogeneity of 41%, revealed in this study, was very high compared with the available literature data on old germplasm (9.1%; Al Khanjari et al., Reference Al Khanjari, Hammer, Buerkert and Röder2007).
The plant material studied is a product of natural and artificial selection carried out by generations of farmers or is a result of early breeding attempts, and so is characterized by high allelic richness and diversity levels. The loci with a relatively lower number of allelic variants and/or lower PIC and PIC/PICmax values could evidence possible diversity reductions due to intended breeding. Indeed, there have been reports demonstrating how breeding for specific targets narrows down the genetic variation, leading to reduced allele frequency in certain groups of genotypes in bread (Stachel et al., Reference Stachel, Lelley, Grausgruber and Vollmann2000; Huang et al., Reference Huang, Börner, Röder and Ganal2002) and durum (Maccaferri et al., Reference Maccaferri, Sanguineti, Donini and Tuberosa2003) wheat elite varieties, designed for growing under more or less standardized conditions. However, no such trend is observed in our study on the old genetic resources. The loci with a higher number of alleles (>10) and higher PIC/PICmax values (on average 0.9) did include loci with known associations with potential breeding targets, such as traits related to productivity (Xgwm294-2A, Xgwm312-2A and Xgwm261-2D) and flowering time (Xgwm261-2D, Xgwm408-5B, Xgwm400-7B and Xgwm46-7B) (Leonova et al., Reference Leonova, Pestsova, Salina, Efremova, Röder, Börner and Fischbeck2003; Khlestkina et al., Reference Khlestkina, Giura, Röder and Börner2009; Yao et al., Reference Yao, Wang, Liu, Zhao and Zheng2009; Heidari et al., Reference Heidari, Sayed-Tabatabaei, Saeidi, Kearsey and Suenaga2011; Zhao et al., Reference Zhao, Cui, Fan, Li, Ding and Wang2013). One possible explanation is that both the farmers' selection and the early breeding activities have been carried out under specific non-standardized agroecological conditions, and, therefore, the high allelic variation at these loci might reflect the broad environmental diversity, resulting in the fixation of various traits and alleles of competitive power. The differences in allelic richness at the various microsatellite loci could also evidence the differences in their mutation rate. In particular, landraces that have been developed at low levels of fertilizers and disease control have been subject to natural selection pressure for adaptability and survival rather than to purposeful breeding for grain productivity (Zeven, Reference Zeven1998), and, therefore, could accumulate mutations of various rates at different loci.
Geographical variations
Molecular diversity in the two gene pools differed with respect to allelic richness, distinctiveness and extent of heterogeneity. The accessions from Ukraine, Georgia and Russia (BS-Northeast group) were characterized by a higher total number of alleles, a higher number of private (i.e. group-specific) alleles and a higher number of unique alleles, as well as greater heterogeneity. Large differences in allele frequencies found at certain loci between the two geographic areas could be related to adaptation driving forces on linked genes.
In the case of locus Xgwm261 on 2DS, this could be explained by selection pressure for genomic regions associated with flowering time and/or yield-related traits. The Xgwm261165–174 alleles often in combination with the Ppd-D1b gene for day-length response in later heading genotypes could probably guarantee wider adaptability (Šíp et al., Reference Šíp, Chrpová, Žofajová, Pánková, Užík and Snape2010).
Loci Xgwm261 on 2DS, and Xgwm312 and Xgwm294 on 2AL have been linked to highly significant QTL for yield and yield components (Yao et al., Reference Yao, Wang, Liu, Zhao and Zheng2009; Heidari et al., Reference Heidari, Sayed-Tabatabaei, Saeidi, Kearsey and Suenaga2011; Zhao et al., Reference Zhao, Cui, Fan, Li, Ding and Wang2013). The variation in the number and frequencies of alleles at these loci could at least partially account for the significant differences in the spike length and spikelet number observed between the two sets of accessions. The significant prevalence of allele Xgwm408178 on 5BL in both groups (average frequency of 0.51, as shown in this study, and 0.67 among old Ukrainian germplasm, as reported earlier by Chebotar (Reference Chebotar2004)) is suggestive of its adaptive role probably associated with the tightly linked Vrn-B1 gene determining growth habit and flowering time (Leonova et al., Reference Leonova, Pestsova, Salina, Efremova, Röder, Börner and Fischbeck2003). All but two accessions were of winter type. According to van de Wouw et al. (Reference van de Wouw, Kik, van Hintum, van Treuren and Visser2009), alleles that are regionally specific and dominant are possibly the ones that contribute to the adaptation to the local agroecological conditions and, therefore, are more likely to be useful in achieving the goals of breeders. The old germplasm consisting of landraces and historic varieties is a valuable source of such alleles, so the monitoring of genetic erosion should be focused on these locally common alleles as recommended by van de Wouw et al. (Reference van de Wouw, Kik, van Hintum, van Treuren and Visser2009).
Genetic relationships
Most of the accessions from Bulgaria (BS-West group) were grouped together into a separate cluster. The grouping of some varieties could be due to their genealogy relationships. For instance, Okerman 804 (TRI 9532) and Sadovka (TRI 194) both have varieties Noé and Nr.16 (TRI 187) in their pedigrees. The three accessions group together in subcluster 1a. Accessions originated from neighbouring regions and being subjected to comparable selection forces also tended to group together, suggesting that concurrent allele combinations have been selectively fixed to succeed in achieving adequate response to the local environment. For instance, TRI 190, TRI 191, TRI 372, TRI 373 and TRI 4975 (subcluster 1b) were selected from the region of Plovdiv, Southern Bulgaria, while TRI 368, TRI 356 and TRI 365 (subcluster 2c) came from the region of Veliko Turnovo, Northern Bulgaria.
The second major cluster comprised the remaining Bulgarian accessions and the ones of the BS-Northeast group with no clear pattern of grouping. One reason might be that gene flows had probably taken place through the constant migration of people between the Crimean Peninsula and Bulgaria since the 15th century. It is very likely that many crops, including wheat, had been introduced as a result of the migration of people. Also, the market exchange through the major BS ports (see Fig. S1, available online) had possibly contributed to seed gene flows. Grain exports through the Belgorod-Dniester port near Odessa on the Northwestern BS shore had occurred as earlier as 13–14th centuries as evidenced by the report of the florentine trade company representative F.B. Pegolotti (Konovalova, Reference Konovalova and Dragnev1994).
The observed grouping of Crimean wheats with varieties from Southern or Northern Bulgaria, namely subclusters 2a, 2b and 2c, complies with the reports on the close relationships between accessions from Ukraine and Bulgaria, based on their position in the neighbour-joining tree (Balfourier et al., Reference Balfourier, Roussel, Strelchenko, Exbrayat-Vinson, Sourdille, Boutet, Koenig, Ravel, Mitrofanova, Beckert and Charmet2007; Chebotar, unpublished). The finding that Georgian wheats do not cluster also reflects their large diversity. According to Jorjadze et al. (Reference Jorjadze, Berishvili and Shatberashvili2014), Georgian landraces have been evolved under a broad range of environments and have probably developed various well-adapted ecotypes. Among the five investigated accessions, Ipkli, which is the oldest reported name for bread wheat in Georgia, and presumably a very ancient wheat variety, was found to be the most polymorphic and most ‘unique’ carrying 13 alleles that were not identified in the rest of the material. Being a part of a larger Caucasus group of accessions, this material has been placed in a different tree branch together with samples from Turkey and Central Asia (Balfourier et al., Reference Balfourier, Roussel, Strelchenko, Exbrayat-Vinson, Sourdille, Boutet, Koenig, Ravel, Mitrofanova, Beckert and Charmet2007).
Genebank aspects
The results of this study raise questions in relation to diversity preservation via seed banking. Some of these questions have already been brought up by other authors (Börner et al., Reference Börner, Chebotar and Korzun2000; Newton et al., Reference Newton, Akar, Baresel, Bebeli, Bettencourt, Bladenopoulos, Czembor, Fasoula, Katsiotis, Koutis, Koutsika-Sotiriou, Kovacs, Larsson, Pinheiro de Carvalho, Rubiales, Russell, dos Santos and Vaz Patto2010; Pinheiro de Carvalho et al., Reference Pinheiro de Carvalho, Bebeli, Bettencourt, Costa, Dias, Dos Santos and Slaski2013). One of the important challenges for ex situ genebanks is to minimize the contamination due to erroneous handling during the reproduction (Börner, Reference Börner2006). This is believed to aid in maintaining the genetic integrity and purity in the genebank accessions of self-pollinating species. Therefore, the efforts to preserve the old germplasm variation involve not only seed reproduction but also the periodical evaluation of molecular, morphological and agronomic diversity. Comparisons of agromorphological and DNA-based data can further identify the duplications within collections and thus help in their rationalizing (Dobrovolskaya et al., Reference Dobrovolskaya, Saleh and Malysheva-Otto2005).
The IPK genebank keeps two samples each of five Bulgarian varieties: Nr.7 (TRI 185 and TRI 4974); Nr.84 (TRI 188 and TRI 4976); Professor Ackermann (TRI 192 and TRI 370); Dunavka/Duravko (TRI 191 and TRI 373); Sadovka/Sadorka (TRI 194 and TRI 372). The pairs might represent heterogeneous populations or duplicates, or could be a result of seed mishandling. Although the first pair might have come from a heterogeneous population, and, therefore, is expected to be genetically diverse to some extent, the two accessions are very distant on the dendrogram. In addition, the latter (TRI 4974) appears genetically identical to TRI 5095, another Bulgarian historic variety, which comes from another breeding station designed for growing in a different environment. This might signify incorrect handling during seed multiplication in the case of TRI 4974. The pair Dunavka/Duravko as well as the two accessions under the name Nr.84 are genetically very similar and group together within subclusters 1b and 2b, respectively, suggesting that they are biotypes of a nearly uniform variety. The two pairs under similar names (Professor Ackermann and Sadovka/Sadorka) are genomically detached in addition to their morphological distinctiveness (see Table S1, available online). Thus, they either could be different accessions under wrong names or might have come from highly non-uniform populations that have possibly been further divided into different accessions, thus representing examples of genetic shift. A case of genetic drift as a result of numerous regenerations has already been reported for an originally highly heterogeneous Albanian accession that became more homogeneous after 15 regenerations as revealed by microsatellite analysis (Börner et al., Reference Börner, Chebotar and Korzun2000).
The analysis of genealogy of modern varieties shows that, in general, landraces and historic varieties have had limited use for breeding purposes (Martynov et al., Reference Martynov, Dobrotvorskaya, Hon and Faberova2006). However, the inherent wide genetic variability of this germplasm may have a buffer effect against environmental stresses over time. This is important in the context of current climate fluctuations and constant changes in pathogen populations. In addition, the recent broadening of organic farming has driven the interest in more diverse germplasm, which is considered to be more suitable for growing under non-standardized environmental conditions in organic farms (Serpolay et al., Reference Serpolay, Dawson, Chable, Lammerts Van Bueren, Osman, Pino, Silveri and Goldringer2011). Landraces and old varieties are a product of selection and adaptation to specific environments that had been carried out in conditions far too different from the current standardized agricultural practices. In this aspect, they represent a useful source of alleles to improve crop plasticity and their ability to grow in low input or organic agrosystems.
This study demonstrated the presence of high diversity in the old germplasm from the Western and Northeastern regions of the BS basin. Enhancing the wheat crop with ‘novel’ alleles from old parents requires extensive studies on the agronomic performance, grain quality and stress responses of this exotic germplasm, as well as genetic research to associate traits of interest with genomic regions, followed by appropriate incorporation strategies that could be assisted by molecular marker technologies.
Supplementary material
To view supplementary material for this article, please visit http://dx.doi.org/10.1017/S1479262114000781
Acknowledgements
This study was a part of a bilateral cooperation between the Bulgarian and Russian Academies of Sciences. The authors thank Dr A. Börner, IPK, Gatersleben for providing the seeds. They also gratefully acknowledge Mrs K. Prokopova and Mrs M. Popova for technical assistance.