NOMENCLATURE
- a ∞
-
freestream speed of sound
- AR
-
aspect ratio, R/c ref
- c
-
blade chord
- c ref
-
reference blade chord
- C D0
-
overall profile drag coefficient
- CP
-
surface pressure coefficient,
 $C_P= \frac{P-P_\infty }{1/2 \rho _\infty V_{\infty }^2}$
- C* P
-
critical pressure coefficient
- Cq
-
blade sectional torque coefficient,
$C_q = \frac{{\rm d}C_Q}{{\rm d}(r/R)}$
- CQ
-
rotor torque coefficient,
$C_Q = \frac{Q}{\rho _\infty (\Omega R)^2 \pi R^3}$
- Ct
-
blade sectional thrust coefficient,
$C_t = \frac{{\rm d}C_T}{{\rm d}(r/R)}$
- CT
-
rotor thrust coefficient,
$C_T = \frac{T}{\rho _\infty (\Omega R)^2 \pi R^2}$
- D
-
drag measured by main balance
- f
-
integration surface defined by f = 0
- FoM
-
figure of merit, FoM
$ = \frac{C_T^{3/2}}{\sqrt{2}C_Q}$
- k
-
turbulent kinetic energy
- ki
-
induced power factor
- L
-
lift measured by main balance
- L ref
-
reference length
- M tip
-
blade-tip Mach number,
$M_{\rm {tip}} = \frac{V_{\rm {tip}}}{a_\infty }$
- M ∞
-
freestream Mach number,
$M_\infty = \frac{V_\infty }{a_\infty }$
- Nb
-
number of blades
- P
-
pressure
- P ∞
-
freestream pressure
- Pij
-
compressive stress tensor
- Q
-
rotor torque or Q-criterion
- r
-
radial coordinate along the blade span
- R
-
rotor radius
- Re
-
Reynolds number,
$Re = \frac{V_{\rm{tip}}c_{\rm{ref}}}{\nu _\infty }$
- R
-
flux residual vector
-
$\mathcal {S}$
-
aerodynamic surface
- T
-
rotor thrust
- Tij
-
Lighthill stress tensor
- V tip
-
blade-tip speed, V tip = ΩR
- V ∞
-
freestream velocity
- W
-
flow solution vector
- CD
-
drag coefficient,
$\frac{D}{1/2 \rho _{\infty } V_{\infty }^2 \mathcal {S}}$
- CL
-
lift coefficient,
$\frac{L}{1/2 \rho _{\infty } V_{\infty }^2 \mathcal {S}}$
- V
-
volume of the cell i, j, k
- η
-
propeller propulsive efficiency,
$\eta = \frac{C_T V_\infty }{C_Q V_{\rm{tip}}}$
- ν∞
-
freestream kinematic viscosity
- γ
-
specific heat ratio
- ω
-
specific rate of dissipation of turbulence
- Ω
-
rotor rotational speed
- δ ij
-
Kronecker delta function
- Ψ
-
azimuth angle
- ρ∞
-
freestream density
- σ
-
rotor solidity,
$\sigma = \frac{N_b c_{\rm {ref}}}{\pi R}$
- θ75
-
blade pitch angle at r/R = 0.75
- Θ
-
local blade twist angle
- i, j, k
-
cell index
- nac
-
nacelle
- ref
-
reference value
- tilt
-
tiltable wing
- tip
-
blade-tip value
- ∞
-
freestream value
- *
-
sonic condition
- AoA
-
Angle-of-Attack
- AC
-
Aeroplane Configuration
- ADYN
-
Advanced European Tiltrotor Dynamics and Noise
- AHD
-
Airbus Helicopters Deutschland
- ATB
-
Advanced Technology Blade
- BILU
-
Block Incomplete Lower-Upper
- CFD
-
Computational Fluid Dynamics
- CFL
-
Courant–Friedrichs–Lewy
- CPU
-
Central Processing Unit
- DES
-
Detached-Eddy Simulation
- DDES
-
Delayed Detached-Eddy Simulation
- DNW-LLF
-
German-Dutch Wind Tunnels Large Low-Speed Facility
- DLR
-
German Aerospace Centre
- DART
-
Development of an Advanced Rotor for Tilt-rotor
- elsA
-
ensemble logiciel pour la simulation en Aérodynamique
- ERICA
-
Enhanced Rotorcraft Innovation Concept Achievement
- EU
-
Europe Union
- HFWH
-
Helicopter Ffowcs Williams–Hawkings
- HMB
-
Helicopter Multi-Block (CFD solver)
- MUSCL
-
Monotone Upstream-Centred Schemes for Conservation Laws
- NACA
-
National Advisory Committee for Aeronautics
- NICETRIP
-
Novel Innovative Competitive Effective Tilt Rotor Integrated Project
- NLR
-
Netherlands Aerospace Centre
- OARF
-
Outdoor Aeronautical Research Facility
- ONERA
-
Office National d’Etudes et de Recherches Aerospatiales
- PoliMi
-
Politecnico di Milano
- SA
-
Spalart-Allmaras
- SPL
-
Sound Pressure Level
- SST
-
Shear Stress Transport
- TILTAERO
-
TILTrotor interactional AEROdynamics
- UofG
-
University of Glasgow
- URANS
-
Unsteady Reynolds Averaged Navier–Stokes
- VTOL
-
Vertical Take-Off Landing


Greek


Subscripts
Superscripts
Acronyms
1.0 INTRODUCTION
Tiltrotor is a new type of flying vehicle that combines VTOL (vertical take-off/landing) capability with high speed cruise. For the first time, this technology was successfully demonstrated with the Bell XV-3 in 1955(Reference Maisel, Giulianetti and Dugan1). In the late 1960s and early 1970s, a major program was jointly launched at the NASA Ames Research Center and Bell Helicopters, to develop a new tiltrotor named XV-15. The aircraft was used to support the development of new generation of tiltrotors like the Bell-Boeing V-22 Osprey(Reference Potsdam, Schaller, Rajagopalan and Silva2,Reference Narducci, Jiang, Liu and Clark3) and the AW609(4,Reference Harris, Scheidler, Hopkins and Fortenbaugh5) .
Tiltrotor blades must be designed to efficiently operate in helicopter and aeroplane modes, resulting in a blade design with high twist and solidity, along with smaller rotor radius. In addition, the aerodynamic interaction between the rotor and the wings seems to be one of the most important aerodynamic phenomena to affect the design of tiltrotor blades and the overall performance of the aircraft. In this regard, experimental studies carried out by Felker and Light(Reference Felker and Light6) and numerical simulations performed by Potsdam and Strawn(Reference Potsdam and Strawn7) investigated the rotor/wing aerodynamic interactions in helicopter mode configuration. To mitigate the strong aerodynamic interaction between rotor and wing of tiltrotors and to reduce the downward force acting on the wings in hover(Reference Bridgeman, Cummings, Narramore and Kisor8), a new design was proposed, where a small part of the wing can be partially rotated. This configuration is known as tiltwing.
To increase the competitiveness and experience with tiltrotors in Europe, the European Commission has launched several research and development projects such as the DART(9) (Development of an Advanced Rotor for Tilt-rotor) with the aim to improve rotor hub design; TILTAERO(Reference Visingardi, Khier and Decours10,Reference Beaumier, Decours and Lefebvre11) (TILTrotor interactional AEROdynamics) to study the interactional aerodynamics; and ADYN(Reference Decours and Lefebvre12) (Advanced European Tiltrotor Dynamics and Noise) to investigate rotor dynamics, performance, and level of noise on tiltrotors. Unlike conventional tiltrotor configurations, tiltwing aircraft have not been widely studied. To fill this gap, the research project NICETRIP(13) (Novel Innovative Competitive Effective Tilt Rotor Integrated Project) was funded by the European Union (EU) to develop a database covering aerodynamic interactional phenomena and other technological aspects of tiltwing vehicles.
Very little wind tunnel data is available for model and full-scale tiltrotors. The first tests of the full-scale XV-15 rotor were performed on a propeller test rig in the NASA 40-by-80-Foot Wind Tunnel(14) in July 1970. Weiberg et al(Reference Weiberg and Maisel15) used the same facility to measured integrated rotor loads in helicopter, aeroplane, and transition-corridor modes. However, force and moment measurements did not exclude the contribution from the airframe. In the mid-eighties, the most extensive data set published on the XV-15 tiltrotor in helicopter mode was realised by Felker et al(Reference Felker, Betzina and Signor16) at the NASA-Ames Outdoor Aeronautical Research Facility (OARF). Likewise, the Boeing Vertol Company carried out rotor hover performance for the full-scale Advanced Technology Blade (ATB) and XV-15 rotor blade(Reference Bartie, Alexander, McVeigh, Mon and Bishop17). Hover and forward flight tests began in the late 90s with the work of Light(Reference Light18) in the 80-ft by 120-ft wind tunnel at NASA Ames, but only few conditions were tested. To fill this gap, Betzina(Reference Betzina19) in 2002 undertook an extensive campaign of experiments on the full-scale XV-15 rotor, where the experiments were corrected for hub and tares effects. For all set of experiments cited, neither surface pressure nor skin friction coefficients were measured. In this regard, Wadcook et al(Reference Wadcock, Yamauchi and Driver20) measured skin friction coefficients on a hovering full-scale XV-15 tiltrotor in the 80-ft by 120-ft wind tunnel at NASA Ames. At low thrust, an extension region of laminar flow was encountered over a significant fraction of the blade chord, while at high disc loading conditions, the laminar to turbulent transition region on the upper blade surface moved towards the blade leading edge, with fully turbulent boundary layer encountered at outboard section. This set of experiments could be employed to validate and improve transitional models for tiltrotors.
In Europe, a 1:5 motorised model-scale tiltrotor was designed and manufactured under the name of ERICA (Enhanced Rotorcraft Innovative Concept Achievement) and a campaign of experiments was undertaken in the 9.5 × 9.5 m DNW-LLF (German-Dutch Wind Tunnels Large Low-speed Facility) and the 8m S1MA ONERA (Office National d’Etudes et de Recherches Aerospatiales) wind tunnels. The tunnel tests of the ERICA covered the full flight envelope from helicopter mode (with the nacelles tilted to 90 degrees relative to the aircraft axis), to aeroplane mode configuration, and for a wide range of angles-of-attack and freestream Mach numbers. Helicopter and transition corridor configurations were studied at a low speed range (freestream Mach numbers from 0 to 0.168) in the DNW-LLF wind tunnel(Reference Philipsen and Heinrich21) due to its larger test section, minimising wake reingestion in the test chamber. By contrast, the high speed test campaign (freestream Mach number from 0.168 to 0.55) was conducted in the test section no.2-(45 m2 of section) of the S1MA ONERA wind tunnel(Reference Lebrun22). The main aim of this test was to analyse aerodynamic interactional phenomena between different components of the ERICA tiltrotor at high speed. Both wind tunnels were equipped with different model supports, using a ventral sting set-up in the case of DNW-LLF and a straight sting located at the rear part of the fuselage for the S1MA. During experiments, the following measurements were performed: forces and moments acting on the model by means of a 6-component main balance, unsteady pressure distribution measured by means of 54 Kulite sensors located only on the fuselage and wing, and steady pressure distribution by means of 672 static pressure taps again on the fuselage and wing.
Few complete studies concerning numerical simulations and comparisons with published experimental data of tiltrotors can be found in the literature. Kaul et al(Reference Kaul and Ahmad23,Reference Kaul24) studied the effect of inflow boundary conditions and turbulent models on the hovering XV-15 main rotor blade, using the OVERFLOW2 CFD solver. Results with the Spalart-Allmaras (SA) model(Reference Spalart and Allmaras25) with the Detached Eddy Simulation (DES) formulation, revealed a lack of agreement with the experiments of Wadcook et al(Reference Wadcock, Yamauchi and Driver20) in the laminar-turbulent transitional region. Likewise, Yoon et al(Reference Yoon, Pulliam and Chaderjian26) investigated the effect of the employed turbulence model on the hovering performance and skin friction coefficients of the XV-15 rotor blade at a collective of 10°. It was found that the k-ω SST-DDES turbulence model predicted the Figure of Merit (FoM) closer to experiment than the SA-DDES one-equation model. However, minimal differences between these fully-turbulent models were observed in the predictions of skin friction coefficient, which did not reproduce well the flowfield encountered in the experiment(Reference Wadcock, Yamauchi and Driver20). Sheng et al(Reference Sheng and Zhao27) used the U2NCLE and Helios CFD solvers, to assess the effect of transition models in predicting the hover figure of merit on the XV-15 blade. Despite the use of a massive grid size of 294 million cells for the whole rotor, results at 10° collective showed an over-predicted FoM with a discrepancy of 3.17%. It was shown that the transitional flow modelling did not have a significant impact on the predicted FoM mainly due to the small laminar-turbulent transition region encountered on the XV-15 blades. A detailed performance analysis of the hover and propeller modes of the XV-15 blades were performed by Gates(Reference Gates28) using the HMB CFD solver. Good agreement with published experimental data was reported, even though a medium grid size (9.6 million cells per blade) was employed for computations. Furthermore, the effect of the hub spinner on the propeller performance at moderate advance ratios was highlighted.
Further studies have been also published for the V-22 tiltrotor using numerical simulations. The drag polar of the V-22 aircraft has been measured in the 20 × 20ft Boeing wind tunnel(Reference Abras and Narducci29), and the results were compared against CFD predictions of the FUN3D and OVERFLOW CFD codes. Neither CFD nor experiments considered the effect of the rotors. The experiments considered a model of the V-22 of 0.15 scale and provided integrated lift, drag, and moment data. In general, the authors state that good agreement between the CFD and experiments was obtained but further studies were recommended to ensure that mesh independent results can be obtained.
In the framework of the TILTAERO and ADYN projects, Decours et al(Reference Decours and Lefebvre12) carried out aerodynamic and aeroacoustic optimisations of the TILTAERO tiltrotor blade. The optimal blade was referred to as ADYN blade, and the level of noise was decreased by 4 dB in take-off mode and by 6 dB in landing mode(Reference Lefebvre, Beaumier, Canard, Pisoni, Pagano, van der Wall, D’Alascio, Arzoumanian, Riziotis and Hermans30). A comparison between experimental data and CFD predictions of the 1:5 scale-model ERICA tiltrotor was performed by Decours et al(Reference Decours, Beaumier, Khier, Kneisch, Valentini and Vigevano31). An aeroplane and transition corridor modes were simulated using different CFD tools, turbulence models, and grids with the aim to characterise the aerodynamic interactional phenomena on the ERICA tiltrotor. Regarding the aeroplane mode configuration, experiments predicted a local separation on the top of the fuselage near the centre-line and the fixed wing junction. Not all CFD solvers were able to well reproduce the flow separation on the fuselage, though a fair agreement has been obtained between CFD and experiments, overall.
The present paper is divided into two parts. The objective of the first part is to validate the employed CFD method for flows relevant to tiltrotors before moving into Part II, which is devoted to blade optimisation. The first part presents performance analysis of the 1:5 model-scale ERICA tiltrotor, where the aeroplane mode is considered. CP profile and integrated loads are compared between CFD and experimental data on the fuselage, nacelle, and fixed and tiltable wings of the ERICA model. This study shows encouraging results for the aircraft, but rotor loads cannot be assessed because of the lack of experimental data. For this reason, the second part aims to investigate performance analyses of the XV-15 and TILTAERO tiltrotor blades, for which experimental data is available. The XV-15 main rotor is simulated in hover and propeller modes, and an aeroacoustic study is also included in the tip-path-plane of the rotor. Finally, hovering simulations for the TILTAERO blade are also compared with wind tunnel data.
2.0 HMB SOLVER
The Helicopter Multi-Block (HMB)(Reference Lawson, Steijl, Woodgate and Barakos32-Reference Steijl, Barakos and Badcock34) code is used as the CFD solver for the present work. It solves the Unsteady Reynolds Averaged Navier-Stokes (URANS) equations in integral form using the arbitrary Lagrangian-Eulerian (ALE) formulation, first proposed by Hirt et al(Reference Hirt, Amsten and Cook35), for the time-dependent domains, which may include moving boundaries. The Navier-Stokes equations are discretised using a cell-centred finite volume approach on a multi-block grid. The spatial discretisation of these equations leads to a set of ordinary differential equations in time,
 $$\begin{eqnarray}
\frac{d}{dt} ({\bm W} V) = - {\bm R}( {\bm W}),
\end{eqnarray}$$
$$\begin{eqnarray}
\frac{d}{dt} ({\bm W} V) = - {\bm R}( {\bm W}),
\end{eqnarray}$$
where W and R are the flow solution and flux residual vectors, respectively, and V is the volume of the cell. To evaluate the convective fluxes, Osher(Reference Osher and Chakravarthy36) and Roe(Reference Roe37) approximate Riemann solvers are used in HMB, while the viscous terms are discretised using a second order central differencing spatial discretisation. The Monotone Upstream-centred Schemes for Conservation Laws (MUSCL) developed by van Leer(Reference van Leer38) is used to provide third order accuracy in space. The HMB solver uses the alternative form of the Albada limiter(Reference van Albada, van Leer and Roberts39) being activated in regions where a large gradients are encountered, mainly due to shock waves, avoiding the non-physical spurious oscillations. An implicit, dual-time stepping method is employed to performed the temporal integration. The solution is marching in the pseudo-time to achieve fast convergence, using a first-order backward difference. The linearised system of the Navier-Stokes equations is solved using the Generalised Conjugate Gradient method with a Block Incomplete Lower-Upper (BILU) factorisation as a pre-conditioner(Reference Axelsson40). Multi-block structured meshes are used for HMB, which allow easy sharing of the calculation load in parallel computing. Structured multi-block hexa meshes are generated using ICEM-Hexa™.
Overset grid and sliding plane methods are available in HMB(Reference Steijl and Barakos33,Reference Jarkowski, Woodgate, Barakos and Rokicki41) to allow the relative motion between different components. Both methods have been widely employed for isolated rotor blades, such as the UH-60A by Dehaeze et al(Reference Dehaeze and Barakos42), S-76 by Jimenez et al(Reference Jimenez and Barakos43), XV-15 by Gates(Reference Gates28), and complete helicopter configurations(Reference Steijl and Barakos33). For the present work, an overset grid method is employed to explore its capabilities with tiltrotor configurations. A brief description of the method is provided in the following section.
2.1 Overset grid method
The overset grid method, also referred to chimera method, is based on structured composite grids with hexahedral elements, consisting of independently generated, overlapping non-matching sub-domains. A hierarchical approach is employed allowing to interpolate the solution variables based on an user-specified hierarchy of sub-domains. The interpolation between composite grids depends on a localisation procedure, that includes a Localisation Pre-processing and a chimera search which aim is to minimise the number of searches due to potential mesh overlap. Three methods are available to control the interpolation needed for the chimera solution; zero order single-neighbour, inverse distance, and variable-distribution reconstruction-based interpolation. For this study, a zero order single-neighbour was used(Reference Jarkowski, Woodgate, Barakos and Rokicki41).
3.0 ERICA TILTROTOR - AERODYNAMIC STUDY
3.1 ERICA tiltrotor mesh
The chimera method was employed to ease the generation of the different structured multi-block grids. Self-contained component grids for the main fuselage and nacelle-tiltable wing were built, whilst the four blades were embedded in the nacelle mesh component. To enable the relative motion between tiltable and fixed wing components, independently generated overlapping grid sets were used, employing a 4 mm gap. Likewise, a gap between the blade root and spinner was allowed. A Cartesian background grid completed the system, overlapping all component grids and covering the whole computational domain.
Table 1 compares the mesh size used here for CFD computations with previous works(Reference Decours, Beaumier, Khier, Kneisch, Valentini and Vigevano31), which corresponds to a half aircraft configuration. ONERA and Politecnico di Milano (PoliMi) used the same grid system, which led a grid size of 26 million nodes. Airbus Helicopters Deutschland (AHD) and German Aerospace Centre (DLR), however, used a larger mesh sizes where the fuselage grid covered a large portion of the computational domain. UofG presents the largest grid size with 56.2 million nodes, where the nacelle and tiltable wing components have several refinement levels. As mentioned earlier, the nacelle and the tiltable wing grids were built as one component, therefore the mesh size of the tiltable wing was not reported in Table 1 for UofG.
Table 1 Component mesh size (given as million nodes(Reference Decours, Beaumier, Khier, Kneisch, Valentini and Vigevano31)) for the 1:5 scale-model ERICA tiltrotor. AHD=Airbus Helicopters Deutschland; DLR=German Aerospace Centre; ONERA=Office National d’Etudes et de Recherches Aerospatiales; PoliMi=Politecnico di Milano; UofG=University of Glasgow

Figure 1 shows a detailed view of the surface mesh and the multi-block topology of the ERICA’s nacelle. According to the experiments(Reference Philipsen and Heinrich21,Reference Lebrun22) , the engine inlet of the nacelle was treated as solid. In the longitudinal direction of the nacelle, 270 mesh points are used, while 422 points are used around the nacelle. In the wall normal direction (see Fig. 1(b)), 41 points are used with a mesh spacing at the wall corresponding to a y-plus of about 0.15. A C-topology around the leading edge of the connection with the tiltable wing was chosen, while an O-topology was used at the nose and rear part of the nacelle. Because the blades were embedded in this component, a refined mesh was needed (30.3 million nodes) to capture the convection of the tip-blade vortex.

Figure 1. Surface mesh details and topology of the ERICA’s nacelle.
Figure 2 shows a view of the surface and body-fitted mesh around the fuselage. An O multi-block topology was built at the front and rear parts of the fuselage, while a C-H multi-block topology was generated around the wing and horizontal stabiliser (see Fig. 2(b)). In the chordwise direction around the fixed wing, 310 points are used, and 138 around the horizontal stabiliser of the fuselage. The distribution of points normal to the fixed wing and fuselage, follow an exponential law with the first point located at 4 × 10⁻⁶ of the reference length (L ref = 0.5 m), leading to a y-plus of about 0.15. The reference length used here corresponds to the mean aerodynamic chord of the ERICA’s wing.

Figure 2. Surface mesh details and topology of the ERICA’s fuselage.
The multi-block overset arrangement of the ERICA tiltrotor is shown in Fig. 3. Farfield and symmetry boundary conditions were applied at the background level, while chimera boundaries were used at the nacelle, blades, and fuselage components. To ease the mesh generation, the ERICA model support was not modelled. Its exact geometry is also difficult to obtain.

Figure 3. Details of the multi-block overset arrangement of the ERICA tiltrotor.
3.2 Test conditions and numerical parameters
The configuration considered here is labelled AC (Aeroplane Configuration), and refers to a very low speed aeroplane-mode (M ∞ = 0.168) along with a large aircraft angle-of-attack (AoA) of 10.02 degrees. Neither the nacelles nor the tiltable wings were tilted with respect to the fuselage, so AoA = AoA nac = AoA tilt = 10.02 degrees. The Reynolds number, based on the reference length of 0.5 m and on the advance velocity of the aircraft V ∞, was 1.7×10⁶. The rotor rotational speed Ω and the blade collective pitch angle θ75 were set to 2130 rpm and 27.36°, respectively. Table 2 summarises the conditions employed for this configuration.
Table 2 Test conditions for the aeroplane mode configuration(Reference Bruin and Schneider48,Reference Vigevano, Beaumier, Decours, Khier, Kneisch and Vitagliano49)

The flow solution was computed by solving the URANS equations, coupled with the Wilcox’s k-ω turbulence model(Reference Wilcox47). This was based only on experience and the reputation of this model for stability. The flow equations were integrated with the implicit dual-time stepping method of HMB, using a pseudo-time Courant–Friedrichs–Lewy (CFL) equal to 1. The time-accurate calculations were carried out with a time step corresponding to half degree of rotor revolution, while 120 sub-iterations were performed in pseudo-time.
3.3 CFD validation
Table 3 reports the twenty one cross-sections selected for profile CP comparisons between CFD and experiments(Reference Philipsen and Heinrich21,Reference Lebrun22) . Two sections were selected on the top and bottom symmetry plane of the fuselage (labelled with SYM-TOP and SYM-BOT, respectively), four sections on the fixed wing (labelled with FW), three on the tiltable wing (labelled with TW) which define the zone of aerodynamic interaction between the tiltable wing and the blades, four on the nacelle (labelled with NA), and eight on the fuselage (labelled with FU). Figure 4 shows the position of the selected sections on the ERICA tiltrotor.

Figure 4. Cross-sections selected for comparisons between CFD and experiments(Reference Philipsen and Heinrich21,Reference Lebrun22) on the fixed and tiltable wings, and fuselage of the ERICA tiltrotor.
Table 3 Nomenclature of the stations selected for profile CP comparisons. BOT=Bottom; FU=Fuselage; FW=Fixed Wing; NA=Nacelle; TW=Tiltable Wing; SYM=Symmetry

3.3.1 CP profile comparisons
CP profile comparisons between CFD and experiments(Reference Philipsen and Heinrich21,Reference Lebrun22) on the fuselage, fixed and tiltable wings of the ERICA tiltrotor are given in Fig. 5. They correspond to the top fuselage centre-line and inner, middle, and outer tiltable and fixed wing sections. The CFD results were not averaged in phase and with the same resolution as for the NICETRIP data, which could lead to a source of error in the comparison. Moreover, CP values were averaged over the last computed rotor revolution instead of time-averaging. Regarding the CP profile at the centre-line of the fuselage (Fig. 5(a)), a large zone of recirculation is seen by both sets of experiments (Modane and DNW experiments are denoted by squares and triangles, respectively), which is represented through a pressure plateau after the wing leading edge suction peak. The HMB3 predictions overestimate the suction peak (C PHMB3 = 1.64; CPDNW = 1.25; CPONERA = 1.18) and do not capture the region of recirculation. Simulations carried out internally at UofG with the Menter’s k-ω SST turbulence model(Reference Menter50) did not predict the zone of recirculation. Therefore, this discrepancy can be due to the lack of the complete aircraft model in the grid and the employed symmetry condition, wind tunnel effects, and lack of exact trimmed conditions. By contrast, the CFD results at the front and rear part of the fuselage are in close agreement with the experimental data, which confirms a local separation region. Considering the inner fixed wing section (Fig. 5(b)), experiments suggest that this region is separated due to the presence of a pressure plateau. CFD predictions slightly overestimate the suction peak so that the pressure plateau is not well reproduced. This is consistent with the flowfield predicted in Fig. 5(a).

Figure 5. CP profile comparisons between CFD and experiments(Reference Philipsen and Heinrich21,Reference Lebrun22) on the fixed and tiltable wings of the ERICA tiltrotor.
In the middle and outer fixed wing sections (Figs 5(c)–(e)), wind tunnel experiments show a scatter of about 9% on the suction peak. Despite that the same model and flow conditions were simulated in both wind tunnels for this configuration, a significant scatter was found for all stations in this region. As mentioned, the NICETRIP experimental data is relatively new and not well explored by researchers. Nevertheless, CFD results show good agreement with the experiments for all stations, even if the trailing edge pressure plateau is slightly under-estimated. Regarding the zone of aerodynamic interaction located near the tiltable wing sections (Figs 5(f)–(h)), a good agreement between CFD and experimental results is also observed.
Figure 6 shows profile CP comparisons on the nacelle component, corresponding to the top and bottom centre lines, and the central and rear sections of the nacelle (see Fig. 6(c)). Considering the top and bottom centre-line sections (Figs 6(a)–(b)), a noticeable scatter of CP is observed for both sets of experiments. The CFD results were able to capture the averaged trend of the experimental CP for both sections. Finally, in the middle and rear part of the nacelle (Figs 6(d)–(e)), a good agreement is shown between CFD and experiments.

Figure 6. CP profile comparisons between CFD and experiments(Reference Philipsen and Heinrich21,Reference Lebrun22) on the nacelle of the ERICA tiltrotor.
Figure 7 presents CP comparisons on the ERICA fuselage at eight cross-sections. As can been seen, all CFD curves are close to the experimental data. Better agreement is obtained at the front of the fuselage (Figs 7(a)–(d)), where the flowfield is attached. The HMB3 solution appears to capture well all features shown by the experiments. Even for stations located behind the fixed wing (Figs 7(e)–(h)), the agreement is still fair near the spoonsons and the fin of the model. Nevertheless, the overall effect of the blades on the fuselage is well captured, which encourages the use of this approach in predicting loads on the fuselage.

Figure 7. CP profile comparisons between CFD and experiments(Reference Philipsen and Heinrich21,Reference Lebrun22) on the fuselage of the ERICA tiltrotor.
The effect of the model support on the ERICA tiltrotor results was also assessed using the average CP distribution on the bottom part of the fuselage in Fig. 8(a). The model of the DNW-LLF was supported via a ventral sting set-up at the rear part of the fuselage, while a straight sting was set-up in the ONERA model. As can be seen in Fig. 8(b), the effect of the model support on the fuselage is stronger for the DNW-LLF, being less intrusive for the ONERA model. From a numerical point of view, HMB3 predictions compare well with the experimental data of ONERA, where the support is straight. This is consistent with the fact that the model support was not modelled.

Figure 8. CP profile comparison between CFD and experiments(Reference Philipsen and Heinrich21,Reference Lebrun22) on the bottom part of the fuselage of the ERICA tiltrotor.
3.3.2 Load distributions
In this section, the integrated loads generated on the nacelle, tiltable wing, and the rest of the fuselage with the fixed wing are analysed for the AC configuration. Lift and drag coefficients on the tiltable wing as function of the main rotor azimuth Ψ are shown in Fig. 9(a). The drag and lift coefficients are represented by squares (CD ) and triangles (CL ), respectively, while its averaged values are represented with solid lines. As can be seen, the 4/rev. blade passage effect on the tiltable wing is well captured, with a fluctuation values of 5.14% and 23.8% for the lift and drag, respectively. Previous work(Reference Decours, Beaumier, Khier, Kneisch, Valentini and Vigevano31) reported fluctuations of lift and drag between 5%–7% and 20%-30% depending on the partner.

Figure 9. History of the lift and drag coefficients in the tiltable wing, nacelle, and fuselage and fixed wing of the ERICA tiltrotor
Likewise, the history of the loads on the nacelle is given in Fig. 9(b), which reveals the 4/rev. blade passage effect for both aerodynamic coefficients. The lift and drag fluctuations are 6.86% and 2.5%, respectively, which suggests that the nacelle has a milder unsteady behaviour than the tiltable wing. The fuselage and fixed wing lift and drag coefficients are presented in Fig. 9(c), which also reveals a 4/rev. signal behaviour due to the blade passage. The results show a small fluctuation values of drag (5.64%) and lift (2.17%) coefficients.
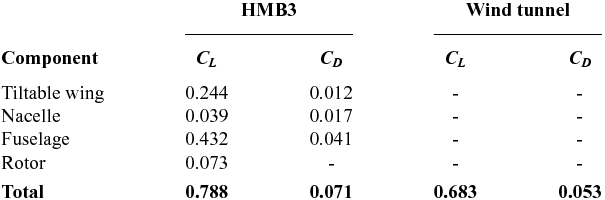
Finally, the lift and drag coefficients of the complete ERICA tiltrotor are compared with the experimental data. Table 4 shows a breakdown of the total averaged lift and drag coefficient for each component. A discrepancy of 15.51% and 33.9% for the lift and drag coefficients is found. Results reported in Decours et al(Reference Decours, Beaumier, Khier, Kneisch, Valentini and Vigevano31) also found a discrepancy on lift about 15%, and no drag values were reported.
Table 4 Averaged lift and drag coefficient comparisons between CFD and experiments(Reference Philipsen and Heinrich21,Reference Lebrun22) for the ERICA tiltrotor

3.3.3 Flowfield details
Visualisation of the flowfield of the ERICA tiltrotor using the Q-criterion(Reference Jeong and Hussain51) coloured by Mach number is presented in Fig. 10(a). Instantaneous solutions are shown instead of averaged values. It is interesting to note that the wake behind the rotor disk is preserved for more than one rotor diameter downstream thanks to the refined mesh employed in this region (Fig. 10(b)). This plot has only informative character, showing the interaction of the rotor wake with the nacelle and tiltable wings. From these iso-surfaces it can be seen that the rotor wake does not directly interact with the fuselage and the fixed part of the wings.

Figure 10. Wake visualisation (top) and details of the refined mesh region (bottom) of the ERICA tiltrotor using Q-criterion shaded by contours of Mach number.
4.0 AERODYNAMIC STUDY OF ISOLATED BLADES
The study of the ERICA tiltrotor shows encouraging results on the fuselage, but rotor loads cannot be assessed because of the lack of experimental data. For this reason, performance analyses of the XV-15 and TILTAERO tiltrotor blades are investigated in this section, for which experimental data is available. The XV-15 main rotor is simulated in helicopter and aeroplane modes, and an aeroacoustic study is also included in the tip-path-plane of the rotor. Finally, hovering simulations for the TILTAERO blade are also compared with wind tunnel data.
4.1 XV-15 tiltrotor blades - Aerodynamic and aeroacoustic study
In this section, we present an aerodynamic study of the XV-15 tiltrotor blades with high-fidelity computational fluid dynamics. The aim is to assess the level of accuracy of the present CFD method in predicting the figure of merit and propeller propulsive efficiency for the helicopter and the aeroplane modes. This is addressed by comparing with experimental data available in the literature(14,Reference Felker, Betzina and Signor16,Reference Light18,Reference Betzina19) . To reduce the computational cost, we solved the hover and propeller flows by casting the equations as a steady-state problem in a noninertial reference frame. Results are presented for a range of design points, which includes medium and high thrust hovering flight conditions, and a medium advance ratio propeller condition. In addition, an aeroacoustic study using the Helicopter Ffowcs Williams-Hawkings (HFWH) code is undertaken to assess the level of noise in the tip-path-plane of the rotor, in hover.
4.1.1 XV-15 rotor geometry
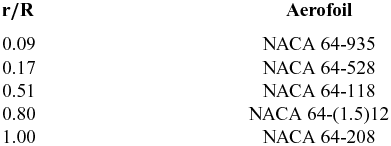
The three-bladed XV-15 rotor geometry was generated based on the full-scale wind tunnel model performed by Betzina in the NASA Ames 80- by 120-foot wind tunnel facility(Reference Betzina19). NACA 6-series five-digit aerofoil sections comprise the rotor blade, and its identity and radial location along the rotor blade is reported in Table 5.
Table 5 Radial location of the XV-15 rotor blade aerofoils(Reference Felker, Betzina and Signor16)

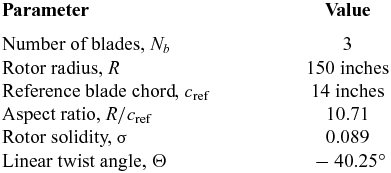
The main geometric characteristics of the XV-15 rotor blades(Reference Betzina19) are summarised in Table 6. It is interesting to note that unlike convectional helicopter blades, tiltrotor blades are mainly characterised by a high linear twist angle and rotor solidity, along with a small rotor radius.
Table 6 Geometric properties of the full-scale XV-15 rotor(Reference Betzina19)
A detailed sketch of the XV-15 blade planform and the blade radial twist, and chord distributions is shown in Fig. 11. The rotor blade chord is held constant, and extends at almost 80% of the rotor blade. The blade root, however, was not modelled due to the lack of information on the cuff geometry in the literature.

Figure 11. Planform of the XV-15 rotor blade (above) and twist and chord distributions(Reference Acree52) (below).
4.1.2 XV-15 rotor mesh
A mesh generated using the chimera technique was used for the aerodynamic study of the XV-15 rotor. It was composed by a cylindrical off-body mesh used as background, and a body-fitted mesh for the blade. The use of an overset grid method allowed for the blade pitch angle to be changed by rotating the body-fitted mesh. Because the XV-15 rotor was numerically evaluated in hover and propeller modes (axial flight), only a third of the computational domain was meshed, assuming periodic conditions for the flowfield in the azimuthal direction (not applicable to stall condition). A view of the computational domain, along with the boundary conditions employed is given in Fig. 12(a). Farfield boundaries were extended to 2R (above rotor) and 4R (below rotor and in the radial direction) from the rotor plane, which assures an independent solution with the boundary conditions employed. Furthermore, an ideal rotor hub was modelled and approximated as a cylinder, extending from inflow to outflow with a radius of 0.05R.

Figure 12. Computational domain and boundary conditions employed (left) and detailed view of the XV-15 rotor mesh (right).
A C-topology was selected for the leading edge of the blade, while an H-topology was employed at the trailing edge. This configuration permits an optimal resolution of the boundary layer due to the orthogonality of the cells around the surface blade (Fig. 12(a)). The height of the first mesh layer above the blade surface was set to 1.0 × 10⁻⁵ c ref, which leads y + less than 1.0 all over the blade. Considering the chordwise and spanwise directions of the blade, 264 and 132 mesh points were used, while the blunt trailing-edge was modelled with 42 mesh points.
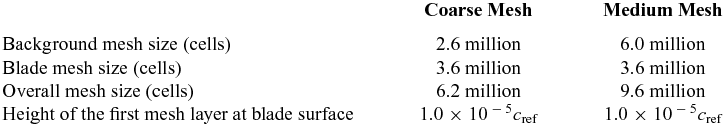
To guarantee a mesh independent solution, two computational domains were built. Table 7 lists the grids used and shows the breakdown of cells per blade. Coarse and medium meshes have 6.2 and 9.6 million cells per blade (equivalent to 18.6 and 28.8 million cells for three blades), with the same grid resolution for the body-fitted mesh (3.6 million cells). The background mesh, however, was refined at the wake and near-body regions, increasing the grid size from 2.6 to 6 million cells.
Table 7 Meshing parameters for the XV-15 rotor mesh
4.1.3 Test conditions and computations
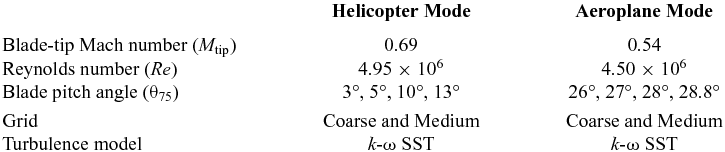
Table 8 summarises the conditions employed and computations performed in hover and propeller mode configurations. For the hover mode, the tip Mach number was set to 0.69, and four blade collective angles were considered, corresponding to low, medium, and high disc loadings. The Reynolds number, based on the reference blade chord of 14 inches and on the tip speed, was 4.95 × 10⁶. The cruise condition was modelled at 0 ft (ISA+0°), with a tip Mach number of 0.54 and advance ratio 0.337. The Reynolds number for this case was 4.50 × 10⁶, again based on the reference blade chord and rotor tip speed (with no account for the advance velocity).
Table 8 Flow conditions for the full-scale XV-15 tiltrotor blade
All flow solutions were computed by solving the RANS equations, coupled with Menter’s k-ω SST turbulence model(Reference Menter50). The flow equations were integrated with the implicit dual-time stepping method of HMB, using a pseudo-time Courant–Friedrichs–Lewy (CFL) equal to 4 for the helicopter mode computations, and equal to 2 for the aeroplane mode. Typically, 40,000 iterations were necessary to drop the residual by 6 orders of magnitude for the flow solutions. Solutions were computed on 232 cores of the high performance computer cluster of Glasgow University, comprised of Intel Xeon E5620 processors. For the XV-15 case with the coarse chimera grid (6.2 million cells per blade), the wall-clock time needed to achieve a fully converged solutions was 17.1 hours.
4.1.4 Helicopter mode - Results
The effect of the mesh density on the figure of merit, and torque coefficient CQ as a functions of the thrust coefficient CT are shown in Fig. 13. Experimental data of the full-scale XV-15 rotor is also shown, carried out by Felker et al(Reference Felker, Betzina and Signor16) at OARF, and Light(Reference Light18) and Betzina(Reference Betzina19) at the NASA 80 × 120ft wind tunnel. The majority of works on performance analysis of rotor blades do not model the hub and root apparatus, mainly due to the complexity of mesh generation. In this regard, experiments were corrected for hub and apparatus tares effects. Vertical lines labelled as empty (4,574 kg) and maximum gross (6,000 kg) weight, define the hovering range of the XV-15 helicopter rotor(Reference Maisel, Giulianetti and Dugan1), which highlights a limited hovering operational range. Momentum-based estimates of the figure of merit are also included, and its expression is given in Equation 2, where an induced power factor ki of 1.1 and overall profile drag coefficient C D0 of 0.01 were used. This theory, is limited to low and medium thrust, leading to a wrong trend of the power divergence at high thrust, mainly due to flow separation(Reference Brocklehurst53).
 $$\begin{equation}
{\rm FoM}=\frac{{C_T}^{3/2}}{\sqrt{2} \bigg (\sigma \frac{C_{D0}}{8} + k_i\frac{{C_T}^{3/2}}{\sqrt{2}}\bigg )}.
\end{equation}$$
$$\begin{equation}
{\rm FoM}=\frac{{C_T}^{3/2}}{\sqrt{2} \bigg (\sigma \frac{C_{D0}}{8} + k_i\frac{{C_T}^{3/2}}{\sqrt{2}}\bigg )}.
\end{equation}$$
Using the obtained CFD results, polynomial fit was computed and they are represented with solid lines and square (coarse grid) and triangle (medium grid) symbols. Considering the set of experiments, an overall good agreement was found between all of them, with a maximum discrepancy of 4.11% in figure of merit. The reason for this disagreement (4 counts of FoM) may be partly due to the variations in experimental data between wind tunnel facilities. CFD results present an excellent agreement with the test data of Betzina(Reference Betzina19) for all blade collective angles. It is found that the effect of the grid size on the overall performance is negligible at low thrust, with a small influences at high thrust.

Figure 13. Effect of the mesh density on the figure of merit (left) and torque coefficient (right) for the full-scale XV-15 rotor.
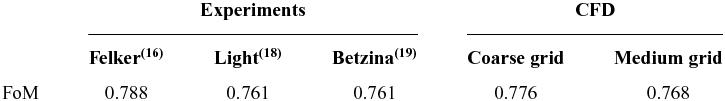
The comparison of predicted and measured(Reference Felker, Betzina and Signor16,Reference Light18,Reference Betzina19) peak Figure of Merit is reported in Table 9. Experiments performed by Felker show a higher Figure of Merit (2 counts) if compared with the Light and Betzina experiments. A large recirculation zone was reported in the 80 × 120 test section of NASA by Felker, which may be the reason of this disagreement. Predictions with the medium grid indicate good correlation with the experiments (0.91% respect to Betzina and Light, and 2.53% respect to Felker), which confirms the suitability of the present method for tiltrotor blade applications.
Table 9 Predicted and experimental peak FoM for the full-scale XV-15 rotor

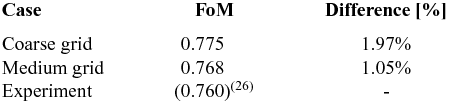
From a point of view of the turbulent model employed, it seems that the fully turbulent flow assumption is able to capture the trend of FoM and torque coefficient (Fig. 13(b)). Similar conclusions were drawn in previous work by Kaul et al(Reference Kaul and Ahmad23), Yoon et al(Reference Yoon, Pulliam and Chaderjian26), and Sheng et al(Reference Sheng and Zhao27), where fully turbulent flows were successfully employed. Comparison between predicted and measured(Reference Wadcock, Yamauchi and Driver20) FoM at a collective pitch angle of 10° is reported in Table 10. Prediction with the medium grid indicates good correlation with the experiments (0.8 counts of FoM), which highlights the ability of this medium grid in accurately predicting the FoM with a modest CPU time.
Table 10 Predicted and experimental(Reference Wadcock, Yamauchi and Driver20) figure of merit at collective pitch angle of 10°


Figure 14. Comparison of predicted surface pressure coefficient between HMB3 using the coarse grid and OVERFLOW2 from Kaul et al(Reference Kaul24).
4.1.5 Surface pressure predictions
Due to the lack of experimental surface pressure measurements, a comparison between HMB3 and CFD data published by Kaul et al(Reference Kaul24) using the OVERFLOW2 solver is shown in Fig. 14. Three radial stations were considered (r/R = 0.72, 0.83, and 0.94), and the collective pitch angle was 10°. The surface pressure coefficient is computed based on the local velocity at each radial station:
 $$\begin{equation}
C_P=\frac{P-P_{\infty }}{1/2 \rho _\infty (\Omega r)^2}
\end{equation}$$
$$\begin{equation}
C_P=\frac{P-P_{\infty }}{1/2 \rho _\infty (\Omega r)^2}
\end{equation}$$
CFD results using HMB3 correspond to the coarse grid (18.6 million cells for the three blades) where the k-ω SST turbulence model(Reference Menter50) was employed, while Kaul’s results were obtained with a grid size of 35 million cells using the Spalart-Allmaras turbulence model(Reference Spalart and Allmaras25). Despite that small variation on the predicted peak CP is seen by the different numerical simulations, a fair agreement is found for all radial stations. Regarding the radial stations r/R = 0.72 and r/R = 0.83, it is clear that the suction peak does not exceed the critical C* P values (Equation (4)), while the most outboard section (r/R = 0.94) reaches sonic conditions.
 $$\begin{equation}
{C^*_P}=\frac{2}{\gamma ({M_{{\rm tip}}\frac{r}{R}})^2}\bigg [\bigg ({\frac{2+(\gamma -1){(M_{{\rm tip}}\frac{r}{R})^2}}{\gamma +1}}\bigg )^{\frac{\gamma }{\gamma -1}}-1\bigg ].
\end{equation}$$
$$\begin{equation}
{C^*_P}=\frac{2}{\gamma ({M_{{\rm tip}}\frac{r}{R}})^2}\bigg [\bigg ({\frac{2+(\gamma -1){(M_{{\rm tip}}\frac{r}{R})^2}}{\gamma +1}}\bigg )^{\frac{\gamma }{\gamma -1}}-1\bigg ].
\end{equation}$$
4.1.6 Sectional loads
Figure 15 shows the distribution of sectional thrust and torque coefficients along the rotor radius for collective pitch angles from 3° to 13°. The influence of the tip vortex on the tip region (from 90% R to 100% R) is visible in terms of loading and torque coefficients. It is interesting to note that the torque coefficient is significantly decreased in the tip region (r/R > 0.90) as consequence of the change on the planform due to the twist and aerofoil sections.

Figure 15. Blade sectional thrust coefficient (left) and torque coefficient (right) for the full-scale XV-15 rotor in helicopter mode.
4.1.7 Aeroacoustic analysis
The Helicopter Ffowcs Williams-Hawkings (HFWH) code is used here to predict the mid and farfield noise on the full-scale XV-15 main rotor. This method solves the Farassat 1A formulation (also known as retarded-time formulation) of the original Ffowcs Williams-Hawkings FW-H equation(Reference Ffowcs-Williams and Hawkings54), which is mathematically represented by:
 $$\begin{eqnarray}
4 \pi a_{0}^2(\rho ({\bf x},{\bf t})-\rho _0) &=& \frac{\partial }{\partial t}\int \frac{\rho _0 u_n}{r} \delta (f)\frac{\partial f}{\partial \mathrm{x_j}}\, \mathrm{dS(y)} -\frac{\partial }{\partial \mathrm{x_i}} \int \frac{P_{ij}}{r}\delta {(f)}\frac{\partial f}{\partial \mathrm{x_j}}\, \mathrm{dS(y)}\nonumber\\
&&+\,\frac{\partial ^2}{\partial \mathrm{x_i}\mathrm{x_j}} \int \frac{T_{ij}({\bf y},{\bf t-r/c})}{r}\, \mathrm{dV(y)}.
\end{eqnarray}$$
$$\begin{eqnarray}
4 \pi a_{0}^2(\rho ({\bf x},{\bf t})-\rho _0) &=& \frac{\partial }{\partial t}\int \frac{\rho _0 u_n}{r} \delta (f)\frac{\partial f}{\partial \mathrm{x_j}}\, \mathrm{dS(y)} -\frac{\partial }{\partial \mathrm{x_i}} \int \frac{P_{ij}}{r}\delta {(f)}\frac{\partial f}{\partial \mathrm{x_j}}\, \mathrm{dS(y)}\nonumber\\
&&+\,\frac{\partial ^2}{\partial \mathrm{x_i}\mathrm{x_j}} \int \frac{T_{ij}({\bf y},{\bf t-r/c})}{r}\, \mathrm{dV(y)}.
\end{eqnarray}$$
where Tij = ρuiuj + Pij − c 2(ρ − ρ0)δ ij is known as the Lighthill stress tensor(Reference Lighthill55), which may be regarded as an “acoustic stress”. The first and second terms on the right-hand of Equation (5) are integrated over the surface f, whereas the third term is integrated over the volume V in a reference frame moving with the body surface. The first term on the right-hand, represents the noise that is caused by the displacement of fluid as the body passes, which known as thickness noise. The second term accounts for noise resulting from the unsteady motion of the pressure and viscous stresses on the body surface, which is the main source of loading, blade-vortex-interaction, and broadband noise(Reference Brentner and Farassat56). If the flowfield is not transonic or supersonic, these two source terms are sufficient(Reference Brentner and Farassat56). The sound is computed by integrating the Ffowcs Williams-Hawkings equation on an integration surface placed away from the solid surface. The time-dependent pressure signal that appears in Equation (5) is obtained by transforming the flow solution from the blade reference frame to the inertial reference frame. This acoustic-code has been previously employed for three-dimensional rotor hover predictions such the S-76 rotor (See Jimenez and Barakos(Reference Jimenez and Barakos43)), showing a good correlation with the theory(Reference Gopalan and Shmitz57,Reference Gopalan and Shmitz58) .
A comparison with theory was conducted in terms of total noise predictions. Analytical solutions are based on the work of Gopalan et al(Reference Gopalan and Shmitz57,Reference Gopalan and Shmitz58) and have been successfully employed in the helicopter community(Reference Kusyumov, Mikhailov, Garipova, Batrakov and Barakos59). The key idea is to convert the FW-H integral equations to an explicit algebraic expressions. Figure 16 shows a comparison of the theoretical and numerical total noise given in dB, as a function of the radial distance in the rotor disk plane. Three collective pitch angles were selected for this study (θ75 = 7°, 10°, 13°), which cover medium and high thrust using the coarse grid. The results show a fair agreement between theory and the predicted total noise for all collective pitch angles, although small differences were found at radial distance lower than 2R. In fact, this supports the idea that this theory is only valid at radial distance above 3R.

Figure 16. Total noise in dB as function of the normalised radial distance r/R at the tip plane of the full-scale XV-15 rotor.
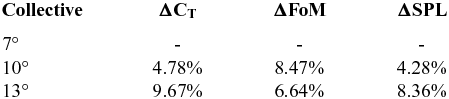
Table 11 shows the effect of the collective pitch angle when increased from 7° to 10° and 13° degrees on the thrust coefficient, FoM, and total noise. It is clearly seen that the thrust coefficient linearly increases with the collective, whilst the FoM presents a drop of almost 2%. As expected, the sound pressure level (SPL) correlates in a linear fashion with the collective.
Table 11 Effect of the collective collective pitch angle on the thrust coefficient, FoM, and total noise in SPL for the full-scale XV-15 rotor

4.1.8 Aeroplane mode - results
Like for hover simulations, only a third of the computational domain was meshed, modelling this case as steady-state problem with periodic conditions for the flow in the azimuthal direction. Simulations were performed for medium advance ratio μ = 0.337 at collective pitch angles of 26°, 27°, 28° and 28.8°, and tip Mach number of 0.54 (see Table 8). In aeroplane mode, the indicator of the rotor efficiency is the propeller propulsive efficiency, which is the ratio between the useful power output of the propeller and the absorbed power:
 $$\begin{equation}
\eta = \frac{C_T V_\infty }{C_Q V_{\rm tip}}.
\end{equation}$$
$$\begin{equation}
\eta = \frac{C_T V_\infty }{C_Q V_{\rm tip}}.
\end{equation}$$
Figure 17 compares the total load predictions with the available experimental data(14) (represented by square symbols), where the propeller efficiency η and torque coefficient are given as function of the thrust coefficient. The experimental data reported here, were performed on a propeller test rig in the NASA 40-by-80-Foot Wind Tunnel(14), and are the only available published data for the XV-15 in aeroplane mode. HMB3 results with the coarse grid show an under-predicted propulsive propeller efficiency for all thrust coefficient, with a maximum discrepancy of 4.5%. However, results with the medium grid provide a good agreement with the experimental data.

Figure 17. Propulsive propeller efficiency and torque coefficient as function of the thrust coefficient for the XV-15 rotor blade in propeller mode configuration.
4.1.9 Sectional loads
Propeller radial loading distributions are shown in Fig. 18 in terms of sectional thrust and torque coefficients along the rotor radius. For this case, results with the coarse grid were used. A low collective pitch angles (θ75 = 26°), a negative predicted loadings is observed covering up to 40% R. In fact, the inboard part of the propeller is acting as a windmill (power is absorbed from the flow) mainly due to the negative angle of the attack seen by those aerofoils. Consequently, this leads to a low propeller efficiency for this flight cruise condition. For high collective pitch angles (θ75 = 28° and 28.8°), however, both inner and outer parts act as a propeller, providing a high efficiency.

Figure 18. Blade sectional thrust coefficient (left) and torque coefficient (right) for the full-scale XV-15 rotor in aeroplane mode.
4.1.10 Surface pressure predictions
Figure 19 presents predicted pressure coefficient contours for the XV-15 upper blade at the computed advance ratio, where the CP is computed based on the local velocity. Results at low thrust coefficient confirm the idea that the inboard part of the rotor is under-loaded. As the collective pitch angle increased, contours of CP at outboard part of the blade indicates a more uniform propeller load distributions.

Figure 19. Contours of surface pressure coefficient for the XV-15 rotor blade.
4.1.11 Flowfield details
Flowfield visualisation of the rotor wake for the full-scale XV-15 rotor blade in propeller mode using the Q criterion(Reference Jeong and Hussain51) is given in Fig. 20. Contours of surface pressure coefficient are also included. Despite that a coarse grid size was used as background (2.6 million cells), the wake development shows a well-preserved first and second passage of the vortex. Moreover, the interaction between blade and vortex typically encountered in hovering rotors is not presented here. In fact, the downstream convection of the rotor wake at M ∞ = 0.182, results in a much less complex wake.

Figure 20. Wake visualisation of the propeller wake using Q-criterion shaded by contours of CP at blade pitch angle of θ75 = 26 o (left) and θ75 = 28.8 o (right).
4.2 TILTAERO tiltrotor blades - Aerodynamic study
In this section, the hover performance of the TILTAERO blades is investigated. In the frame of TILTAERO, ADYN, and DART European projects, the TILTAERO blades were manufactured by the Netherlands Aerospace Centre (NLR), and tested in the 8 × 6 m open test section of the DNW-LLF wind tunnel. The radius of the TILTAERO rotor was R = 1.48 m, and the reference chord of the blade, taken equal to the mean aerodynamic chord, was c ref = 0.209 m. This leads to a high rotor solidity, along with the small aspect ratio blades. Unlike the XV-15 rectangular planform, the TILTAERO’s planform includes a swept-back tip, which is also tapered by 21.53%. The fact that the TILTAERO blade has a more modern tip-shape design that the XV-15 blade along with the recent wind tunnel campaign suggested it should be included here for further validation of the HMB method.
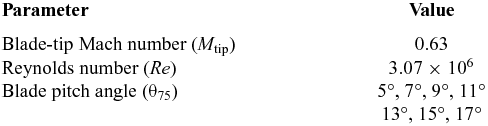
Table 12 summarises the employed conditions and the computations performed in helicopter configuration. The tip Mach number was set to 0.63, and seven blade collective angles were considered. The Reynolds number, based on the reference blade chord and the tip speed V tip = 214.38 m/s, was 3.07 × 10⁶. All flow solutions were computed by solving the RANS equations, coupled with Menter’s k-ω SST turbulence model(Reference Menter50). The flow equations were integrated with the implicit dual-time stepping method of HMB, where 75,000 iterations were necessary to drop the residual by 6 orders of magnitude.
Table 12 Flow conditions for the TILTAERO tiltrotor blade
The predicted rotor figure of merit obtained with HMB3, is compared with experimental data from the DNW wind tunnel and simulations performed by Beaumier(Reference Beaumier, Decours and Lefebvre11) with the elsA CFD solver (Fig. 21). Momentum-based estimates of the figure of merit are also included, with and induced power factor ki of 1.2 and overall profile drag coefficient C D0 of 0.01. At low and medium thrust, elsA results show good agreement with the experimental data, while the FoM is slightly under-predicted by HMB3. At high thrust (CT /σ ⩾ 0.11), however, the drop of FoM is very well predicted by HMB3. The results in this section help quantify differences between high-fidelity methods due to differences in mesh sizes, turbulence modes, and numerical schemes employed.

Figure 21. Comparison of the predicted figure of merit by elsA(Reference Beaumier, Decours and Lefebvre11) and HMB3 CFD solvers, with the available experimental data at the DNW wind tunnel(Reference Beaumier, Decours and Lefebvre11).
5.0 CONCLUSIONS
This paper demonstrated the capability of HMB3 to accurately predict tiltrotor flows. The ERICA model, the full-scale XV-15 and TILTAERO tiltrotor blades were considered for validation. The main conclusions are:
-
• For the ERICA model, the overall effect of the blades on the fuselage was well captured. It was found that the fuselage pressure was easier to predict than rotor loads.
-
• The method was able to capture the performance in the different modes; hover and propeller.
-
• Good agreement was found for the TILTAERO loads, where the drop of FoM at high thrust was well predicted.
-
• Measurements of surface blade data for tiltrotor blades are needed.
Part II presents aerodynamic optimisation of tiltrotor blades with high-fidelity computational fluid dynamics.
ACKNOWLEDGMENTS
The use of the cluster Chadwick of the University of Liverpool is gratefully acknowledged. Some results were obtained using the EPSRC funded ARCHIE-WeSt High Performance Computer (www.archie-west.ac.uk), EPSRC grant no. EP/K000586/1. Part of this work is funded under the HiperTilt Project of the UK Technology Strategy Board (TSB) and Leonardo Helicopters under Contract Nr. 101370. The authors would like to acknowledge the use of the NICETRIP experimental data and model geometry.