


INTRODUCTION
The species Xiphopenaeus kroyeri Heller, 1862, known as sea-bob shrimp, is an intensely exploited penaeid shrimp along the Brazilian coast (MMA—IBAMA, 2008). This shrimp has social and economic importance due to the high volume of commercial catch and because it is a species accessible to artisanal fishing communities (Graça Lopes et al., Reference Graça Lopes, Santos, Severino-Rodrigues, Braga and Puzzi2007). On the east coast of Brazil (~17°S–23°S), the annual production of shrimp through extractive fishing is estimated at about 5000 tons, which represents 42% of the total production of marine crustacean fisheries (Branco, Reference Branco2005; MMA—IBAMA, 2008). At present, studies on this species are considered a priority for the Brazilian government due to its importance as a fishery resource and the fact that it is over-exploited in some regions of the country (Geo Brasil, 2002; Francisco et al., Reference Francisco, Pinheiro, Silva and Galetti2009).
Sea-bob shrimp presents tropical distribution in the western Atlantic Ocean, and occurs from Virginia (USA, ~36°N) to Rio Grande do Sul (Brazil, ~32°S) (Holthuis, Reference Holthuis1980). The greatest abundance of penaeid shrimp is associated with water depth inferior to 30 m and with sand and mud bottom (Branco et al., Reference Branco, Lunardon-Branco, Souto and Guerra1999). Penaeid shrimp shows sexual dimorphism, with males having smaller body size than females (Gulland & Rothschild, Reference Gulland and Rothschild1981). The growth differential between sexes is responsible for allometric differences between males and females (Hartnoll, Reference Hartnoll and Abele1982).
Geometric morphometry is a technique applied in studies of variation and covariation of the form of biological structures and enables the separation of stocks or populations through the analysis and quantification of shape variation between groups (Monteiro & Reis, Reference Monteiro and Reis1999; Cadrin, Reference Cadrin2000). This tool is effective in identifying fish stocks and has contributed with information to the management of commercially exploited resources (Devries et al., Reference Devries, Grimes and Prager2002; Monteiro et al., Reference Monteiro, Di Beneditto, Guillermo and Rivera2005; Vasconcellos et al., Reference Vasconcellos, Viana, Paiva, Schama and Solé-Cava2008; Oliveira et al., Reference Oliveira, Di Beneditto and Rabelo2009). In the case of crustaceans, there are many studies that apply this technique in order to recognize geographical and population variations (e.g. Rufino et al., Reference Rufino, Abello and Yule2006; Kamilari & Sfenthourakis, Reference Kamilari and Sfenthourakis2009; Riedlecker et al., Reference Riedlecker, Ashton and Ruiz2009; Hopkins & Thurman, Reference Hopkins and Thurman2010; Silva et al., Reference Silva, Mesquita and Paula2010; Tsarev et al., Reference Tsarev, Volkova and Glagolev2011). However, until the present time, there are no studies making use of geometric morphometry as a tool for separating stocks of shrimp. For this group of crustaceans, only traditional morphometry has been applied for this purpose (e.g. Tzeng, Reference Tzeng2004; Anastasiadou & Leonardos, Reference Anastasiadou and Leonardos2008; Konan et al., Reference Konan, Adepo-Goureneb, Ouattaraa, Nyingyc and Gourene2010; Paramo & Saint-Paul, Reference Paramo and Saint-Paul2010).
Studies to identify the stocks of X. kroyeri are important to assist the fisheries management of the species. In this sense, our study first applies the technique of geometric morphometry to this species in order to verify whether the changes related to the shape of the cephalothorax are consistent with the identification of fishery stocks that are distributed on the east coast of Brazil.
MATERIALS AND METHODS
Sampling
Samples of X. kroyeri were collected in the fishing areas of four fishing ports on the east coast of Brazil: Caravelas (17°43′S 39°15′W), State of Bahia (BA); Vitória (20°15′S 40°14′W), State of Espírito Santo (ES); Atafona (21°35′S 41°01′W); and Farol de São Tomé (22°02′S 41°02′W), both in the State of Rio de Janeiro (RJ) (Figure 1).
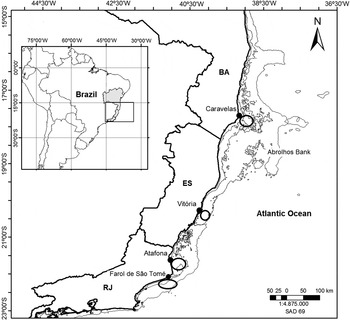
Fig. 1. Sampling areas of Xiphopenaeus kroyeri specimen collection on the east coast of Brazil. Areas of shrimp fishing boats are indicated by circles.
The bottom trawl nets used to capture the shrimps were rather similar among the areas, measuring approximately 8–10 m in length, with a horizontal opening of about 6 m and a cod-end mesh size of 10–15 mm from knot to knot. In Caravelas, shrimp fishing is performed up to 2.5 km from the coastline and 7 m depth, and the fishing area is influenced by the mouth of the Caravelas River. In Vitória, this shrimp fishing is performed up to 2 km from the coastline and 10 m depth. The fishing area receives effluents from steel mills and supply of freshwater from lakes located around this area. In Atafona, the fishing area extends up to 5 km from the coastline and 15 m depth, and is under the influence of the primary and secondary mouths of the Paraíba do Sul River. In Farol de São Tomé, shrimp fishing is performed up to 5 km from the coastline and 20 m depth. During the summer months (December to February) the fishing area is influenced by upwelling of South Atlantic Central Water (SACW), which reduces the water temperature and increases salinity and primary productivity in coastal areas (Muehe & Valentini, Reference Muehe and Valentini1998). Data on environmental characteristics of each area of sample collection and the number of males and females are presented in Table 1.
Table 1. Environmental characteristics and number of Xiphopenaeus kroyeri samples in the collection areas.

BA, State of Bahia; ES, State of Espírito Santo; RJ, State of Rio de Janeiro.
Between June and August 2009 samples of X. kroyeri were collected from fishing performed in the ports studied. In the laboratory, the specimens were classified according to sex and maturity, and only mature shrimps were used in this study. The degree of the petasma fusion was used as a parameter of males' maturity. For females, maturity was determined according to the chromatic variation of the gonads (Campos et al., Reference Campos, Dumont, D'incao and Branco2009). Each specimen selected for this study was weighed (0.1 g) and measured according to the total length and the cephalothorax length (0.1 cm).
The shrimps were preserved in 70% alcohol solution to facilitate the separation of the cephalothorax from the rest of the body. The cephalothorax structure was chosen because it is a rigid anatomical piece, which does not deform easily and optimizes the taking of photographs and morphometric analysis.
Data analysis
The cephalothorax of each specimen was photographed using a Canon Powershot digital camera (10 megapixels). The anatomical landmarks and semi-landmarks were digitized in the TpsDig program (Rohlf, Reference Rohlf2006) (Figure 2). In order to obtain the shape of each specimen, files with X and Y coordinates obtained by digitization of anatomical landmarks and semi-landmarks were analysed through the TPSRew program (Rohlf, Reference Rohlf1998). In this program, the undesirable effects of size, orientation and position of each set of landmarks were removed through the apportionment of the landmark configuration, the rotation and the translation to a common location through Procrustes analysis (Rohlf & Slice, Reference Rohlf and Slice1990; Monteiro & Reis, Reference Monteiro and Reis1999).

Fig. 2. Xiphopenaeus kroyeri cephalothorax with indication of the anatomical landmarks with biological correspondence and semi-landmarks (anatomical landmarks: 1 rostral spine; 2 epigastric spine; 3 postrostral carina; 13 post-orbital spine; 14 spine or pterigostomial angle; 15 antennal spin; 16 orbital spine; semi-landmarks: 4 to 12).
The orthogonal superposition by the minimum square method generates a mean reference configuration, which was used for all specimens to be superimposed. In this method the effects of size are removed by placing the centroid of the settings at the origin (0.0) of the Cartesian system, proportioned equalling the centroid size of each setting to one (1), and rotated so that the sum of squares of the distances between corresponding landmarks is the lowest possible. As semi-landmarks are points without biological correspondence, they slide along the curve or surface until the measure of the difference in shape between the settings is as small as possible (Mitteroecker & Gunz, Reference Mitteroecker and Gunz2009).
For the analysis of deformation, the ‘thin plate spine' technique developed by Bookstein (Reference Bookstein1991) was used. The main components of shape (relative deformations) generated by this technique were used in the analysis of sample clusters. In the present study, eight main components—quantifying 80% of the total variation in shape (Sheets et al., Reference Sheets, Covino, Panasiewicz and Morris2006)—were taken into consideration.
The differences in total length, cephalothorax length and body weight of individuals from each collection area were tested by analysis of variance with the subsequent Tukey test. The analysis of the main components described the orthogonal axes of greatest variation in shape from the partial deformation and it was possible to capture and represent most of the variation along a few axes. The visualization of shape differences among populations was made through the grids of deformation generated by the TPSRew program. Separation of groups from different areas, i.e. different stocks, was carried out by discriminant analysis, which verifies the variation in form between the groups, relative to that within groups, with the main components (relative deformations) that concentrate the highest percentages of variation. Analyses were carried out with R 2.12.2 program for Windows (R Development Core Team, 2011).
RESULTS
The total length of shrimps varied significantly for both sexes between areas studied (males: F = 50.552, P < 0.001; females: F = 6.3428, P < 0.001). In the case of males, specimens from Farol de São Tomé showed total length significantly smaller (P < 0.001) than those collected in other areas of study. Significant difference (P < 0.01) was verified in specimens collected in Vitória, compared with those obtained in Atafona, the former being bigger. For females, those collected in Farol de São Tomé were significantly smaller (P < 0.01) than those obtained in Caravelas (Table 2).
Table 2. Mean values of total length (TL), cephalothorax length (CL) and weight of males and females of Xiphopenaeus kroyeri in the collecting areas.

BA, State of Bahia; ES, State of Espírito Santo; RJ, State of Rio de Janeiro.
Significant differences in the length of the shrimp cephalothorax were also recorded for both males (F = 43.39; P < 0.001) and females (F = 4.9424; P < 0.001). The same patterns recorded for the total length were observed in relation to the length of the cephalothorax. Males from Farol de São Tomé were significantly smaller (P < 0.001) than the others, and those collected in Vitória were bigger (P < 0.001) than those obtained in Atafona. For females, the specimens collected in Farol de São Tomé were smaller (P < 0.01) than those from Caravelas (Table 2).
The weight of the shrimps analysed presented significant difference for males (F = 45.37; P < 0.001) and females (F = 4.09; P < 0.001) between areas of collection. The sample of males from Farol de São Tomé showed lower weight (P < 0.001) than the others and the specimens collected in Vitória were significantly heavier (P < 0.01) than those obtained in Atafona. Females from Farol de São Tomé showed total weight significantly lower (P < 0.05) than those from Caravelas (Table 2).
The discriminant analysis provided a graphic display of the shape differences between fish stocks by the relation between the first three variables obtained. For males, the result was highly significant (F = 21.405; P < 0.001), discriminating individuals according to their place of origin. Cross-validation indicated reliability in the identification of approximately 80% for individuals from Vitória, Atafona and Farol de São Tomé, and only 34% for individuals from Caravelas.
The first canonical axis, which explained 48.51% of the total variation in shape between groups of males studied, indicated that individuals located in the positive portion of the axis had bigger rostrum, postorbital spine located closer to the ventral region and smaller cephalothorax when compared to the negative portion groups. The first axis separated the group of individuals collected in Farol de São Tomé from the group collected in Caravelas, Vitória and Atafona (negative portion of the axis) (Figure 3). The second canonical axis explained 20.09% of the total variation in shape and showed differences in relation to the posterior region and cephalothorax height of the shrimps. Individuals placed in the positive portion of this axis had broader posterior region of the cephalothorax, resulting in longer size of this structure in relation to groups located in the negative extreme. This axis separated by shape difference the group collected in Atafona (positive portion) from that collected in Vitória (negative portion). The group from Caravelas was located in the intermediate region of the second canonical axis (Figure 3).

Fig. 3. Discriminant analysis indicating the relation between the canonical variates 1 and 2 for the total variation in the cephalothorax shape of male Xiphopenaeus kroyeri. Relative deformations grids show shape changes associated with negative (A) and positive (B) scores of the canonical variate 1, and negative (C) and positive (D) scores of the canonical variate 2.
The third canonical axis accounted for only 9.23% of total shape variation in individuals from the four areas studied, indicating differences in posterior region of the cephalothorax (Figure 4). Males located in the positive portion had the posterior region higher than males from the negative part. The third axis separated the shrimps collected in Caravelas in the negative portion, and the shrimps collected in Vitória and Atafona were distributed in both portions (Figure 4).

Fig. 4. Discriminant analysis indicating the relation between the canonical variates 1 and 3 for the total variation in the cephalothorax shape of male Xiphopenaeus kroyeri. Relative deformations grids show shape changes associated with negative (A) and positive (B) scores of the canonical variate 1, and negative (C) and positive (D) scores of the canonical variate 3.
For females, discriminant analysis also showed significant difference (F = 21.304; P < 0.001) in the cephalothorax shape of individuals. The result of cross-validation showed 84% of reliability in the identification of specimens collected in Vitória, 78% for those from Farol de São Tomé and Atafona, and 42% for those from Caravelas.
The first canonical axis explained 43.74% of the total variation in the shape of the cephalothorax between the groups, indicating that individuals located in the positive portion of the axis had bigger rostrum, postorbital spine located closer to the ventral region and smaller cephalothorax when compared to the negative portion groups. This axis grouped females from Farol de São Tomé in the positive portion of the discriminant scores, while individuals from Caravelas, Vitória and Atafona constituted another group in the negative portion (Figure 5). The second canonical axis explained 21.00% of the total variation in the shape of the cephalothorax between the stocks studied. Females placed in the positive portion of this axis had a broader posterior region of the cephalothorax when compared to the negative portion individuals. This axis separated the individuals of Atafona (positive portion), from the individuals collected in Vitória (negative portion). The group from Caravelas was located in the intermediate region of the axis (Figure 5).

Fig. 5. Discriminant analysis indicating the relation between the canonical variates 1 and 2 for the total variation in the shape of the cephalothorax of female Xiphopenaeus kroyeri. Relative deformations grids show shape changes associated with negative (A) and positive (B) scores of the canonical variate 1, and negative (C) and positive scores (D) of the canonical variate 2.
The third axis accounted for 11.38% of the total variation in shape between groups of shrimps and revealed differences in the posterior region of the cephalothorax. Females located in the positive portion had the posterior region of the cephalothorax higher than individuals from the negative part. The third axis separated the females collected in Caravelas in the negative portion, while those collected in Vitória and Atafona were distributed in both portions (Figure 6).

Fig. 6. Discriminant analysis indicating the relation between the canonical variates 1 and 3 for the total variation in the shape of the cephalothorax of female Xiphopenaeus kroyeri. Relative deformations grids show shape changes associated with negative (A) and positive scores (B) of the canonical variate 1, and negative (C) and positive scores (D) of the canonical variate 3.
DISCUSSION
The univariate and multivariate analyses revealed different patterns of structure between groups of X. kroyeri studied, indicating the formation of morphologically distinct stocks for both sexes in the areas where samples were collected. Based on the results of this study, it is possible to identify two morphologically distinct groups of X. kroyeri on the east coast of Brazil, which can be considered as independent stocks, since they have a divergent morphological history (Waldman et al., Reference Waldman, Grossfield and Wrigin1988). The first group is distributed between 17°S and 22°S and includes specimens caught along the fishing area of boats based in the ports of Caravelas (BA), Vitória (ES) and Atafona (RJ). The second group comprises individuals caught in the fishing area of boats based in the port of Farol de São Tomé (RJ), whose area of operation is between 22°05′S and 22°20′S.
Sex differences related to the size and weight of individuals were recorded in all sampling areas. Males showed lower values of total length, cephalothorax length and weight when compared to females, confirming the pattern of allometric growth differential between sexes recorded for this species (Fernandes et al., Reference Fernandes, Silva, Jardim, Keunecke and Di Beneditto2011) and for penaeid shrimps in general (Hartnoll, Reference Hartnoll and Abele1982). According to Gab-Alla et al. (Reference Gab-Alla, Hartnoll, Ghobashy and Mohammed1990), larger cephalothorax and abdomen in females may correspond to ovary development and oocyte production, representing increased fertility.
The body size of X. kroyeri individuals analysed was inversely proportional to the increase of latitude, with the shortest lengths recorded in the sample of Farol de São Tomé (>22°S) and the longest in Caravelas (17°S). Fernandes et al. (Reference Fernandes, Silva, Jardim, Keunecke and Di Beneditto2011) compared the values of asymptotic total length and growth coefficient of X. kroyeri along latitudinal gradients in the south-west Atlantic Ocean and, in general, values are higher at lower latitudes. However, Boschi (Reference Boschi1997) and Castilho et al. (Reference Castilho, Gavio, Costa, Boschi, Bauer and Fransozo2007) verified that for the shrimp Artemesia longinaris the specimens are smallest in low latitudes. Similar result was obtained by Bauer (Reference Bauer1992) for sicyoniids shrimps, in which females from temperate waters are larger than those from tropical waters. Castilho et al. (Reference Castilho, Gavio, Costa, Boschi, Bauer and Fransozo2007) suggested that variations in parameters such as body size, sexual maturity and longevity are influenced by habitat conditions correlated with latitude (e.g. water temperature and food/nutrient supply). However, interspecific characteristics could also be driving these variations.
Castilho et al. (Reference Castilho, Pie, Fransozo, Pinheiro and Costa2008) analyed the abundance of eight shrimp species in south-eastern Brazil (~23°S) in relation to environmental variation, indicating that X. kroyeri occurrence is strongly influenced by water temperature and depth. This penaeid abundance was limited in waters where the temperature was lower than 21°C and beyond 15 m depth. The interference of the environment in the development of an organism can cause changes in shape and induce morphological changes in individuals with the same genotype. This condition is common in species with wide geographical distribution, as in the case of X. kroyeri, and it is called phenotypic plasticity (Peres-Neto & Magnan, Reference Peres-Neto and Magnan2004).
The main differences between the sampling areas are related to salinity, water temperature, sediment type and river discharge (see Materials and Methods; Table 1). In Atafona and Caravelas, the fishing area of the shrimp fleet is influenced by the Paraíba do Sul River and the Caravelas River, respectively, which determine the granulometric characteristics of sediment in coastal areas and affect the temperature and salinity. In Vitória, there are no mouths of rivers near the fishing areas, but there is influence of effluents from industries and coastal lagoons whose bars are periodically opened. In this fishing area, located near Vitória Bay, the coastal sediment is sandy–muddy. In the area of Farol de São Tomé (RJ), in turn, the environmental characteristics above mentioned differ from the other areas studied. In this area there is no discharge of fresh water, coastal sediment is sandy and the water temperature is lower than in the other areas due to the seasonal influence of SACW, which also increases the salinity.
Morphological variation between populations of the same species may also result from genetic differences. Regarding the target species of this study, Voloch & Solé-Cava (Reference Voloch and Solé-Cava2005) analysed samples from fishing areas located between 18°S and 23°S and found no differences between the samples, suggesting the existence of a single population for this area. In contrast, Cadrin (Reference Cadrin2000) argues that morphometric analysis can detect small differences in the structure of stocks that are not identified by genetic data, especially when the structure of the stock is the result of a recent subdivision in the population.
The condition above mentioned can also explain the difference between the shape of the cephalothorax of the X. kroyeri stock located in the fishing area of Farol de São Tomé in relation to the other areas. In this port, A. longinaris represents most of the commercial unload (Semensato & Di Beneditto, Reference Semensato and Di Beneditto2008). Until the late 1990s, the fishing area based in that port (22°05′S–22°20′S) was characterized by A. longinaris, with no record of X. kroyeri in fisheries statistics. However, since 2000 the presence of X. kroyeri began to be gradually recorded in commercial unloads (Di Beneditto A.P.M., personal communication). This indicates a process of recent spread of the species in this region. Probably, the stock of X. kroyeri occurring in the fishing area of Farol de São Tomé originates from that which is distributed over 22°S. South of Farol de São Tomé, the shrimp fishery is characterized by pink shrimp, Farfantepenaeus spp. (MMA—IBAMA, 2008), despite the occurrence of X. kroyeri in fish unloads. Shrimp fishing performed from the ports of Caravelas, Vitória and Atafona is monospecific, addressed only to the sea-bob shrimp.
Previous studies confirm the applicability of geometric morphometry in crustaceans for the recognition of geographical variations and separation of population groups. Rufino et al. (Reference Rufino, Abello and Yule2006), Hopkins & Thurman (Reference Hopkins and Thurman2010) and Silva et al. (Reference Silva, Mesquita and Paula2010) distinguished brachyuran populations by the shape of the cephalothorax, listing the differences with variations in environmental conditions along latitudinal gradients. This technique was also applied successfully in amphipods from the marking of anatomical landmarks in the second gnathopod (Riedlecker et al., Reference Riedlecker, Ashton and Ruiz2009) and in isopod in the pleopod exopodite (Kamilari & Sfenthourakis, Reference Kamilari and Sfenthourakis2009). In the case of shrimp, only traditional morphometry—that considers the combination of linear measurements of the body—had been applied until the present in distinguishing between population groups (stocks). The geometric morphometry has advantages over the traditional one, since it represents the form of homologous parts of the body (with biological correspondence) and not just the size of these parts. It also allows the identification of the relative position or orientation of a given body structure in relation to the body as a whole (Monteiro & Reis, Reference Monteiro and Reis1999). However, Cadrin (Reference Cadrin2000), reviewing the evolution of morphometric techniques in the identification of fish stocks, states that, although efficient, the use of anatomical landmarks may limit the analysis when moving parts of the body are considered (e.g. abdomen and chela of crustaceans).
Geometric morphometry was effective in identifying stocks of X. kroyeri on the east coast of Brazil. The rigidity of the cephalothorax and easy recognition of homologous points along this structure make shrimps good models for studies that use this technique. Considering the commercial importance of the target species, the technique can be applied to its fisheries management. It allows the recognition of the stocks and inference about the processes of fishing area occupation. The occurrence of different stocks of X. kroyeri in areas geographically contiguous, as in the case of Atafona and Farol de São Tomé, demonstrates the importance of such studies in other areas of distribution and commercial exploitation of the species for the application of fisheries policies that maintain their sustainability for commercial purposes.
ACKNOWLEDGEMENTS
We thank fishermen from the fishing ports of Caravelas, Vitória, Atafona and Farol de São Tomé, Dr Ricardo de Freitas Netto and technician Silvana Ribeiro Gomes, who provided us with Xiphopenaeus kroyeri specimens. This work was supported by Conselho Nacional de Desenvolvimento Científico e Tecnológico—CNPq (Proc. 300241/09-7) and Fundação de Amparo a Pesquisa do Estado do Rio de Janeiro—FAPERJ (Proc. E-26/103.038/08, E-26/110.786/10 and E-26/102.915/11). F.G. Bissaro received a graduate fellowship from FAPERJ.


