


INTRODUCTION
Increasing anthropogenic carbon dioxide emissions into the atmosphere due to the combustion of large amounts of fossil fuel combustion has changed the local and global carbon cycle. The impact of these carbon dioxide emissions on the isotopic concertation in trees (tree rings and foliage) is evident (Suess Reference Suess1955; Molnar et al. Reference Molnár, Bujtás, Svingor, Futó and Světlík2007; Hua et al. Reference Hua, Barbetti and Rakowski2013; Pazdur et al. Reference Pazdur, Kuc, Pawełczyk, Piotrowska, Sensuła and Różański2013; Baydoun et al. Reference Baydoun, Samad, Nsouli and Youness2015; Ndeye et al. Reference Ndeye, Sene, Diop and Saliege2017). The physiological processes of trees, such as their photosynthesis rate and stomatal conductance, can be affected not only by carbon dioxide, but also by other air contaminants, gases, and dust associated with human activities, such as industrial processes, road transport, and low and high-stack emissions (Staszewski et al. Reference Staszewski, Godzik, Poborski, Percy, Cape, Jagels and Simpson1994). The CO2 produced during fossil fuel combustion contains no radioactive 14CO2 (Suess Reference Suess1955). On the other hand, there are some other sources of the CO2, where Δ14C values of the CO2 can be higher than in current atmospheric background. For example the processes connected with soil CO2 flux or combustion of biomass or the emission of 14CH4 by factories can enrich 14C in local atmosphere (Molnar et al. Reference Molnár, Bujtás, Svingor, Futó and Světlík2007; Gorczyca et al. Reference Gorczyca, Kuc and Różański2013).The CO2 enters pine needles through their pores and is incorporated into plants by photosynthesis. Investigations performed in 2012–2014 in Silesia (Sensuła et al. Reference Sensuła, Michczyński, Piotrowska and Wilczyński2018, Reference Sensuła, Fagel and Michczyński2021) showed that in contrast to the expected Suess effect (Suess Reference Suess1955), there was a higher radiocarbon concentration in the foliage and pine tree rings grown in the industrial forests of Silesia compared with the 14CNH1 concentration in clean air, estimated based on data from Jungfraujoch (Hammer and Levin Reference Hammer and Levin2017).
In the current study, we attempt to verify whether these effects can still be observed and to determine the radiocarbon concentration in pine tree needles in a multi-source pollution area in Silesia. The aims of this study were to determine spatial variations in the carbon isotopic composition of pine needles and to analyze the components deposited on the foliage surface.
Undertaken studies are a continuation of the authors’ previous reports (Sensuła and Toroń Reference Sensuła and Toroń2019; Sensuła et al. Reference Sensuła, Toroń and Piotrowska2019, Reference Sensuła, Wilczyński, Toroń and Piotrowska2020) presenting the elements deposited on pine needles in previous years. However, pine needles have been used as bioindicators since the end of the 20th century (Ericsson et al. Reference Eriksson, Jensen, Kylin and Strachan1989). They are used to specify the atmospheric pollution in other parts of Poland (Parzych and Jonczak Reference Parzych and Jonczak2014; Szwed et al. Reference Szwed, Żukowski and Kozłowski2021), as well as all over the world e.g., in the Republic of Korea (Chung et al. Reference Chung, Lee, Lee, Park and Shim2021), Finland (Pöykiö and Torvela Reference Pöykiö and Torvela2001), Croatia (Juranović Cindrić et al. Reference Juranović Cindrić, Zeiner, Starčević and Stingeder2019), Lebanon (Baydoun et al. Reference Baydoun, Samad, Nsouli and Youness2015) and others. Data presented in this paper were compared to previously published research.
SEM (scanning electron microscope) imaging and EDS (energy dispersion X-ray spectroscopy) spectra were used to analyze the components deposited on the foliage surface. The working principle of electron imaging is based on de Broglie’s theory and the Davisson and Germer experiment performed at the beginning of the 20th century (Goldstein et al. Reference Goldstein, Newbury, Michael, Ritchie, Scott and Joy2017). SEM and EDS are powerful techniques used in the analysis of sample surfaces. The primary electron beam interacts with the examined sample. Primary electrons can be scattered or absorbed in a sample volume in a depth of less than 100 nm up to 5 µm. The SEM image is created based on secondary electrons emitted from the sample, while specific X-ray emitted from the sample atoms allows estimating the elements present in the surface (Frankel and Aitken Reference Frankel and Aitken1970). We have used these methods to visualize the leaf surfaces and quantify the atomic composition of pollutants. Pine needles have been used as bioindicators for more than three decades (Ericsson et al. Reference Eriksson, Jensen, Kylin and Strachan1989). This kind of research is currently performed worldwide to detect atmospheric pollution (Chung et al. Reference Chung, Lee, Lee, Park and Shim2021).
MATERIALS AND METHODS
Sampling
The sampling sites were located near the heat and power plant Łaziska (HPP Łaziska) in a multi-source pollution industrial area (Figure 1 and Table 1). Two of these sampling sites were the same as those previously investigated in 2012–2014, where a high 14C concentration in pine needles was observed (Sensuła et al. Reference Sensuła, Fagel and Michczyński2021).
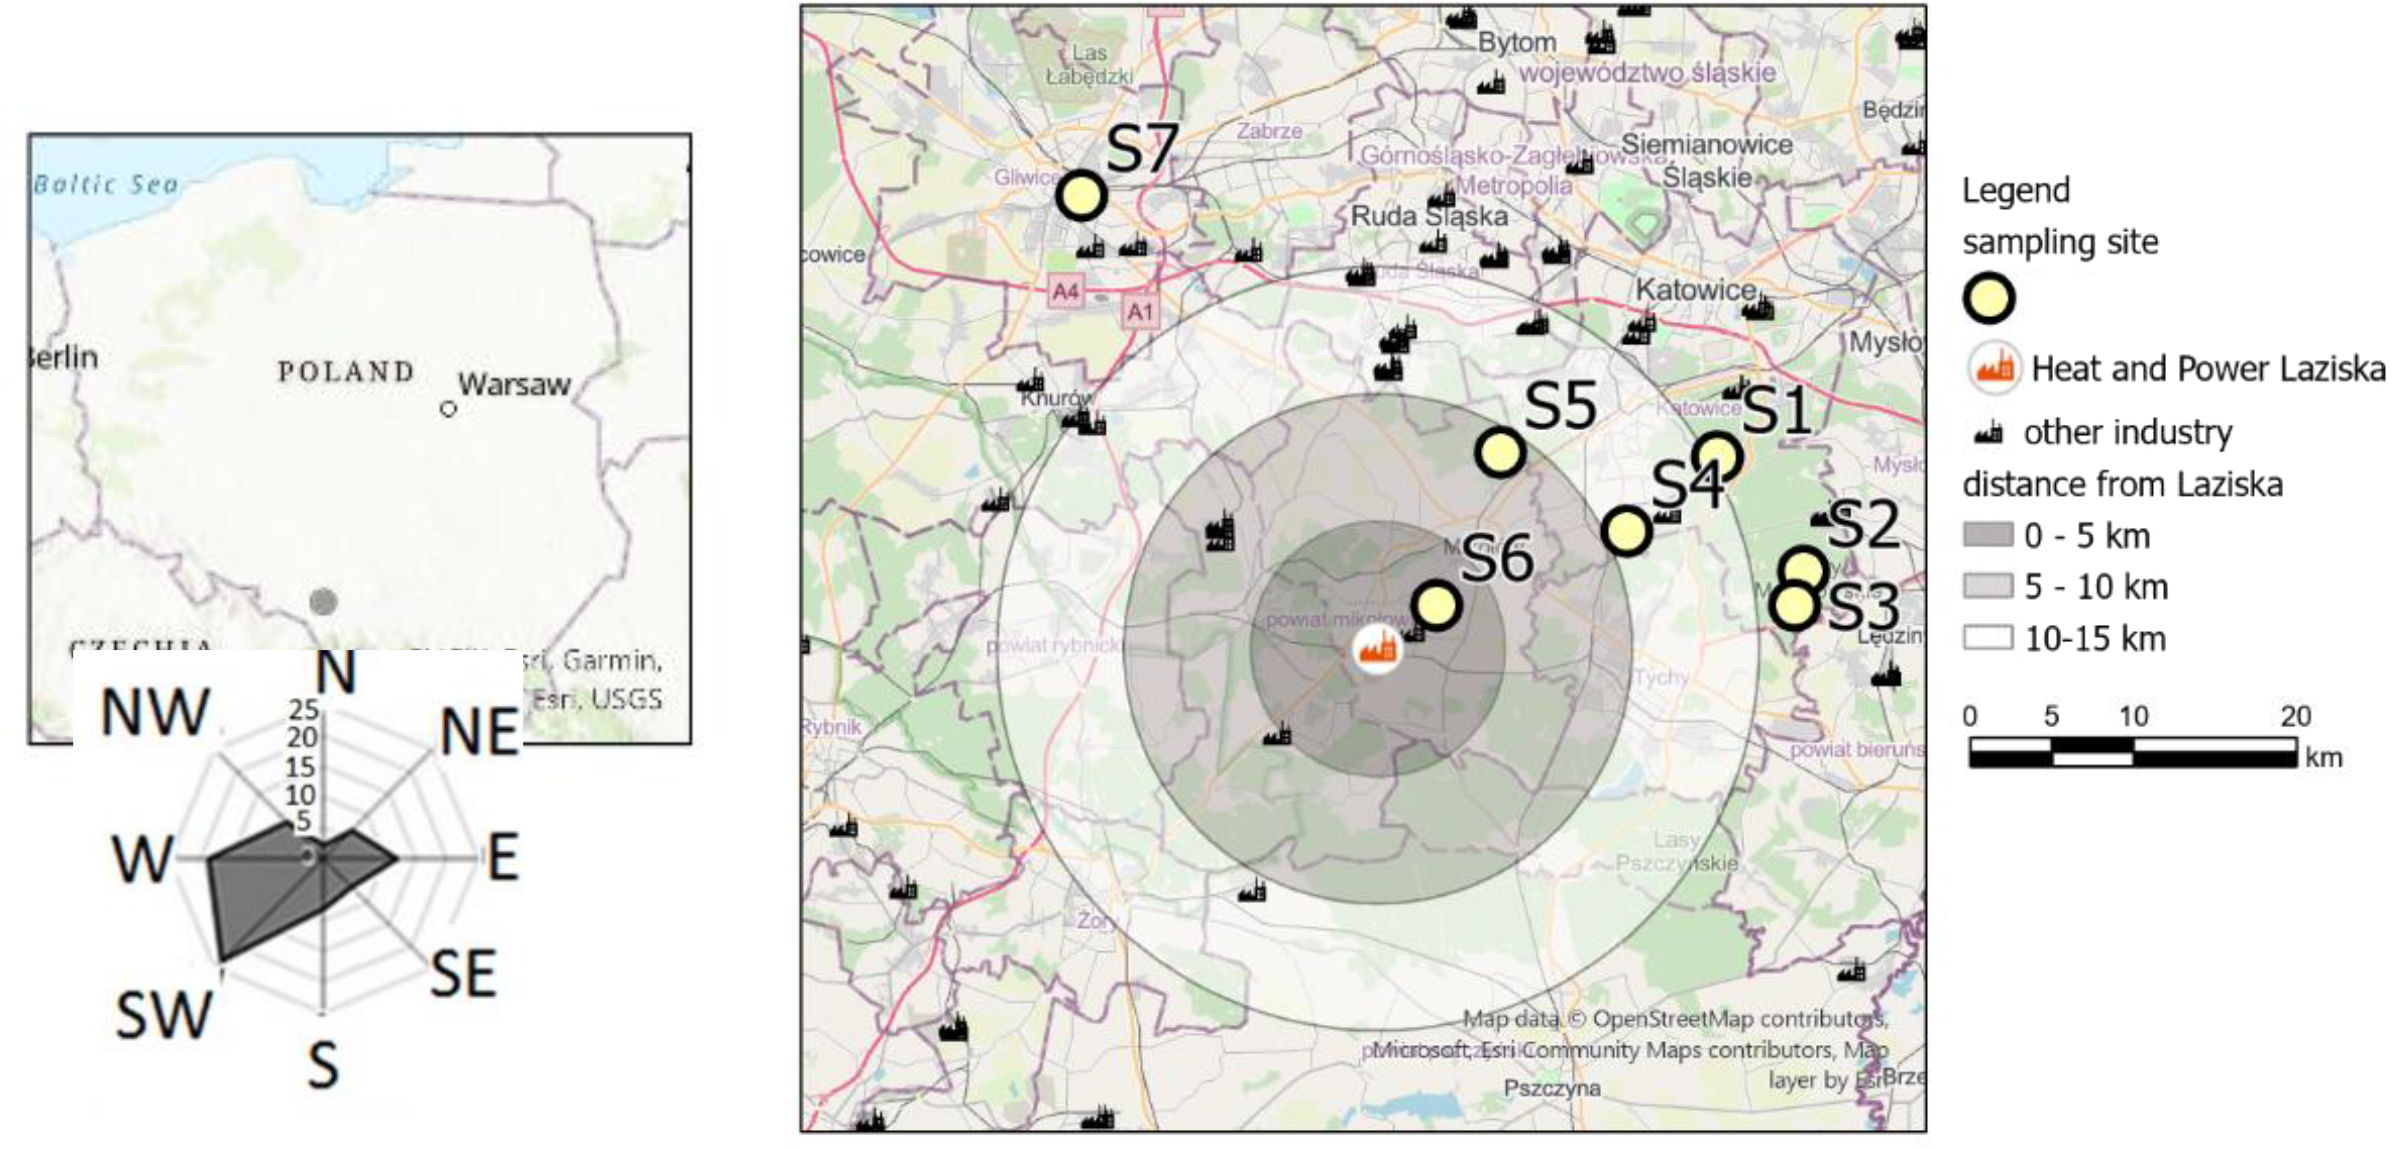
Figure 1 Location of the sampling site and rose of the wind directions in Silesia. The spatial variation of the radiocarbon concentration of 2-year-old pine needles grown in seven sampling sites located near factories, roads, and households in Silesia. The samples were collected in April 2021. Distances of 5 km, 10 km, and 15 km from the heat and power plant Laziska have been marked.
Table 1 Sampling sites.
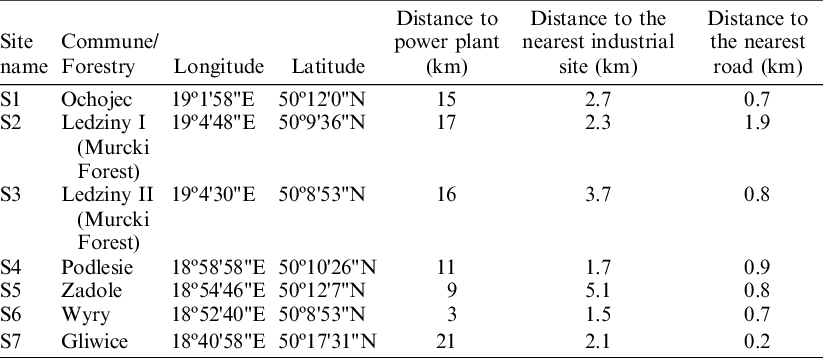
In this study, seven sampling sites were located at different distances from factories, roads, and households, and six sampling sites in different communities (S1, S2, S3, S4, S5, and S6) were located 5 to 25 km from HPP Łaziska. One comparative site (S7) was located in Gliwice. The sampling sites were near streets and in direction of dominant winds. Samples of 2-year-old needles, which began growing in 2019, were collected in April 2021 on the same day- cloudy, not raining time, to avoid weather influences. In a comparative site, we collect two-year-old and one-year-old needles, which began growing in 2019 and 2020, respectively.
Radiocarbon
Needles were collected from the tree crowns, placed in plastic bags, and manually separated in the laboratory. The same standard protocol was used as previously during the analysis of the samples collected in 2012–2014 (Sensuła et al. Reference Sensuła, Wilczynski and Opala2015, Reference Sensuła, Fagel and Michczyński2021). The needles were lyophilized and prepared using a standard acid-alkali-acid treatment; thus, samples were converted to benzene according to the standard procedure used in laboratory (Pawlyta et al. Reference Pawlyta, Pazdur, Rakowski, Miller and Harkness1998; Pazdur et al. Reference Pazdur, Kuc, Pawełczyk, Piotrowska, Sensuła and Różański2013) for liquid scintillation counter (LSC) measurements. Determination of fraction of modern carbon (F14C) and thus Δ14C in pine needles was performed with a β-radiation liquid scintillation spectrometer (Quantulus 1220 type) (Pawlyta et al. Reference Pawlyta, Pazdur, Rakowski, Miller and Harkness1998; Pazdur et al. Reference Pazdur, Kuc, Pawełczyk, Piotrowska, Sensuła and Różański2013). The reference material ANU Sucrose (Rozanski Reference Rozanski1991) was used. The average activity of the background and ANU sucrose standard activity was at the same level as presented in Sensuła et al. Reference Sensuła, Fagel and Michczyński2021.The 14CNH1 concentration in clean air was estimated based on data from the monitoring station in Jungfraujoch, which was not affected by the local Suess effect (Emmenegger et al. Reference Emmenegger, Leuenberger and Steinbacher2021). In our approach, plant material was normalized to a δ13C of –25‰ (Stuiver and Polach Reference Stuiver and Polach1977). The measured 14C concentration or activity was corrected and normalized to the standard of modern biosphere, resulting in the value of F14C (Reimer et al. Reference Reimer, Brown and Reimer2004).
The Δ14C value (‰), was calculated according to the following formula (Stuiver and Polach Reference Stuiver and Polach1977, Mook and van der Plicht Reference Mook and van der Plicht1999; van der Plicht and Hogg Reference van der Plicht and Hogg2006) method:
 $$\Delta {}^{14}{\rm{C = (}}F{}^{14}{\rm{C}} \cdot {e^{ - \lambda ({T_i} - 1950)}} - 1) \cdot 1000$$
where: F 14C – normalized radiocarbon concentration; λ – decay const ant for radiocarbon equal to 8267 yr–1; T i – calendar year of the samples collection).
The local Suess effect 14S and fossil fuel CO2 (FFCO 2) emission can be calculated and expressed as:
 $${}^{14}S = {{\Delta {}^{14}{C_{bg}} - \Delta {}^{14}{C_{meas}}} \over {\Delta {}^{14}{C_{bg}} + 1000}}\;100\% $$
 $$FFC{O_2} = {{C{O_{2\;fossil}}} \over {\;C{O_{2\;meas}}}} = {{\Delta {}^{14}{C_{bg}} - \Delta {}^{14}{C_{meas}}} \over {\Delta {}^{14}{C_{bg}} + 1000}}$$
where: Δ14Cbg –background values of atmospheric CO2; Δ14Cmeas – the local value of CO2.
SEM and EDS Methods
The micrographs of pine needle surfaces were acquired by a scanning electron microscope (SEM; Phenom PRO X, Thermo Fisher Scientific). Based on the images, the clean-to-coated surface area ratio was estimated. The chemical composition of pollutants was investigated by energy-dispersive X-ray spectroscopy (EDS), which allows for the collection of secondary electrons within the energy range of 0.2–15 keV. ImageJ software was used to analyze the polluted surface area of pine leaves.
To ensure that SEM imaging and EDS analysis gave reliable information about the pollutants on the needle surfaces, the needle samples were collected from the forest and then placed in tubes and closed with sterile gauze to protect their surfaces from further contamination by human hands or the air in the laboratory. This also allowed water to evaporate freely from the tube, which protected the samples from mold growth. No further treatment was applied.
Surface area measurements were performed by ImageJ software and were used to calculate the coated leaf area ratio R P as the ratio of the polluted area to the entire surface area:
 $$Rp = {{{A_P}} \over {{A_S}}} \cdot 100\% ,$$
where A P is the polluted area of pine needles, and A S is the entire area of the needles.
RESULTS AND DISCUSSION
Radiocarbon
In the investigated highly-populated and industrialized region of Poland, where coal burning is the largest source of CO2 emissions, a Suess effect is expected. In most of the sampling sites, this effect was noted. Each sampling site was located next to streets and not far from households and factories. Since trees absorb carbon dioxide from the atmosphere during photosynthesis through leaf stomata, a significant Suess effect in all investigated sites was expected. Figures 1 and 2 show that Δ14C in the pine needles collected in 2021 was significantly lower than that of the samples collected in 2012–2014 (Sensuła et al. Reference Sensuła, Fagel and Michczyński2021). In 2021, in most of the investigated pines, the radiocarbon concentration was at a similar level (–10‰). A significantly lower value of Δ14C (–30‰) was observed only in one location (S3), whereas a slightly higher 14C concentration in pines relative to the 14C concentration of clean air (14CNH1) was observed only in one site (S7). A relatively small decrease in Δ14C in the pine needles relative to 14CNH1 may be due to different local sources and origins of carbon dioxide. These include traffic, households, and industrial activities, as well as the combustion of biomass or the utilization of medical materials used as tracers (Sensuła et al. Reference Sensuła, Fagel and Michczyński2021). It has been observed that Δ14C in the 2-year-old needles (which began growing in 2019) was lower than that of the one-year-old needles (which began growing in 2020). This effect was expected due to a decrease in 14CNH1 and the loss of 14CO2 containing artificially-produced 14C atoms due to CO2 exchange between different reservoirs of the Earth’s carbon cycle. This was connected inter alia to dissolved CO2 in oceans (Hua et al. Reference Hua, Barbetti and Rakowski2013); thus, trees can be used in environmental biomonitoring applications.
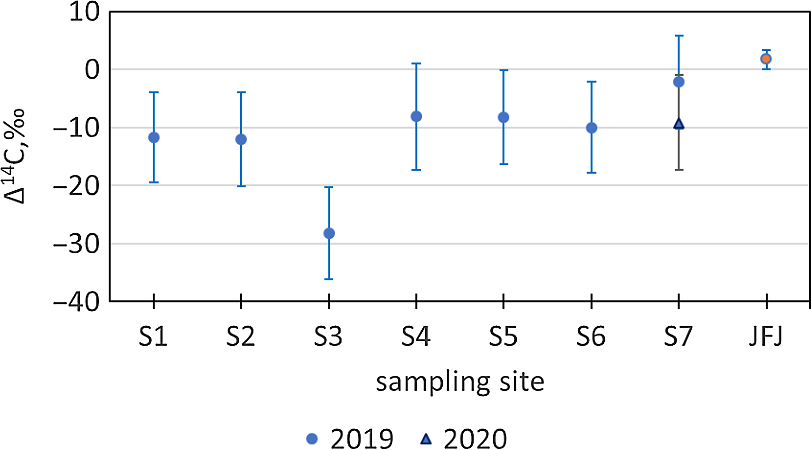
Figure 2 Δ14C in 2-year-old needles grown in seven sampling sites (S1-S7) in the Silesia region near roads, households and in the air (JFJ-the reference value of the Jungfraujoch background), and factories, and a comparison to the fraction of modern carbon in 1-year-old needles grown near Gliwice (S7). The local Suess effect is noted in sampling site S3.
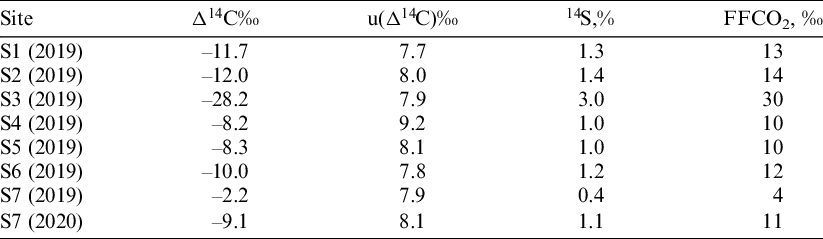
The determination of foliage properties can be used to analyze local and regional environmental changes due to contaminants originating from different sources. The local Suess effect (14S) is calculated to vary from 0.4 to 3% (at S3) (see Table 2), the median of 14S value calculated from Equation (2) from the investigated area is ca. 1.2%. However, we cannot exclude that the simplified formula of Equation (2) probably results in underestimation of the Suess effect for all investigated sites. Making the analysis of the carbon cycles and Suess effect according to the models (for example Turnbull et al. Reference Turnbull, Keller, Baisden, Brailsford, Bromley, Norris and Zondervan2013) there are many different factors that simulates biological and physical processes controlling carbon cycles. That model has a set of 43 ecelogical parameters and take into account for example heterotrophic respiration, biomass burning, oceanic CO2 sources, and nuclear-industry-produced 14C. In Poland, there is no nuclear power plant, so the impact of the enrichment of atmospheric carbon dioxide in 14CO2 from nuclear power plants (Molnar et al. Reference Molnár, Bujtás, Svingor, Futó and Světlík2007; Baydoun et al. Reference Baydoun, Samad, Nsouli and Youness2015) in pine needles was neglected and we assume that there is no nuclear industry bias in our samples. Whereas, CO2 emissions from biomass burning may play a significant role in Silesia. The biomass burning fraction is enriched in 14C compared to the background, as the wood integrates 14C over the lifetime of the trees. Wood has been used for heating the houses and coocking. Also biomass have been used in industrial sector. We cannot exclude the influence connected with recycling of the medical waste, where radiocarbon are used as markers. This is probably the reason, why the sample shows a similar value as Jungfraujoch: the fossil-fuel emission from this city (depleted in 14C) and the biomass burning emissions (enriched in 14C) presumably compensate each other at least partially.
Table 2 Carbon isotopic composition of the needles and Suess effect, fossil fuel emission of CO2.
SEM and EDS Studies
SEM micrographs were analyzed to calculate the ratio of polluted areas. Figure 3 shows representative images and their EDS spectra for the most and least polluted sites. The contaminated surface areas differ for various needles. The amounts of pollutants on needle surfaces varied depending on the site, and some samples were significantly contaminated (Figure 3a), whereas others were covered with few pollutants (Figure 3b, 3c). The contaminants usually conglomerated and took the form of plate islands (Figure 3). In some cases, deposited pollutants covered the needles’ stomata and were even invisible in the most polluted leaves (Figure 3a). The question arises whether only deposited contaminants influence the life functions of trees, or whether the mechanical blockage of stomata is also significant.
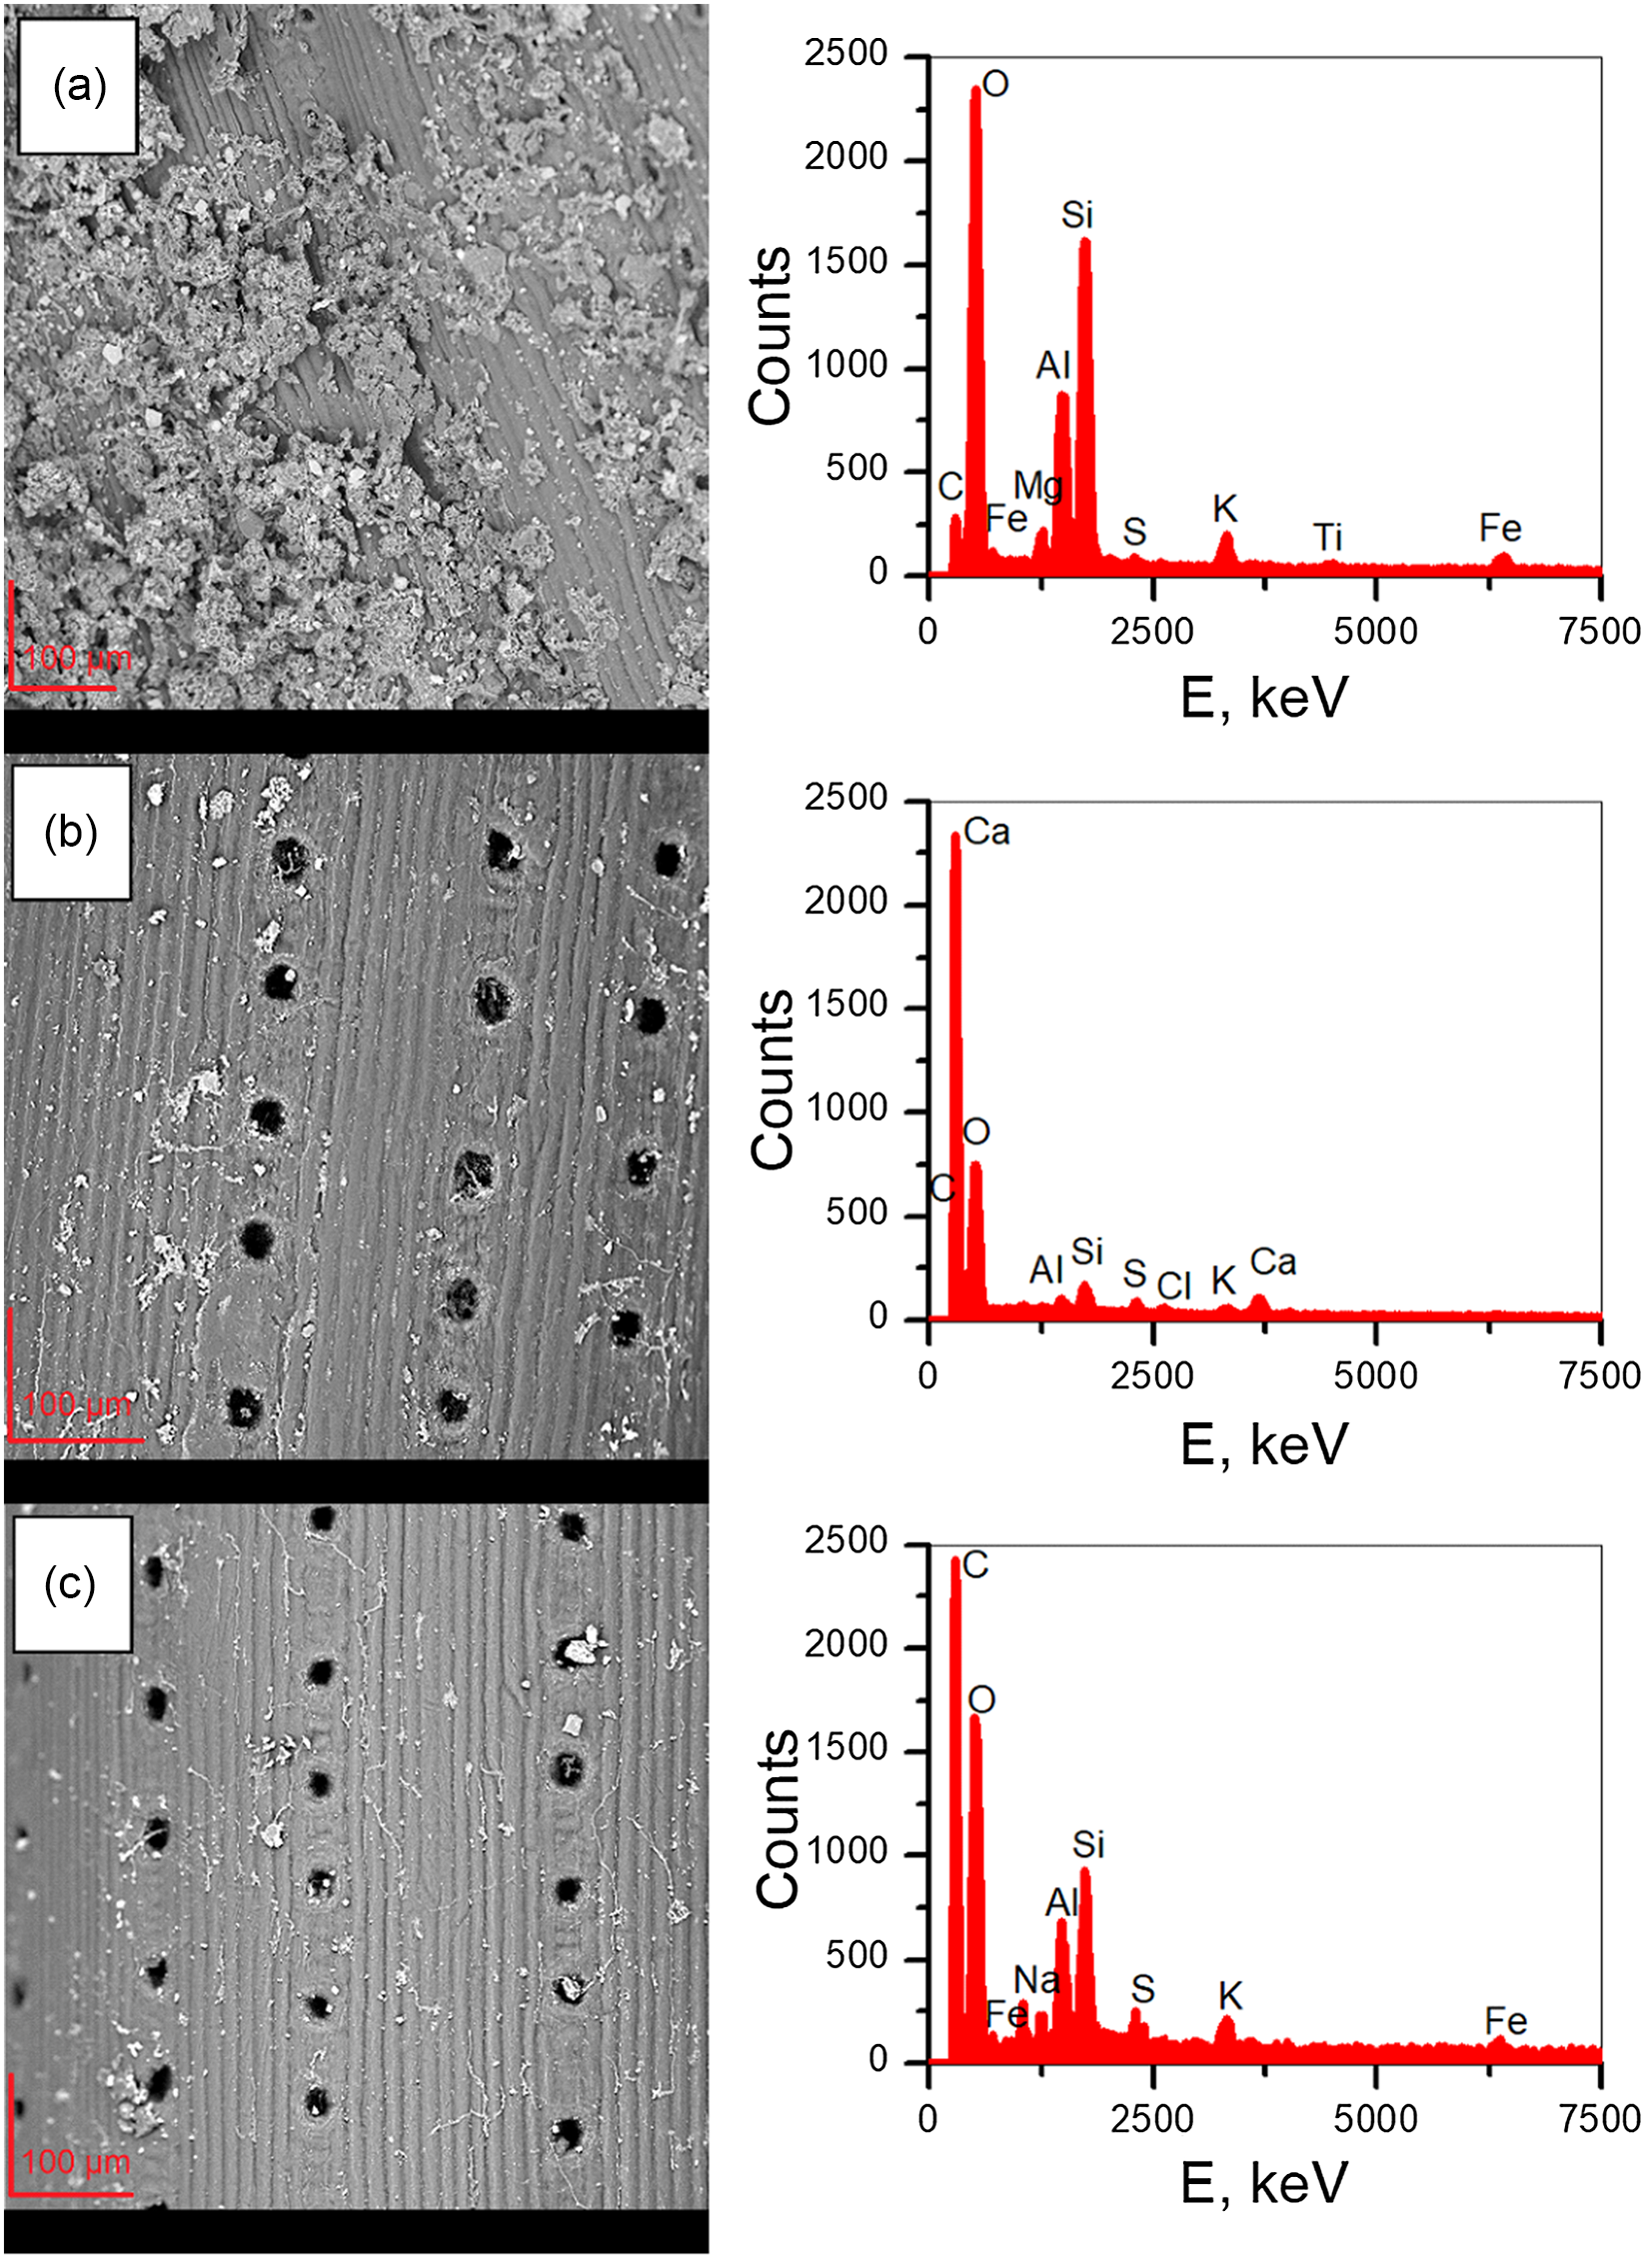
Figure 3 SEM micrographs and EDS spectra of pine needles obtained in 2019 from the S4 site, which was the most polluted (a), and those of the less-contaminated site S7 grown in 2019 (b) and 2020 (c). The peaks of specific elements are indicated.
The ratio of the polluted surface (R P) calculated for each sampling site is presented in Table 3. The area of pine needles obtained from the S7 reference site wascovered in the least. A comparison of the values obtained as a function of the radial distance from HPP Łaziska shows that the most polluted sites were located within 15 km of it (sites S4–S6), whereas areas further away were less contaminated (sites S1–S3). This effect is due to the height of the power plant chimney (162 m), so the pollutants travelled several kilometers in the air before depositing on the earth’s surface, i.e., on pine leaves. Moreover, the contaminated sites were located southeast of the facility, which is consistent with the wind direction in southern Poland, which usually heads southwest in winter; therefore, this facility is one of the main pollutant sources in the examined area.
Table 3 The ratio of the coated leaf area of pine needles grown in 2019 for each sampling site and those from the reference site (S7) collected in 2020.

The qualitative and quantitative analysis of pollutants deposited on pine leaves was performed by using EDS. Figure 4 presents the elements recorded on the needle surface. Carbon and oxygen were not taken into consideration because it was not possible to determine whether the signals originated from cellulose or contaminants. Due to the EDS technique limitations, the contaminants with a contribution greater than 10% were recorded.
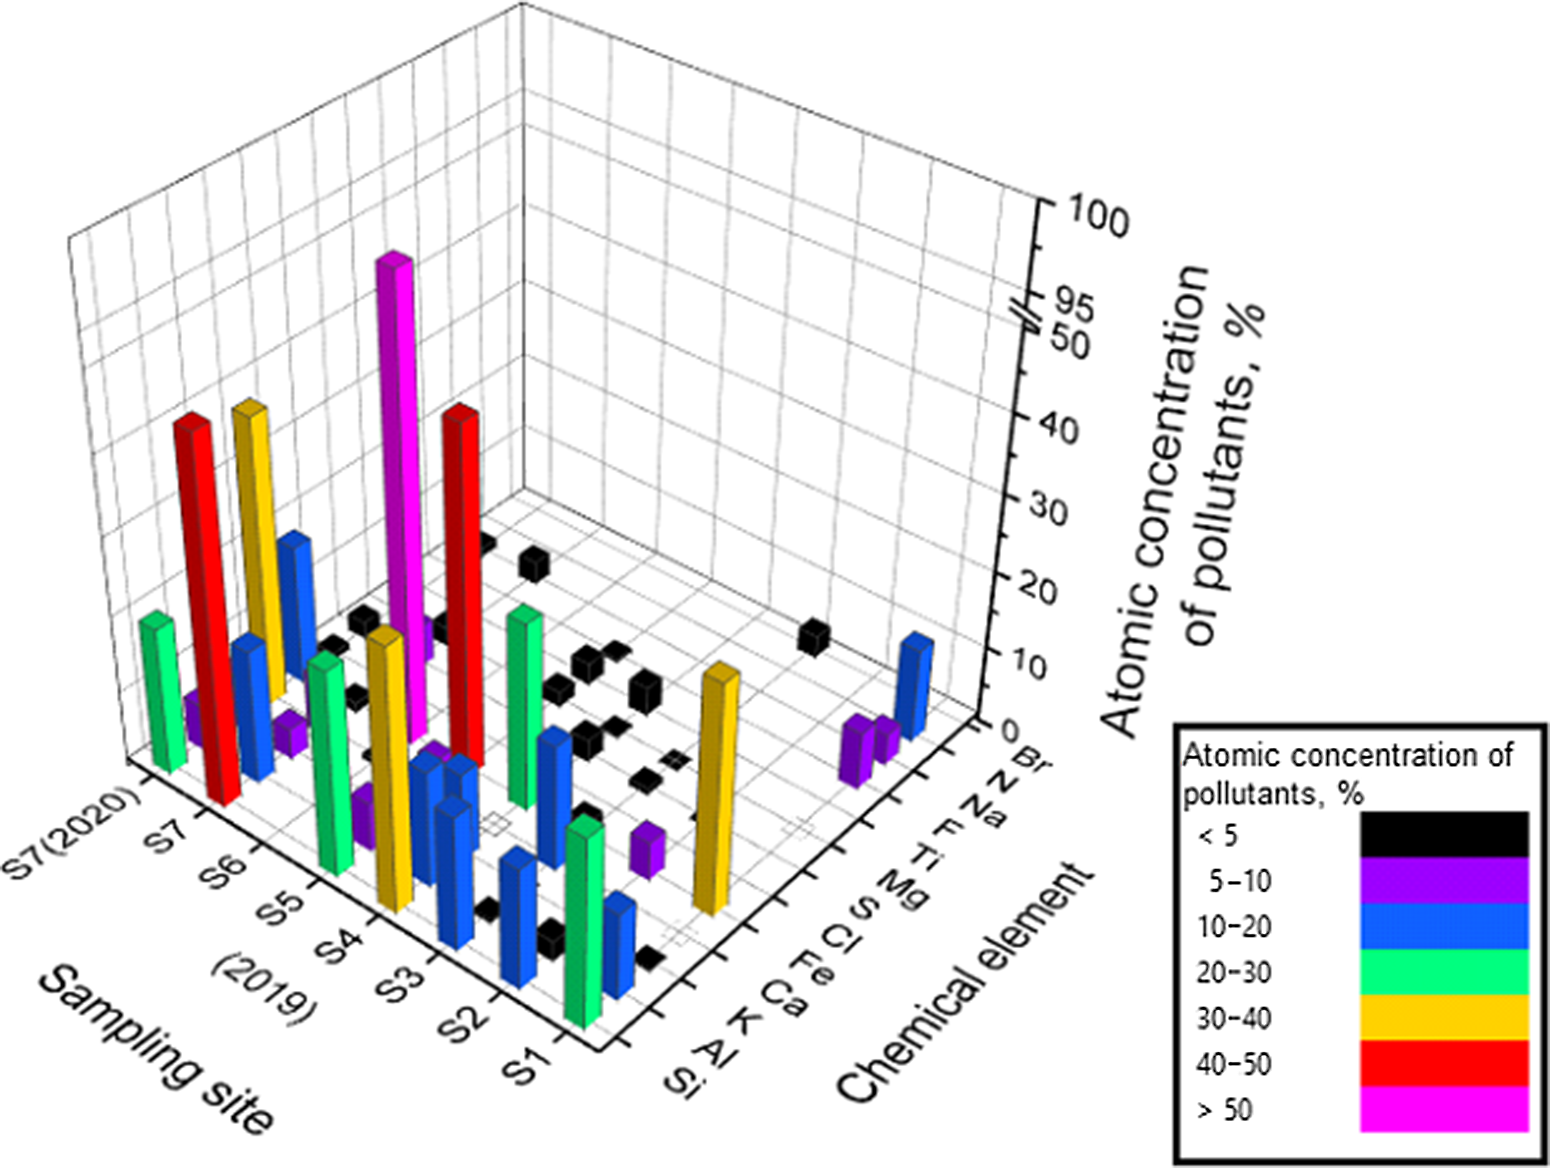
Figure 4 Atomic concentration of pollutants registered on the surface of Pinus Sylvestris L. needles grown in 2019 in selected sites and 2020 for the S7 reference site.
A significant amount of silicon was present in almost every sample, which may come from sand grains. N and S are also common pollutants, which probably come from their oxides. Ca, Fe, Al, and K elements were also present in most samples. Mg, N, and Ti (Figure 4) are also often deposited, but in much lower concentrations. Heavier elements such as Fe and Ti were present in higher concentrations in needles obtained from sites nearer to the heat and power plant in Łaziska Górne (S4–S6) than those obtained further from it (S1–S3). The weather conditions may influence the pollutants’ concentration—rain or snow may rinse them off, but this impact should be similar for every site because of the long exposure time and nearly uniform weather conditions in the sampling area. For clarification, Table 4 presents the main elements in the pollutants determined from the EDS spectra.
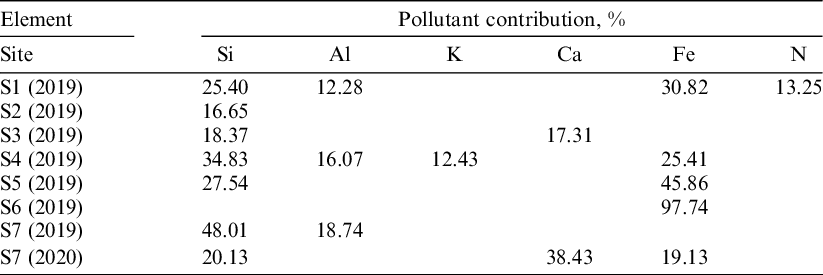
Table 4 Elements recorded on the surface of pine needles obtained from selected sites with an atomic concentration of pollutants greater than 10%.
Site S4 was also examined in our previous studies (Sensuła and Toroń Reference Sensuła and Toroń2019; Sensuła et al. Reference Sensuła, Toroń and Piotrowska2019, Reference Sensuła, Wilczyński, Toroń and Piotrowska2020), which presented the elements deposited on pine needles in 2012 and 2013. Comparing these results shows that this site was more contaminated in previous years. Si, Al, K, Fe, S, Mg, and Ti were detected in this study on the needle surfaces grown in 2019, while Ca, Cl, and N were also present in needles grown in 2012 and 2013. This may be because of the Covid-19 pandemic, during which a lockdown was implemented in almost all countries around the globe, which reduced the activity of pollutant-producing sources such as factories, heat and power plants, and traffic (Gope et al. Reference Gope, Dawn and Das2021). For site S4, significant amounts of Al, Si, and K were found each sampled year, which indicates that these elements were present throughout the entire examined period. The estimated data are in good agreement with coal consumption and CO2 emission by the power plant in Laziska obtained upon request from the Tauron company, which is the power plant owner and main power supplier in Poland. The coal consumption in the power plant was 1.536 Tg in 2019 and decreased to 0.888 Tg in 2020, while CO2 emission was 3.027 Tg in 2019, and 1.774 Tg in 2020, respectively. The power plant in Łaziska is pure coal, however, one can keep in mind that the coal may be contaminated by some other chemical elements arising from mining and processing processes. Therefore, the proportional decrease of other pollutants may be expected.
High concentrations of As, Cu, Mn, Ni, Pb, Rb, and Sr were found on the surfaces of pine needles grown near an industrial complex and two urban parks in South Korea. The concentration of pollutants in some European countries has been established in several papers. The determination of sulfur and heavy metals in Pinus Sylvestris L. needles was studied in northern Finland in the Kemi neighborhood situated on the Gulf of Bothnia (Pöykiö and Torvela Reference Pöykiö and Torvela2001). A paper industry complex is situated in the center of the examined area. It was stated there that pine leaves are suitable as bioindicators, especially for sulfur pollutants. In our samples, no significant amounts of sulfur were discovered. Several pine species, i.e., Pinus densiflora Siebold et Zucc., Pinus nigra Arnold, Pinus sylvestris L., and Pinus thunbergiana Franco were examined. The needles were collected from the Lisičine Arboretum, Croatia in 2012 (Juranović Cindrić et al. Reference Juranović Cindrić, Zeiner, Starčević and Stingeder2019). The authors examined 23 metals (Al, As, B, Ba, Ca, Cd, Co, Cu, Cr, Fe, K, Li, Mg, Mn, Mo, Na, Ni, Pb, Se, Sr, and Zn) using spectrometric detection methods. Al, Ca, Fe, K, Mg, and Mn were detected in the highest amounts, and other metals were only present in trace amounts. Similar elements were detected by EDS on the pine needle surfaces in our studies.
It is valuable to compare identified elements found in our studies with the pollutants in other parts of Poland found by other researchers. Szwed et al. (Reference Szwed, Żukowski and Kozłowski2021) studied Pinus sylvestris L. needles grown in the southwestern part of the Świętokrzyskie Mountains in the Białe Zagłębie region, Poland near a cement plant. They detected several metals using EDS, whose descending concentration was as follows: Al, Fe, Mg, Zn, Sr, Pb, Mn, Ni, Cr, Cu, Co, and Cd. Al and Fe were also found in our samples. In other studies (Parzych and Jonczak Reference Parzych and Jonczak2014), the Zn, Mn, and Pb were detected on Pinus sylvestris L. needles collected in the city of Słupsk in northern Poland.
No heavy metals and a scant amount of sulfur were detected in our research, in contradiction to cited works. This allows us to state that the attachment of chimney filters likely reduces environmental pollution in the industrialized Silesia region.
CONCLUSIONS
The main aim of this article is to present the results of the analysis of the components deposited on Pinus sylvestris L. needles, which were exposed to air contaminants and radiocarbon concentration in 2-years old needles. Sampling sites were chosen at a different distance from HPP Łaziska—the primary polluter in the neighborhood. In 2021, in most of the investigated pines, the radiocarbon concentration was at a similar level, only in one location a significantly lower value of Δ14C (–30‰) was observed only in one location (Lędziny II), whereas a slightly higher 14C concentration in pines relative to the 14C concentration of clean air (14CNH1) was observed only in one site (Gliwice). It can be due to different local sources nad origins of carbon dioxide. The median of 14S value in the investigated area is ca. 1.2%. Comparing radiocarbon concentration in 1-year-old and 2-year-old pine needles growing in the same sampling sites it has been observed that Δ14C in the 2-year-old needles (which began growing in 2019) was lower than that of the one-year-old needles (which began growing in 2020). This effect was expected due to a decrease in 14CNH1 and CO2 exchange between different reservoirs of the Earth’s carbon cycle. It was found that the most polluted sites were located within 15 km of it, whereas areas further away were less contaminated. N, S, Ca, Fe, Al, and K were commonly detected. Fe and Ti were also present in the samples collected from sites nearer to the HPP Łaziska. The impact of the Covid-19 pandemic and implemented lockdown is also visible. The decrease in coal consumption in 2020 by about 50% compared to 2019 resulted in lower pollution. No heavy metals and a scant amount of sulfur were detected in our research, which emphasizes the importance of chimney filters in reducing the environmental pollution.
ACKNOWLEDGMENTS
This study was a part of the Project-Based Learning “Applied Physics and ArcGIS technology in the Environmental Research: Air pollutants deposition on the foliage – a case study of biomonitoring of the industrial area (acronym: DEPON)” (PI Barbara Sensuła, Team Leader: Agnieszka Sasiela). The study was co-funded by the Silesian University of Technology (Gliwice, Poland) the Rector’s Pro-Quality Grant Program for Groundbreaking Research grants number 14/990/RGJ20/0133. The authors express their sincere gratitude to everyone who contributed to this study, particularly the staff of the Silesian University of Technology. The authors would like to acknowledge the Tauron personnel, especially Mr. Bolesław Kardoliński and Mr. Wojciech Kocząb, for disclosing the data on coal consumption and CO2 emission in the Laziska power plant.


