Significant outcomes
∙ Morphological alternation of myelin oligodendrocyte glycoprotein (MOG) was detected neuropathologically in the brain tissue of schizophrenia patients with a long duration of illness.
∙ Myelin-oligodendrocyte abnormalities might be related to the progressive pathophysiology of schizophrenia.
Limitations
∙ We focused only on the inferior region of the superior temporal gyrus (STG) and CA3 of the hippocampus.
∙ Postmortem human brain tissue may be affected by various events throughout the patient’s lifetime that might hamper an accurate neuropathological observation.
Introduction
The aetiology of schizophrenia has been unclear despite intensive investigations. However, it has been shown in recent neuroimaging and molecular biological studies that schizophrenia is a disease arising from abnormal neural communication (Reference Bernstein, Steiner, Guest, Dobrowolny and Bogerts1–Reference Rubinov and Bullmore3). Dysfunction of myelin-oligodendrocytes has been hypothesised to underlie the pathophysiology of this abnormal neural communication in schizophrenia patients. Myelin-oligodendrocytes are the predominant constituents of white matter (WM) and play an important role in neural transmission under schizophrenic conditions (Reference Chew, Fusar-Poli and Schmitz4,Reference Nave and Ehrenreich5). This hypothesis was initially supported by a series of postmortem brain studies, neuroimaging studies and genetic evidence (Reference Ren, Wang and Xiao6). Recent diffusion tensor imaging studies have repeatedly reported WM abnormalities in schizophrenia patients based on decreases in anisotropy indices in the WM tracts and structures (Reference Hubl, Koenig, Strik, Federspiel, Kreis, Boesch, Maier, Schroth, Lovblad and Dierks7,Reference Wang, Sun, Cui, Du, Wang, Zhang, Cong, Hong and Zhang8). Furthermore, studies based on genome analyses have also repeatedly reported mutations of myelin-oligodendrocyte-related genes in schizophrenia patients (Reference Ayalew, Le-Niculescu, Levey, Jain, Changala, Patel, Winiger, Breier, Shekhar, Amdur, Koller, Nurnberger, Corvin and Geyer9). Postmortem studies of brains with this disease have demonstrated the decreased gene expression of myelin-oligodendrocyte-related proteins (e.g. MOG, CNP, MAG, PLP1, ERBB3) (Reference Peirce, Bray, Williams, Norton, Moskvina, Preece, Haroutunian, Buxbaum, Owen and O'Donovan10,Reference Tkachev, Mimmack, Ryan, Wayland, Freeman, Jones, Starkey, Webster, Yolken and Bahn11). These findings by neuroimaging and genetic studies have indicated myelin-oligodendrocyte dysfunction in this disease. However, the altered morphology of myelin-oligodendrocyte has not been unequivocally confirmed by direct observation of the brain tissue by microscopy. Therefore, it is important to examine the neuropathological appearance of those myelin-oligodendrocyte-related proteins in the postmortem brain tissues of schizophrenia patients.
With regard to oligodendrocytes, neuropathological abnormalities in oligodendrocytes have been reported not only in the WM but also in the cortex (Reference Vostrikov, Uranova and Orlovskaya12). However, the neuropathological appearance of myelin in the postmortem brain tissues of schizophrenia patients has not yet been examined in detail. MOG is a specific component of the central nervous system localised on the outermost lamellae of mature myelin (Reference Pham-Dinh, Della Gaspera, Kerlero de Rosbo and Dautigny13) and its gene may be involved in the development of schizophrenia (Reference Tkachev, Mimmack, Ryan, Wayland, Freeman, Jones, Starkey, Webster, Yolken and Bahn11,Reference Liu, Qin, He, Yang, Chen, Zhou, Li, Gu, Xu, Feng, Sang, Hao, Zhang and Wang14).
The superior temporal gyrus (STG) and hippocampus are regions of interest for the aetiology of schizophrenia. The STG is involved in auditory processing, including language, but it has also been implicated as a critical structure in social cognition (Reference Bigler, Mortensen, Neeley, Ozonoff, Krasny, Johnson, Lu, Provencal, McMahon and Lainhart15,Reference Jou, Minshew, Keshavan, Vitale and Hardan16). Neuroimaging studies have found that patients with schizophrenia have structural abnormalities in their STG (Reference Kasai, Shenton, Salisbury, Hirayasu, Lee, Ciszewski, Yurgelun-Todd, Kikinis, Jolesz and McCarley17,Reference Lee, Yoshida, Kubicki, Bouix, Westin, Kindlmann, Niznikiewicz, Cohen, McCarley and Shenton18). We have also confirmed the morphological changes in the STG in schizophrenia patients using postmortem brain tissue (Reference Torii, Iritani, Sekiguchi, Habuchi, Hagikura, Arai, Ikeda, Akiyama and Ozaki19). In the neocortex of the STG, layer III is especially important for schizophrenia. The mean pyramidal neuron somal volume and the densities of markers of axon boutons and dendritic spines were reported to be reduced in layer III of the STG (Reference Sweet, Bergen, Sun, Marcsisin, Sampson and Lewis20–Reference Sweet, Henteleff, Zhang, Sampson and Lewis22). The hippocampus is one of the most intensively studied regions of the brain (Reference Bakhshi and Chance23), and CA3, a subfield in the hippocampus, is hypothesised to be involved in abnormal neural connectivity within the hippocampus in schizophrenia patients (Reference Tamminga, Stan and Wagner24). Progressive morphological changes in the hippocampus (Reference Murakami, Takao, Abe, Yamasue, Sasaki, Gonoi, Takano, Takei, Kasai and Ohtomo25) and STG (Reference Crespo-Facorro, Kim, Chemerinski, Magnotta, Andreasen and Nopoulos26) have also been shown to correlate with the illness duration (Reference Bakhshi and Chance23).
Aims of the study
We neuropathologically compared the appearance of MOG in the STG and CA3 in the hippocampus of schizophrenia patients with the findings in control patients to clarify the myelin-oligodendrocyte dysfunction in schizophrenia patients with particular focus on the effects of the duration of illness on MOG appearance.
Materials and methods
Subjects
Brain specimens from 10 schizophrenia patients and nine age- and sex-matched normal control subjects among autopsy cases at Tokyo Metropolitan Matsuzawa Hospital were used for this study. The demographic details of the subjects are summarised in Table 1. Patients with ≥30 years of illness were defined as long-term schizophrenia patients. Control subjects were adjusted to match the long-term schizophrenia with regard to age at death (Table 2).
Table 1 Basic demographic characteristics of the subjects
GAF, Global Assessment of Functioning; PMI, postmortem interval; SD, standard deviation (mean±SD).
There were no significant differences between the control and schizophrenic subjects.
* Not known for two schizophrenic subjects.
† Not known for one schizophrenic subject.
‡ Lifetime antipsychotic dosage are represented as Chlorpromazine-equivalent dose (g).
Table 2 Basic demographic characteristics of long-term schizophrenic subjects and age-matched controls

GAF, Global Assessment of Functioning; PMI, postmortem interval; SD, standard deviation (mean±SD).
There were no significant differences between the age-matched control and long-term schizophrenic subjects.
* Not known for two schizophrenic subjects.
† Not known for one schizophrenic subject.
‡ Lifetime antipsychotic dosage are represented as Chlorpromazine-equivalent dose (g).
We confirmed the diagnosis by reviewing the clinical records to verify that the cases satisfied the DSM-IV-TR criteria for schizophrenia and that the control subjects had no evidence of psychiatric or neurological disorders. We also excluded cases with neuropathological changes, such as neurodegenerative disorders (e.g. Alzheimer-type dementia, frontotemporal lobar degeneration, etc.), cerebrovascular diseases, brain invasion of tumours, severe malnutrition, metabolic encephalopathies and inflammatory or traumatic processes based on the records of clinico-pathological conferences with several expert neuropathologists. We additionally excluded any cases with a history of alcohol or substance abuse or convulsions that might affect neuropathological changes, based on the patients’ clinical records. We confirmed that all cases had a sufficient social function before onset and had completed compulsory education.
We assessed the subtype of schizophrenia using the DSM-IV-TR criteria. We assessed the clinical severity in the predominant state using the Global Assessment of Functioning (GAF) scale. We measured the total dosage of antipsychotic medication taken throughout the lifetime (lifetime antipsychotic dosage) by reviewing the clinical records.
This study was approved by the Nagoya University School of Medicine Ethical Review Board.
Brain tissue processing
In all cases, the cadavers were kept at 4°C before autopsies. All brains were extracted and fixed in 10% formalin within 48 h after death. After fixation, the brains were sectioned in the coronal plane. The brains were embedded in paraffin and cut at a thickness of 10 μm. We used each left coronal section at the level where the hippocampus, the STG and the inferior parietal lobule (IPL) were involved.
Immunohistochemistry
The prepared sections were deparaffinised in xylene and rehydrated through an ethanol gradient. Endogenous peroxidase activity was blocked with 0.3% (v/v) H2O2/methanol. Sections were then incubated with primary antibody against MOG (rabbit polyclonal, 1 : 1000; Sigma Aldrich, St. Louis, MO, USA) at 4°C overnight. After rinsing, the sections were subjected to either a streptavidin–biotin complex or an enhanced indirect immunoperoxidase method using Envision (DakoCytomation, Glostrup, Denmark). Immunoreactivity was detected using 3,3'-diaminobenzidine, and sections were counterstained with haematoxylin.
Image acquisition and morphometric analysis
Equipment and software programs
The photographs were downloaded to a PC from a digital camera (DP72; Olympus Co., Tokyo, Japan) as digital data. A morphometrical analysis was performed using the Adobe Photoshop 6.0 (Adobe Systems Inc., San Jose, CA, USA) and ImageJ 1.43u (free software developed by the NIH: http://rsb. info.nih.gov/ij/) software programs by one of the coauthors blinded to the diagnosis.
STG
The middle areas of the inferior region of the STG were observed (Fig. 1a). At 100× magnification, we investigated the distribution of MOG in the cortex as follows: We randomly placed a column of the neocortex 424-μm wide (from layers I to VI) (Fig. 1c). The column of the neocortex was vertically divided into three equal parts: the upper layer, the middle layer and the lower layer (Fig. 1c). The cytoarchitecture (i.e. a six-layer cortical structure) is assumed to be altered or disorganised in the cortex of the schizophrenic brain (Reference Harrison27). Therefore, in this study, we considered it best to estimate the distribution of the MOG in the neocortex of the STG based on equal partitions of the neocortex independent of the anatomical cortical structure with the six layers. After we removed haematoxylin dye from the image of the STG using the colour deconvolution plugin (http://www.mecourse.com/landinig/software/cdeconv/cdeconv.html) (Fig. 2a-i, ii), in two columns per case, we measured the total area of the MOG-positive structures via certain intensity (pixel value: 0–210) staining with anti-MOG antibody in each layer to determine the expression of MOG in each layer (Figs. 2a-iii). The ratio of the expression of MOG in each layer was calculated as follows: [(expression area of MOG in each layer)/(expression area of MOG in the whole layer)].
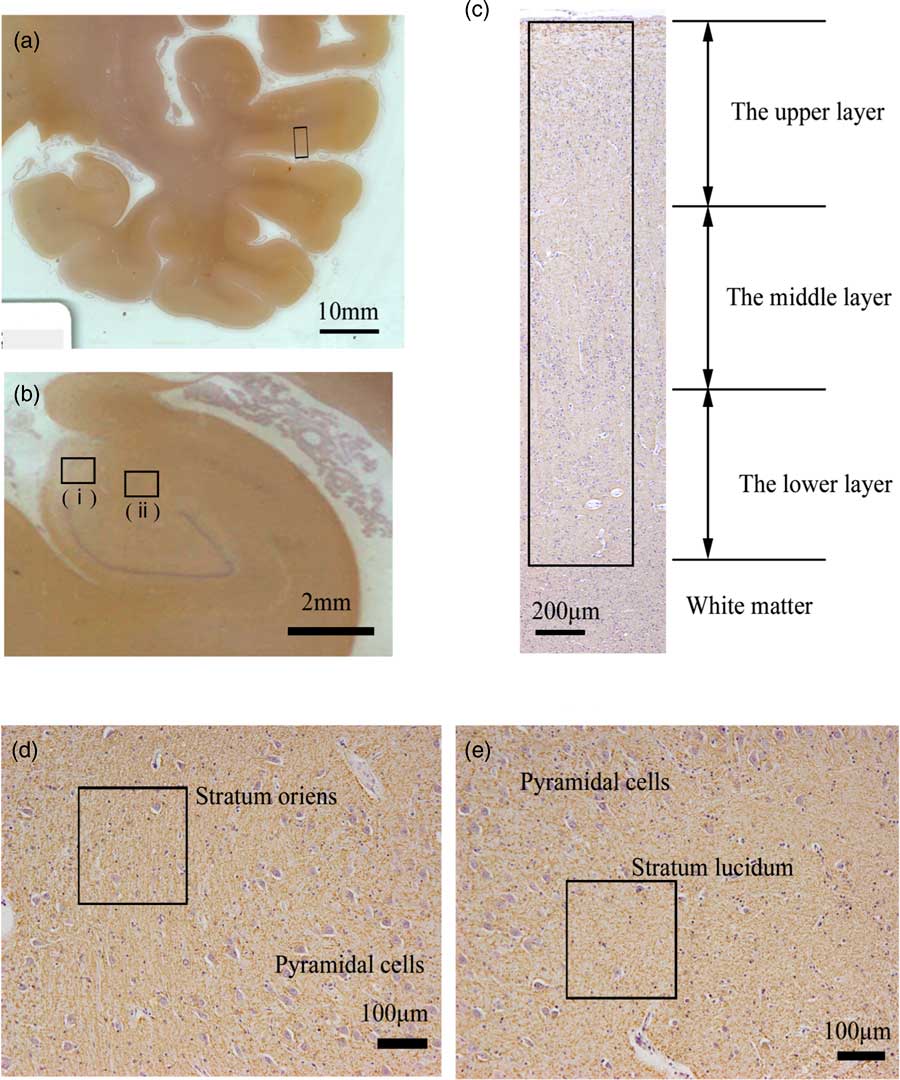
Fig. 1 Areas examined in the superior temporal gyrus (STG) and the hippocampus of postmortem brains. (a) Left coronal section of temporal lobe stained with anti-myelin oligodendrocyte glycoprotein antibody (MOG). The middle areas of the inferior region of the STG (box) were examined. (b) Left coronal section of hippocampus stained with anti-MOG antibody. The stratum oriens (i) and stratum lucidum (ii) of CA3 in the hippocampus were examined. (c) The neocortex of the middle areas of the inferior region in the STG stained with anti-MOG antibody. We randomly placed the 424-μm-wide column (box) in the neocortex (from layers I to VI). The columns are vertically divided into three equal parts: the upper, the middle and the lower layer. (d) Stratum oriens of CA3 in the hippocampus stained with anti-MOG antibody. We randomly placed 212-μm-square regions of interest (box). (e) Stratum lucidum of CA3 in the hippocampus stained with anti-MOG antibody. We randomly placed 212-μm-square regions of interest (box).
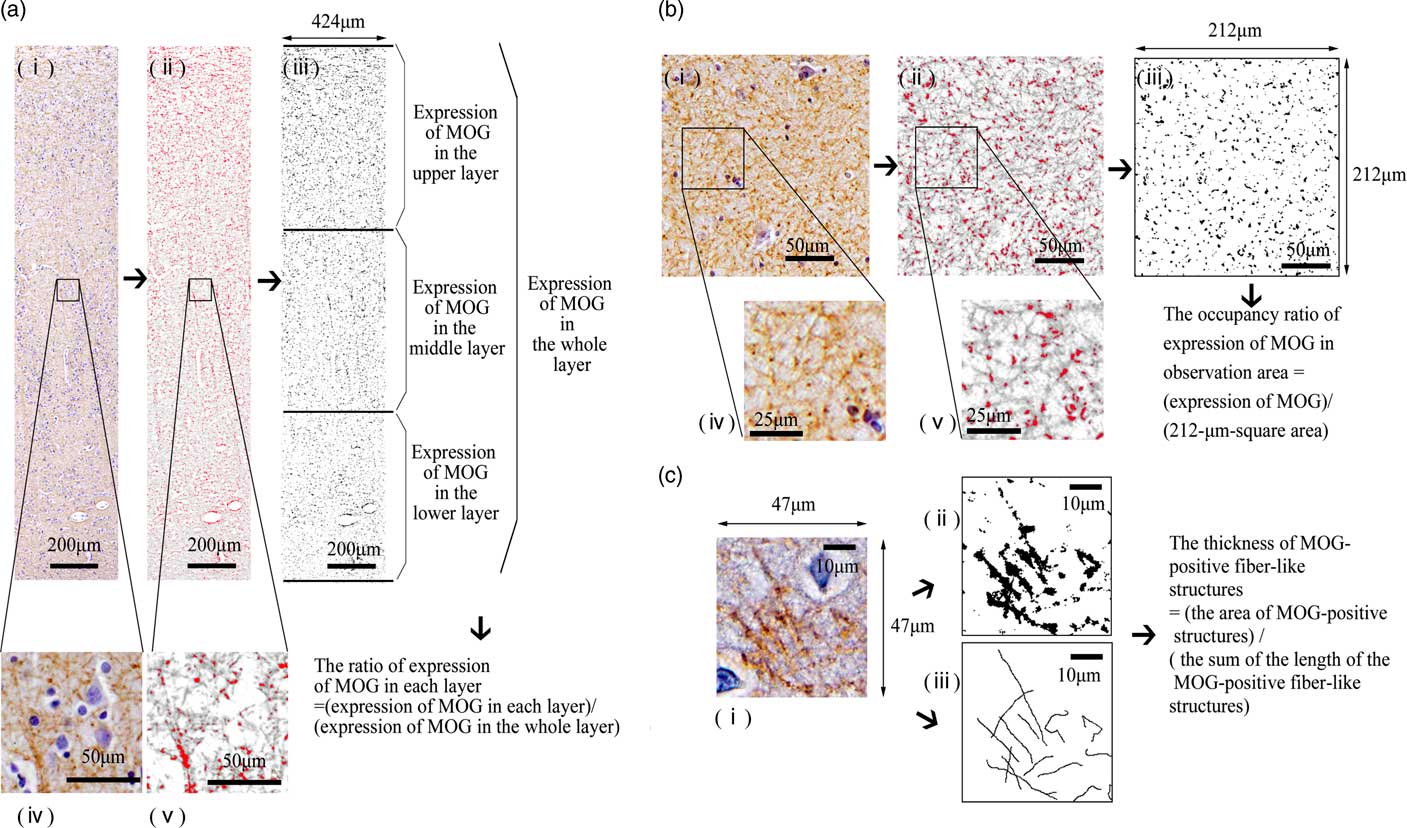
Fig. 2 A morphometric analysis of myelin oligodendrocyte glycoprotein (MOG) in each observation area. (a) A morphometric analysis of MOG in the superior temporal gyrus (STG). From the observation area (424-μm-wide column) of the image of the STG (i, iv), we removed haematoxylin dye (ii, v) using the ImageJ software program. We measured the total area of the MOG-positive structures via certain intensity (pixel value: 0–210) staining with anti-MOG antibody [red area in (ii) and (v), black area in (iii)] in each layer to determine the expression of MOG in each layer (iii). We calculated the ratio of expression of MOG in each layer to investigate the distribution of MOG. (b) A morphometric analysis of MOG in the CA3 of the hippocampus. From the image of observation area (212-μm-square area) of the CA3 (i, iv), we removed haematoxylin dye (ii, v) using the ImageJ software program. We measured the total area of the MOG-positive structures via certain intensity (pixel value: 0–210) staining with anti-MOG antibody [red area in (ii) and (v), black area in (iii)] in the 212-μm-square area to determine the expression of MOG in the CA3. We calculated the occupancy ratio of expression of MOG. (c) Measurement of the thickness of MOG-positive fibre-like structures in the observation area. In 47-μm-square areas of layer III of the neocortex in the STG (i) and stratum lucidum stained with anti-MOG antibody, we extracted the MOG-positive fibre-like structures using the ImageJ software program. The sum of the length of the MOG-positive fibre-like structures and the area of the MOG-positive structures (pixel value: 0–210) was determined (ii, iii). We calculated the thickness of MOG-positive fibre-like structures.
We next investigated the pathological changes reflecting altered distribution with greater magnification (200×). In two randomly placed 47-μm-square areas of layer III of each case (Figs. 2c-i), we extracted the MOG-positive fibre-like structures using ImageJ, based on line continuity. We traced the MOG-positive fibres manually. The sum of the length of the MOG-positive fibre-like structures and the area of the MOG-positive structures (pixel value: 0–210) was determined (Figs. 2c-iii, ii). To statistically investigate the morphological differences of myelination, we defined and calculated the thickness of MOG-positive fibre-like structures as follows: the area of MOG-positive structures/the sum of the length of MOG-positive fibre-like structures.
We also observed the IPL using the same procedure to determine whether or not the changes were region-specific in schizophrenic postmortem brains.
Hippocampus
We used specimens in which CA3 could be clearly differentiated for the morphometric analysis (Fig. 1b). At 100× magnification, in the five randomly placed 212-μm-square areas of the stratum oriens and the stratum lucidum of the CA3 of each case (Figs. 1d, e), we measured the total area of MOG-positive structures via certain intensity (pixel value: 0–210) staining with anti-MOG antibody to determine the expression of MOG and calculated the occupancy ratio of expression of MOG (Fig. 2b). At 200× magnification, using the same methods as in the STG, the thickness of MOG-positive fibre-like structures was calculated.
Statistical analyses
For the statistical analyses, we performed nonparametric tests because of our small sample size. We used the Mann–Whitney U test to assess the differences in the brain weights, postmortem interval (PMI) and age at death between the diagnostic groups. We used Fisher’s exact test to assess the differences in sex and causes of death between the diagnostic groups. To assess the expression of MOG, we used the Mann–Whitney U test between the diagnostic groups. We used Spearman’s rank correlation to assess how age at onset, PMI, duration of illness, brain weight, GAF scores or lifetime antipsychotic dosage affect the appearance of MOG. A value of p<0.05 was considered to be statistically significant. All statistical analyses were performed using the SPSS Statistics 17.0 software program (SPSS Inc., Chicago, IL, USA).
Results
Basic demographic data
There were no significant differences in the sex, cause of death, brain weight, PMI or age at death between the control and schizophrenia patients (Tables 1, 2).
MOG in the neocortex of the STG
MOG-positive structures were observed in all layers of the neocortex of the STG. Those via certain intensity (pixel value: 0–210) were detected as intensely positive structures in myelin (Fig. 2a-iv, v). In the control group, MOG was observed most abundantly in the middle layer followed by the lower layer. In contrast, in the schizophrenic group, MOG was observed most abundantly in the lower layer followed by the middle layer (total patients; Fig. 3a). However, there were no statistically significant differences in the distribution between the control and schizophrenic groups (Table 3). In the long-term schizophrenic group, MOG was also observed most abundantly in the lower layer followed by the middle layer. Furthermore, the ratio of expression of MOG in the middle layer was significantly smaller in the long-term schizophrenic group than in the age-matched controls (p=0.03; Table 3). In the neocortex of the IPL, there were no significant differences in the distribution between the control and schizophrenic groups or between the long-term schizophrenic groups and controls.
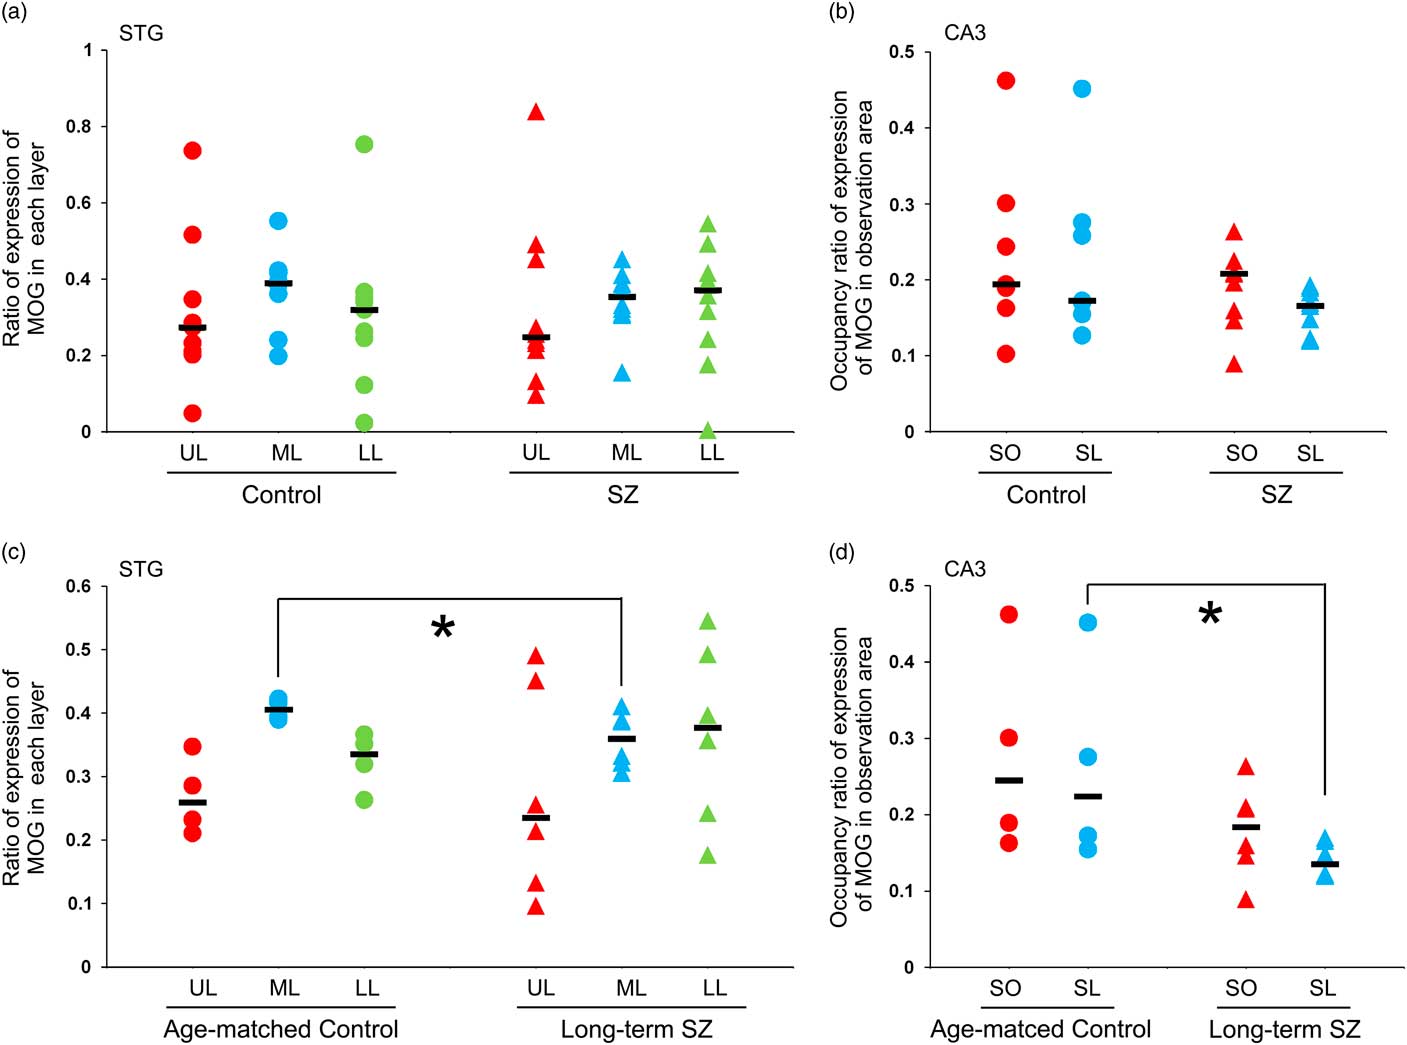
Fig. 3 The expression of myelin oligodendrocyte glycoprotein (MOG) in the neocortex of the superior temporal gyrus (STG) and the CA3 of the hippocampus. (a) The ratio of expression of MOG in each layer of the STG in schizophrenic and control subjects. (b) The occupancy ratio of expression of MOG in the CA3 in schizophrenic and control subjects. (c) The ratio of expression of MOG in each layer of the STG in the long-term schizophrenic and age-matched control subjects. The ratio of expression of MOG in the middle layer was significantly smaller in the long-term schizophrenic group than in the age-matched controls. (d) The occupancy ratio of expression of MOG in the CA3 in the long-term schizophrenic and age-matched control subjects. The occupancy ratio of expression of MOG in the stratum lucidum was significantly smaller in the long-term schizophrenic group than in the age-matched controls. The horizontal black lines indicate the median value. *p<0.05. LL, lower layer; ML, middle layer; SL, stratum lucidum; SO, stratum oriens; SZ, schizophrenia; UL, upper layer.
Table 3 The expression of myelin oligodendrocyte glycoprotein (MOG) in the superior temporal gyrus (STG), inferior parietal lobule (IPL) and CA3 of hippocampus
QD, quartile deviation median ± QD.
* Not known for two subjects.
† Not known for one subject.
The middle layer was mainly equivalent to layers III and IV. At higher magnification, MOG via certain intensity (pixel value: 0–210) was observed as the myelin sheath, as distinguished from background (Figs. 2c-i, ii). The thickness of MOG-positive fibre-like structures, determined as ‘the area of MOG-positive structures/the sum of the length of MOG-positive fibre-like structures’, was significantly smaller in layer III in the long-term schizophrenic group than in the age-matched controls (p=0.011; Fig. 4a).
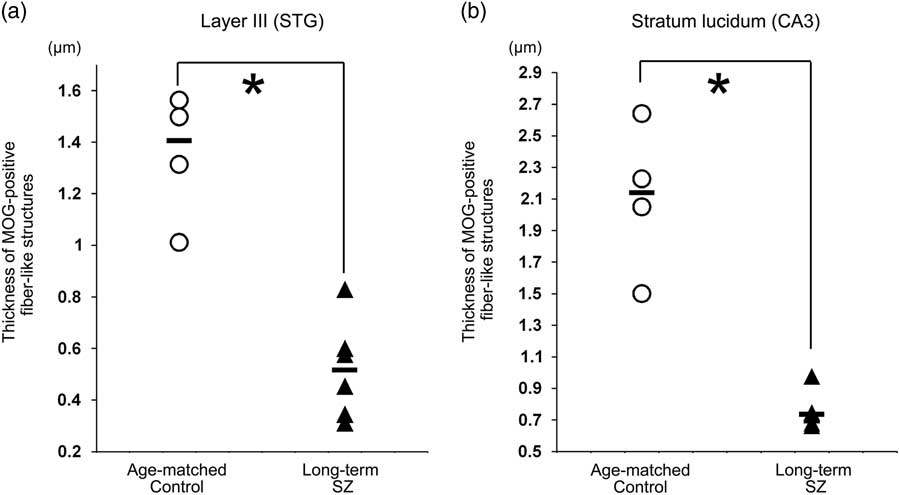
Fig. 4 The thickness of myelin oligodendrocyte glycoprotein (MOG)-positive fibre-like structures. (a) The thickness of MOG-positive fibre-like structures in layer III of the neocortex in the superior temporal gyrus (STG) in long-term schizophrenic subjects and age-matched control subjects. The thickness of MOG-positive fibre-like structures was significantly smaller in layer III of the long-term schizophrenic group than in the age-matched controls. (b) The thickness of MOG-positive fibre-like structures in the stratum lucidum of the CA3 in long-term schizophrenic subjects and age-matched control subjects. The thickness of MOG-positive fibre-like structures was significantly smaller in the stratum lucidum of the long-term schizophrenic group than in the age-matched controls. The horizontal black lines indicate the median value. *p<0.05. SZ, schizophrenia.
MOG in CA3 of the hippocampus
MOG-positive structures via certain intensity (pixel value: 0–210) were detected as intensely positive structures of myelin in CA3 of hippocampus (Figs. 2b-iv, v). There were no significant differences in the occupancy ratio of expression of MOG in both the stratum oriens and the stratum lucidum between the schizophrenic and control group (Table 3; Fig. 3b). However, the occupancy ratio of expression of MOG in the stratum lucidum was significantly smaller in the long-term schizophrenic group than in the age-matched controls (p=0.03) (Table 3; Fig. 3d).
The thickness of MOG-positive fibre-like structures was significantly smaller in the stratum lucidum of the long-term schizophrenic group than in the age-matched controls (p=0.011; Fig. 4b).
Correlation analysis using clinical profile data
The age at death, PMI, duration of illness, brain weight and lifetime antipsychotic dosage were not correlated with the ratio of expression of MOG in the STG or the occupancy ratio of expression of MOG in the CA3. The GAF scores were positively correlated with the occupancy ratio of expression of MOG in the stratum lucidum of the CA3 (r=0.89, p=0.001). However, the GAF scores were not correlated with the ratio of expression of MOG of the STG and the occupancy ratio of expression of MOG in the stratum oriens of the CA3.
Discussion
MOG in the STG in schizophrenia patients
In this study, we observed a significant reduction in the distribution of MOG (i.e. the ratio of expression of MOG) in the middle layers of the neocortex of the STG in the long-term schizophrenia patients in comparison with age-matched controls. The cytoarchitecture (i.e. six-layer cortical structure) is assumed to be altered or disorganised in the cortex of the schizophrenic brain. Although the change in the distribution of MOG in our study may be implicated in the cytoarchitectural abnormalities reported in schizophrenia patients (Reference Harrison27), this finding might also be associated with the dysfunction of the myelin-oligodendrocytes in this region as the abundance of MOG-positive fibre-like structures in layer III of the STG of long-term schizophrenia patients was different from that in control patients. We also observed a significant reduction in the thickness in the MOG-positive fibre-like structures in layer III of the STG in long-term schizophrenia patients.
The middle layer in this study corresponded mainly to layers III and IV, which are rich in interneurons. Cerebral cortical interneuron dysfunction has also been hypothesised to be involved in the pathophysiology of schizophrenia (Reference Bissonette, Schoenbaum, Roesch and Powell28), especially in layers III and IV (Reference Beneyto, Abbott, Hashimoto and Lewis29,Reference Volk, Matsubara, Li, Sengupta, Georgiev, Minabe, Sampson, Hashimoto and Lewis30). In addition, the loss of inhibitory input into the pyramidal neurons of layers II/III has been reported in animal models of schizophrenia (Reference Umeda, Iritani, Fujishiro, Sekiguchi, Torii, Habuchi, Kuroda, Kaibuchi and Ozaki31) and postmortem brains (Reference Hoftman, Volk, Bazmi, Li, Sampson and Lewis32). Furthermore, in the STG, the impairment of inhibitory neurotransmission (mainly GABAergic neurotransmission) is considered to play a critical role in the pathophysiology of schizophrenia (Reference Steiner, Brisch, Schiltz, Dobrowolny, Mawrin, Krzyzanowska, Bernstein, Jankowski, Braun, Schmitt, Bogerts and Gos33). It is suspected that the deficit of interneuron myelination might be involved in the pathogenesis of schizophrenia (Reference Stedehouder and Kushner34). The findings of our study may support these phenomena; however, myelinated axons connected to other brain regions may also be implicated in our findings (Reference Psomiades, Fonteneau, Mondino, Luck, Haesebaert, Suaud-Chagny and Brunelin35). Although it is unclear what kind of neurons or fibres are actually involved in the decrease in the expression of MOG in the middle layer, this finding was specific to the STG, as we did not observe a significant reduction in the distribution of MOG in the neocortex of the IPL.
A few neuropathological studies have examined the myelin-oligodendrocytes in the STG of schizophrenia patients. In the cortex, Cotter et al. (Reference Cotter, Mackay, Frangou, Hudson and Landau36) reported no decreased glial densities, including oligodendrocytes in schizophrenia patients. With regard to WM, decreased populations of glial cells have been reported in schizophrenia patients (Reference Beasley, Honavar, Everall and Cotter37). However, in these investigations, no distinction was made between oligodendrocytes and other glial cells. In contrast, in our present study, we distinguished myelin-oligodendrocyte-related proteins from other components of brain tissue, using an immunohistochemical method. To our knowledge, this is the first neuropathological study that focused on myelin-oligodendrocyte-related proteins and analysed them digitally in the STG of schizophrenia patients.
MOG in the CA3 in schizophrenia patients
In the stratum lucidum of the CA3 in long-term schizophrenia patients, the occupancy ratio of expression of MOG was lower than that in controls, although no significant differences were observed in the stratum oriens or on comparing total schizophrenia patients and controls. Furthermore, the findings from our microinvestigation of the stratum lucidum suggested that the decreased expression in the region also reflects dysfunction of myelin-oligodendrocytes.
The granule cell mossy fibre pathway projects from the dentate gyrus into the stratum lucidum, which is rich in inhibitory interneurons (Reference Henze, Urban and Barrionuevo38). While mossy fibre is generally thought to be unmyelinated fibre, myelination of interneurons in the hippocampus has been reported (Reference Steiner, Brisch, Schiltz, Dobrowolny, Mawrin, Krzyzanowska, Bernstein, Jankowski, Braun, Schmitt, Bogerts and Gos33). Inhibitory neurotransmission impairment in the hippocampus is thought to play a critical role in the pathophysiology of schizophrenia (Reference Steiner, Brisch, Schiltz, Dobrowolny, Mawrin, Krzyzanowska, Bernstein, Jankowski, Braun, Schmitt, Bogerts and Gos33). The reduction of MOG in the stratum lucidum in our study may be related to a dysfunction of inhibitory neurotransmission (Reference Henze, Urban and Barrionuevo38,Reference Falkai, Steiner, Malchow, Shariati, Knaus, Bernstein, Schneider-Axmann, Kraus, Hasan, Bogerts and Schmitt39).
Oligodendrocyte and myelin damage and degeneration in schizophrenia patients have been shown in electron-microscopy studies of the neocortex and the CA3 of the hippocampus (Reference Kolomeets and Uranova40). Swelling of the periaxonal oligodendroglial process and atrophy of the inner axons found in thin myelinated fibres are the most frequently cited ultrastructural pathologies in schizophrenia patients (Reference Uranova, Vostrikov, Vikhreva, Zimina, Kolomeets and Orlovskaya41). Our finding may be associated with these pathological changes.
Effects of long-term of illness
The reduction in the MOG expression is more obvious in long-term schizophrenia patients than in those with a shorter illness duration. The finding may suggest that altered myelination is related to progressive brain changes in schizophrenia patients.
Progressive volume reductions of STG in schizophrenia patients have been frequently reported (Reference Chan, Di, McAlonan and Gong42). In a postmortem study, we previously reported that long-term schizophrenia patients had less WM in the STG than healthy subjects, where myelin-oligodendrocytes are predominant constituents (Reference Torii, Iritani, Sekiguchi, Habuchi, Hagikura, Arai, Ikeda, Akiyama and Ozaki19). Alterations in myelination might occur in the GM as well as WM in the schizophrenic brain (Reference Iwatani, Ishida, Donishi, Ukai, Shinosaki, Terada and Kaneoke43). The findings of these previous macroscopic studies might be confirmed by the findings from this microscopic study.
Hippocampal volume reductions have also been reported in schizophrenia patients. Furthermore, such reductions have been assumed to continue after illness onset (Reference Chakos, Schobel, Gu, Gu, Gerig, Bradford, Charles and Lieberman44) and correlate with illness duration (Reference Murakami, Takao, Abe, Yamasue, Sasaki, Gonoi, Takano, Takei, Kasai and Ohtomo25). Reductions in not only the total hippocampal volume but also the CA3 subfield volume have been reported (Reference Kawano, Sawada, Shimodera, Ogawa, Kariya, Lang, Inoue and Honer45). These findings from other reports may support the assumption that altered myelination is related to the progressive brain changes in schizophrenia patients.
Effects of antipsychotics and the severity of illness
In this study, the lifetime antipsychotic dosage did not correlate with the ratio of expression of MOG in the middle layer of the neocortex in the STG or the occupancy ratio of expression of MOG in the stratum lucidum of the CA3. We assessed the equivalent chlorpromazine dose without distinguishing between the different types of antipsychotics. Notably, it has been reported that quetiapine has effects on oligodendrocyte development (Reference Ma, Yang, Zhao, Li, Kang, Xiao and Jiang46). However, typical antipsychotics – and not atypical antipsychotics – were used for all cases in the present study. On the other hand, it has also been reported that pathological changes in the myelination were not attributed to neuroleptic medication (Reference Kolomeets and Uranova40). These findings suggest that antipsychotics may not affect our findings.
The severity of illness may more likely affect the expression of MOG in the stratum lucidum than in other areas. Oligodendroglial abnormalities may contribute to altered connectivity with cognitive impairment in schizophrenia patients (Reference Uranova, Vostrikov, Vikhreva, Zimina, Kolomeets and Orlovskaya41). It is assumed that alteration of myelination in the stratum lucidum may be closely related to the severity of schizophrenia.
Limitations
This study is suggestive, not conclusive, due to several limitations. First, this study had a small sample size because we carefully and rigidly selected brain specimens from autopsy cases that had correct and reliable diagnostic information and case information. It was difficult to use many specimens because of the rarity of such Japanese (mongoloid race) brain specimens, due to the underdeveloped status of the Psychiatric Brain Bank in Asia, including Japan. Second, we focused only on the inferior region of the STG and CA3 of the hippocampus. Therefore, future investigations should examine other regions of interest in which structural abnormalities have been reported in neuroimaging studies of schizophrenia. Third, human brains can be affected by various events throughout the lifetime, and some agonal factors may also have inflicted the tissue damage observed in the postmortem brains. Future studies should investigate brain tissue with evident biological backgrounds (i.e. genetic animal models, rare variants of schizophrenia) in order to confirm the association of the MOG appearance with the pathophysiology. Fourth, we observed morphological changes in the MOG-positive fibre-like structures two-dimensionally on glass slides. Thus, the direction and shape of the fibres may affect the detection and measurement of fibres, and our findings did not directly show the ultrastructure of myelinated fibres. While it would be better to observe these structures three-dimensionally, this currently remains a technical limitation.
Conclusion
We observed a significant decrease in the expressions of MOG in the STG and CA3 of the hippocampus in long-term schizophrenia patients compared with age-matched controls neuropathologically. These findings suggest that a long duration of illness has a marked effect on the expression of MOG in these regions and that myelin-oligodendrocyte abnormalities in these regions may be related to the progressive pathophysiology of schizophrenia.
Financial Support
This research was supported by JSPS KAKENHI [Grant Numbers 26461742 (2014-2016) and JP16K19759 (2016-2018)] and a Grant-in-Aid for Scientific Research on Innovative Areas, ‘Glial assembly: a new regulatory machinery of brain function and disorders’. A part of this work was carried out under the Brain Mapping by Integrated Neurotechnologies for Disease Studies (Brain/MINDS) by from Japan Agency for Medical Research and development (AMED); and the Strategic Research Program for Brain Sciences from Japan (AMED).
Conflicts of Interest
None
Acknowledgement
None.