Introduction
Fetal growth restriction (FGR) or intrauterine growth restriction (IUGR) is a pregnancy condition in which the fetus fails to achieve optimal growth expected for gestational age resulting in a small for gestational age (SGA) newborn with birth weight of <10th percentile. The most common causes include maternal malnutrition in developing countries and placental insufficiency in developed countries.Reference Han, Seferovic, Albion and Gupta1 Irrespective of the cause, poor macro- and micro-nutrient and substrate concentrations in the fetus are common pathophysiological findings. Growth-restricted infants are at increased risk for morbidity and mortality in the perinatal period,Reference Garite, Clark and Thorp2 and for many chronic diseases, including cardiovascular diseases,Reference Morrison, Ramsingh and Gunn3 metabolic disorders such as type 2 diabetes and glucose intolerance,Reference Morrison, Ramsingh and Gunn3 and obesity and abnormal lipid metabolism.Reference Würtz, Wang and Niironen4
Associations between poor fetal growth and adult health and disease have led to the concept of Developmental Origins of Health and Disease (DOHaD), which proposes that environmental exposures such as nutrient restriction during development can result in metabolic adaptations,Reference Hales and Barker5 which may enhance the survival of the fetus but increase their risk for metabolic disorders as children and adults. The concept of a mismatched environment underlying the association between fetal nutrient environment and predisposition to adult diseases is defined in the ‘thrifty phenotype hypothesis.’Reference Hales and Barker5
FGR has been studied using maternal nutrient restriction (MNR) in animals such as ratsReference Oliveira, Cezar and Gomes6–Reference Lee, You and Kwon8 and guinea pigs,Reference Nevin, Formosa and Maki9 or larger mammals like pigs,Reference Wang, Cao and Zhuo10, Reference Liu, Ma and Li11 providing a short lifespan or similar morphology and diet to humans, respectively. These models have a limited capacity for genetic manipulation in offspring to identify genes and epigenetic changes moderating impacts of fetal nutrition. Such limitations can be addressed by using MNR in mice.
Models of growth restriction in rodents with variation in the duration of nutrient restriction provide insight on certain types of fetal undernutrition, either due to the onset of placental insufficiency or food availability. For example, nutrient restriction before and throughout pregnancyReference Nevin, Formosa and Maki9, Reference Vomhof-DeKrey, Darland and Ghribi12 in rodents model mothers that experience extended nutritional deficits, however, does not mimic fetal undernutrition due to placental insufficiency. Conversely, nutrient restriction beginning later in gestation may represent placental insufficiency.Reference Oliveira, Cezar and Gomes6 Nutrient restriction just after implantation in the mouse at E6.5 has not been studied and would be more similar to early- to mid-gestation-onset placental insufficiency.
Evidence suggests that metabolic adaptations to fetal undernutrition are tissue-specific and serum peptides for obesity and diabetes can aid in identification of impacted tissues. Incretin hormones, such as glucagon-like peptide-1 (GLP-1) and glucose-dependent insulinotropic peptide (GIP), are released by the gut upon ingestion of food and stimulate release of insulin.Reference Palha, Pereira and Costa13, Reference Nauck and Meier14 Pancreatic hormones, such as insulin and glucagon, regulate tissue glucose uptake and energy utilization. In addition to hormone release, c-peptide, the cleaved portion of proinsulin, can indicate changes in insulin maturation.Reference Leighton, Sainsbury and Jones15 Leptin, resistinReference Qatanani, Szwergold, Greaves, Ahima and Lazar16 and plasminogen activator inhibitor (PAI-1)Reference Kaji17 are secreted primarily from adipose tissue in mice. Leptin along with ghrelin, which is released from the gut, regulate appetite.Reference Bewick, Kent and Campbell18, Reference Kalra, Ueno and Kalra19 Changes in these markers in addition to other metabolic tests can provide insight into tissues with metabolic adaptations.
The objective of this study was to establish a moderate total calorie nutrient restriction in mice to mimic human FGR populations and examine the long-term metabolic complications. We hypothesized that a 30% reduction in maternal food consumption by weight during early and late pregnancy would result in reduced fetal and newborn weight and tissue-specific alterations in adult glucose metabolism similar to humans.
Methods
Animals
The animal experiments were conducted as approved by the Council on Animal Care at the University of Western Ontario. All mice received free access to water in a standard 12 h light/dark cycle. Eight-week-old virgin female CD-1 mice, obtained from Charles River Laboratories (Montreal, PQ, Canada), were mated and the presence of mucous plugs indicated E0.5. After mating mice were housed individually. To avoid reduction in the number of conceptuses of each litter, mated females received ad libitum until after embryo implantation at about E5. At E6.5, the mice were randomly assigned into two groups, the control group was fed ad libitum and the MNR group was fed 70% average ad libitum total calorie intake (both groups receiving #F0173, Bio-Serv, Flemington, NJ, USA). At E18.5, 3 control and 3 MNR pregnant females were euthanized by CO2 narcosis. No differences between the number of males and females were observed between MNR and control litters (Supplementary Table 1). Litter size ranged from 6 to 22 pups. To control for variations in litter size, only litters with 11–15 pups were analyzed in fetal (control litters = 3, MNR litters = 3) and long-term studies (control litters = 5, MNR litters = 10). Because many studies suggest that male offspring are more sensitive to maternal undernutritionReference Lecoutre, Marousez and Drougard20–Reference Delahaye, Wijetunga and Heo22 and that postreproductive changes complicate long-term studies in females,Reference Pae, Baek, Lee and Wu23 only males were examined in this study. SRY polymerase chain reaction (forward primer: TGGACTGGTGACAARGCTA, reverse primer: TGGAAGTACAGGTGTGCACTCT) was used in fetal studies to include males only (control: n = 21, MNR: n = 15). Tissues were snap frozen in liquid nitrogen.
For postnatal studies, pups’ paws were tattooed at birth in order to track weights for each pup with the Armis Microtatoo kit (Braintree Scientific, Inc., Braintree, MA, USA). All litters were cross-fostered to females that were fed ad libitum throughout pregnancy and the litters were culled or fostered to 13 pups each. Ad libitum standard chow (Teklad LM-485 Mouse/Rat Sterilizable Diet, Mississauga, ON, Canada) was used for the remainder of the study in both MNR and control offspring.
At weaning (P21), only male offspring were kept for further study (control litters: n = 5, MNR litters: n = 10) and were housed with 3–5 siblings per cage. Weight was measured once a month. With the exception of littermates used for the intrahepatic portal vein insulin challenge, offspring at 1 month (control: n = 8, MNR: n = 16) and 6 months (control: n = 25, MNR: n = 36) were euthanized with CO2 narcosis. Weight was measured, and serum was collected through intracardiac puncture. Individual liver lobes, perigonadal adipose tissue and quadriceps femoris were collected, snap frozen in liquid nitrogen and stored at −80°C until analysis. Animals used for the intrahepatic portal vein insulin challenge (n = 8 per group) were euthanized at 7 months after tissue collections.
Glucose tolerance and hepatic glucose production
Glucose tolerance was assessed in 36 MNR (10 litters) and 25 controls (5 litters, 3–8 pups/litter) one week before tissue collections at 6 months by intraperitoneal glucose tolerance testing (IP-GTT). Briefly, fasted mice (4 h) (at 8:00 am) were injected with glucose 2 g/kg body weight and blood glucose was measured via tail vein every 30 min for 2 h using a Freestyle Lite Glucometer (Abbott, Alameda, CA, USA). Hepatic glucose output was measured with a pyruvate challenge test (5 pups per group, 1 pup/litter). Pyruvate was injected (IP) into mice fasted for 4 h (at 8:00 am) at 2 g/kg body weight and blood glucose was measured via tail vein every 30 min for 2 h.
Random blood glucose
Once a month from 1 to 6 months, random blood glucose (nonfasted) was measured. Blood samples were collected at 10:30 am via tail vein prick and measured using a Freestyle Lite Glucometer.
Intrahepatic portal vein insulin challenge test
At 7 months old, mice were fasted for 4 h and anaesthetized with isoflurane. Using a mid-line incision, intestines were moved to expose the hepatic portal vein and 2 U/kg of insulin (Humalin R, Eli Lilly Canada Inc., Toronto, ON, Canada) (control and MNR n = 5, 1 pup/litter) or saline (control and MNR n = 3, 1 pup/litter) was injected. After 1 min and 15 s, a piece of right medial liver lobe, a quadriceps femoris muscle and perigonadal fat were frozen in liquid nitrogen. Samples were stored in −80°C until western blot analysis.Reference Chamson-Reig, Thyssen, Hill and Arany24
Protein isolations
The experiment was conducted with 50 mg of frozen liver and muscle and 100 mg of adipose tissue that were pulverized (Medium Bessman Tissue Pulverizer, Spectrum Laboratories, Rancho Dominguez, CA, USA) and then homogenized for 30 s with the Brinkmann Homogenizer Polytron® 3000 in 1× cell lysis buffer (9803S, Cell Signaling Technology® Inc., Danvers, MA, USA) and protease inhibitor cocktail 1, 2 and 3 (P1860, P5726 and P0044, Sigma-Aldrich, St Louis, MO, USA). The homogenate was then sonicated (F550 Sonic Dismemberator, Fisher Scientific, Markham, ON, Canada) and rocked for 40 min at 4°C. Samples were spun at 12,000 g for 10 min at 4°C and the supernatant was collected with care, not to collect the lipid layer, and stored at −20°C until analysis. Protein quantification was done with the Bio-Rad protein assay dye according to the manufacturer’s protocol using bovine serum albumin (BSA) standards (Cat #500-0006, Bio-Rad Laboratories Inc., Des Plaines, IL, USA).
Western blotting
Protein samples were boiled in sodium dodecyl sulfate (SDS) sample loading buffer with dithiothreitol at 75°C for 5 min and then incubated on ice for 5 min. A 10 μg of protein was loaded and run on a 10% SDS polyacrylamide gel. Proteins were transferred to a polyvinylidene difluoride membrane using the Trans-Blot® Turbo™ Transfer System and Trans-Blot® Turbo™ RTA Midi Transfer Kit (170-4273, Bio-Rad Laboratories Inc.) according to the manufacturer’s protocol.
Once the transfer was completed, membranes were dipped in methanol and blocked with 5% milk in TBST [tris buffered saline (TBS)+1% tween]. Blocking buffer was rinsed from the membrane for 5 min (3×) with TBST at room temperature (RT). Primary antibody for pAkt (#4000, rabbit mAB, Cell Signaling Technology® Inc.) was diluted 1: 1000 into 5% BSA in TBST and incubated with blots shaking at overnight at 4°C. Membranes were rinsed with TBST 3× (5 min) at RT and then incubated with secondary rabbit IgG (#170-6515, Bio-Rad Laboratories Inc.) diluted 1: 10 000 in 5% milk in TBST for 1 h at RT. After rinsing the secondary antibody, ClarityTM Western ECL substrate (#170-5061, Bio-Rad Laboratories Inc.) and a VersaDoc Imaging System (Bio-Rad Laboratories Inc.) were used to capture an image of the gel. Membranes were then rinsed and stripped with 0.5 M NaOH, rinsed in TBS (3× 5 min at RT) and reprobed with Akt (#9272, Bio-Rad Laboratories Inc.), according to the protocol mentioned earlier.
Quantification of blots was done using Imagelab software® version 5.1 BETA (Bio-Rad Laboratories Inc.) and quantities were compared using pAkt to total Akt ratios.
Serum peptide markers for obesity and diabetes
Blood samples collected by intracardiac puncture at 1 month (control: n = 7, MNR: n = 18, 4 control and 10 MNR litters, 1–2 pups/litter) and 6 months (5 control and 10 MNR litters, 3–7 pups/litter, MNR: n = 52, control n = 30) in nonfasted mice (8:30–9:30 am) were used in this multiplex assay. At the time of collection, protease inhibitors, 10 mM DPP-IV (EMD Millipore, DPP4-010) and 1.3% aprotinin inhibitor (EMD Millipore, 616399), both in 0.9% sterile saline, were added to the blood samples (10 ul/ml). Samples were allowed to clot for 45 min and spun at twice at 12,000 g for 10 min to obtain serum. All serum samples were stored at −80°C. Ghrelin, leptin, insulin, glucagon, PAI-1, GLP, GIP and resistin were assayed on the Bio-Rad Multiplex at Lawson’s Multiplex Facility, London, ON, using the Bio-Plex Pro Mouse Diabetes Assay (171F7001M, Bio-Rad Laboratories Inc.). Serum C-peptide was also quantified according to the manufacturer’s protocol (Mouse C-Peptide ELISA, 80-CPTMA-E1, Alpco, Salem, NH).
Lipid quantification in serum and liver
An aliquot of nonfasted serum as described earlier was used for cholesterol (Cholesterol Quantification Kit MAK043, Sigma-Aldrich®, St Louis, MO, USA) and triglyceride quantification (Triglyceride Quantification Assay Kit ab65336, Abcam®, Cambridge, MA, USA). Liver cholesterol was also isolated from nonfasted liver tissue and quantified according to the manufacturer’s protocol. Measurements were taken from 5 control and 10 MNR litters, 3–6 pups/litter.
Statistical analysis
Data are presented as mean ± sem. For glucose tolerance testing, pyruvate challenge tests and random blood glucose measurements, a repeated measure ANOVA and Bonferroni post-hoc correction were used. For all other analyses, Mann–Whitney test was used to compare means where samples sizes were >8, and an unpaired t-test with ⩽8 samples. Means are considered significantly different if P <0.05. All statistics and graphs were produced in Prism software (GraphPad®, version 5.2), or the R console (version 3.3.2) with ggplot2® (version 2.2.1) and Sciplot® (version 1.1–0) software packages.
Results
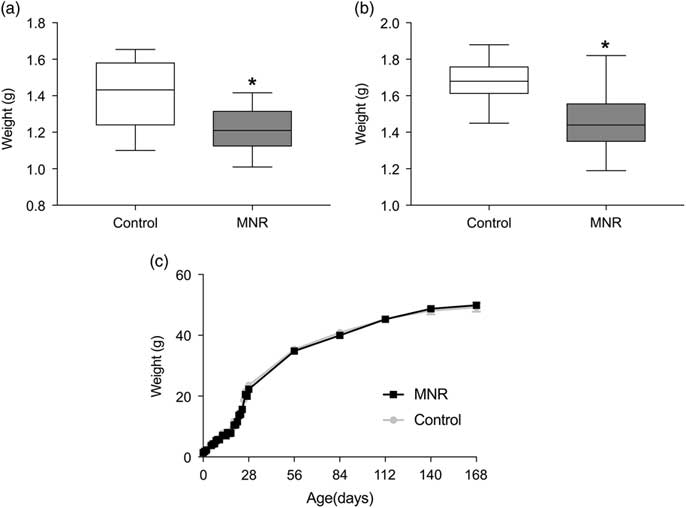
Maternal total-calorie nutrient restriction (MNR) resulted in a 13% reduction (P = 0.001) of the fetal weight at E18.5 in males (Fig. 1a), and 14% reduction (P = 1.5 × 10⁻⁸) in birth weight of males (Fig. 1b), relative to controls. Body weights are not significantly different in MNR offspring between day 3 of life and 6 months (Fig. 1c), except at 1 month (P = 0.005) when controls (23.5 ± 0.4) were heavier than MNR (22.3 ± 0.3). This protocol demonstrated a reproducible FGR from moderate MNR.

Fig. 1 (a) Body weights of offspring of MNR and control from E18.5 until 6 months. At E18.5, fetal weights of MNR (n = 15) were 13% smaller than controls (n = 20) (P = 0.001) (3 Control and 3 MNR litters, 3–8 pups/litter). (b) Birth weight of MNR offspring remained 14% smaller (P = 1.5 × 10⁻⁸) (control: n = 39 from 5 litters, MNR: n = 58 from 10 litters, 4–9 pups/litter). Except at 1 month when controls were heavier than MNR (P = 0.005), no differences were observed in weight from day 3 to 6 months. (c) From birth to 1 month (control: n = 37, MNR: n = 52, 5 control and 10 MNR litters, 3–11 pups/litter), and from 2 to 6 months (control: n = 27, MNR: n = 36) (5 control and 10 MNR litters, 3–9 pups/litter). Growth curve data is plotted as mean ± sem. Asterisk represents significance (P <0.05) evaluated by Mann–Whitney test.
In addition to body weight, organ weights were taken at each dissection. Fetal liver-to-body weight ratio was 1.4-fold reduced in MNR offspring (0.05 ± 0.003) relative to controls (0.07 ± 0.002, P <0.0001), indicating a disproportionate effect of maternal nutrition on the liver (Fig. 2a). All other organs were proportionally reduced with body weight. At 1 month, liver weight relative to body weight was similar in MNR offspring (P = 0.09) (Fig. 2b), but decreased again by 6 months (P = 0.03). These data suggest that the disproportionate impact on the liver growth is impacted by fetal nutrition and the effects extend into adulthood (Fig. 2c).

Fig. 2 Organ weights of male offspring at E18.5, 1 month and 6 months. (a) At E18.5, liver weight was reduced in MNR offspring relative to their body weight (P <0.0001) (control: n = 20, MNR: n = 15, 3 control and 3 MNR litters, 3–8 pups/litter). (b) Relative to body weight, the liver of MNR offspring was similar to controls at 1 month (P = 0.09) (control: n = 12 from 5 litters, MNR: n = 19 from 9 litters, 1–3 pups/litter), and significantly lower at 6 months (P = 0.03) (control: n = 24, MNR: n = 30, 5 control and 10 MNR litters, 3–8 pups/litter). (c) Fetal data are mean ± sem (a). Asterisk represents P <0.05 evaluated by Mann–Whitney test.
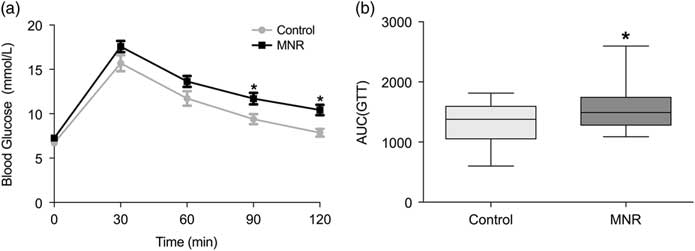
Whole body glucose metabolism and hepatic glucose output was assessed with IP-GTT and pyruvate challenge tests, respectively. Differences in glucose tolerance were detected with the area under the curve (AUC) in 6-month-old MNR offspring (1553 ± 57) relative to controls (1323 ± 68, P = 0.045) (Fig. 3a and b). Fasting blood glucose at the time of GTT was also relatively higher in MNR offspring (P = 0.3) (Fig. 3a); however, blood glucose at all time points and the AUC (Supplementary Fig. 1S) for pyruvate challenge testing indicated similar hepatic glucose output in MNR offspring relative to controls. Therefore, moderate differences in glucose metabolism were detected in the MNR offspring.

Fig. 3 IP-GTT of male offspring at 6 months. (a) Blood glucose at 90 and 120 min was significantly higher in MNR offspring (n = 36, 10 litters) relative to controls (n = 25, 5 litters, 3–8 pups/litter). The AUC was also significantly higher (P = 0.045) (b). Glucose tolerance data (a) are mean ± SEM. Asterisk represents P <0.05 evaluated by Bonferroni post hoc (a) or Mann–Whitney test (b).
Random blood glucose was measured once a month until 6 months of age. MNR offspring blood glucose level was similar to controls each month (P-value = 0.4) (Supplementary Fig. 2S), and the AUC did not differ (P-value = 0.3) (Supplementary Fig. 2S).
Serum peptide markers for diabetes and obesity were also assayed at 1 and 6 months of age. At 1 month, PAI-1 was 1.9-fold higher in MNR offspring relative to controls (P = 0.04) [Fig. 4a(i)]. PAI-1 remained 1.5-fold higher in 6-month-old MNR offspring (P = 0.04) [Fig. 4b (i)]. Increased resistin was also detected at this time in MNR offspring (189.8 ± 9.8 ng/ml) relative to controls (171.2 ± 14.5 ng/ml, P = 0.04) [Fig. 4b(v)]. C-peptide, insulin-to-glucagon ratio, GIP, GLP, ghrelin and leptin did not differ based on maternal nutrition at 1 and 6 months (Fig. 4).

Fig. 4 Serum peptide markers for obesity and diabetes at (a) 1 month (control: n = 7, MNR: n = 18; 4 control and 10 MNR litters, 1–2 pups/litter), and (b) 6 months of age (5 control and 10 MNR litters, 3–7 pups/litter; MNR: n = 52, control: n = 30). PAI-1 was increased in MNR offspring at 1 month (P = 0.04) and 6 months (P = 0.04), (i) and resistin at 6 months (P = 0.04) (v). Ghrelin (ii), GLP-1 (iii), leptin (iv), GIP (vi), insulin-to-glucagon ratios (vii), and C-peptide (viii) levels were similar between control and MNR offspring. Asterisk represents P <0.05 evaluated by Mann–Whitney test.
In addition to peptide markers, lipids were measured in serum and the right lateral liver lobe at 6 months. No differences were observed between control and nutrient-restricted offspring in serum triglycerides (P = 0.6) (Supplementary Fig. 3S Ai) or total cholesterol (P = 0.7) (Supplementary Fig. 3S Aii). Moreover, control and MNR offspring had similar liver cholesterol (P = 0.07) (Supplementary Fig. 3S B).
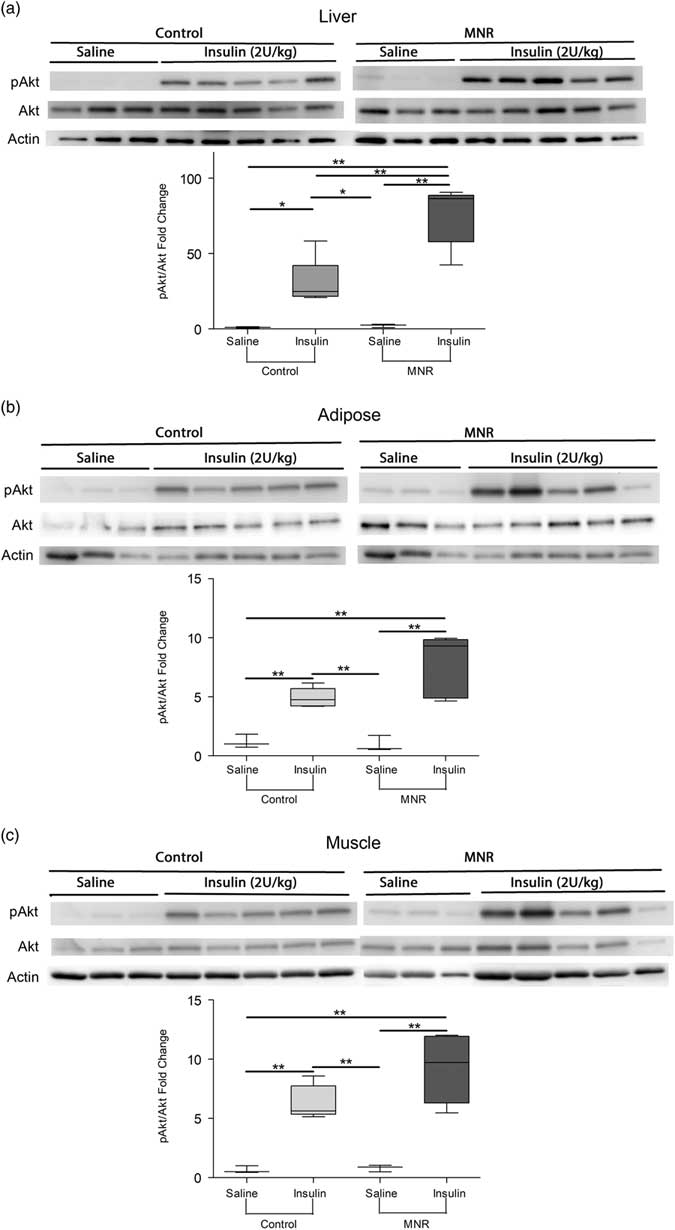
Although some differences were detected in whole-body glucose metabolism, a hepatic portal vein insulin challenge was used to examine tissue-specific insulin sensitivity. Relative to controls, the ratio of pAkt-to-Akt was 2.5-fold increased in the liver of MNR offspring in response to the insulin injection (P = 0.004) (Fig. 5a). Although not significant, insulin-stimulated phosphorylation of Akt in adipose tissue (Fig. 5b) and skeletal muscle (Fig. 5c) was relatively increased by 1.5- and 1.6-fold in the nutrient-restricted offspring, respectively (P = 0.08 and 0.05, respectively).

Fig. 5 Insulin signaling as determined by phosphorylation of Akt in response to an insulin bolus in male MNR and control offspring at 7 months of age. pAkt relative to Akt after an insulin dose was increased in MNR offspring relative to controls in the right medial liver lobe (P = 0.004) (a). pAkt-to-Akt ratios were relatively increased in MNR adipose and (c) skeletal muscle of insulin injected mice, but this change was not significant (P = 0.08 and 0.05, respectively) (b). Saline injected n = 3 and insulin injected n = 5 for both maternal nutrition groups, 5 control and 8 MNR litters, 1 pup/litter. Means with asterisks are significantly different (P <0.05, unpaired t-test).
Although changes in glucose metabolism at the tissue-level occurred to some extent in all MNR offspring, there was a variation in the degree of response to fetal nutrient restriction on adult glucose metabolism. At 6 months, 19% of the offspring were less tolerant to glucose (Fig. 6a), with a higher AUC than any controls (Fig. 6b). The remaining MNR have AUCs that were similar to those of controls. Although differences in blood glucose regulation were evident after the glucose bolus, random blood glucose measurements from 1 to 6 months were not different in less-tolerant MNR (data not shown).

Fig. 6 Glucose tolerance tests for all offspring of MNR and control at 6 months. (a) Individual glucose tolerance tests for controls demonstrate the range of responses. (b) 7 MNR (black) had AUC greater than other MNR or controls (grey), which are referred to as intolerant MNR (5 control and 10 MNR litters, 3–8 pups/litter).
Serum peptide analysis in the less-tolerant mice showed increased insulin (P = 0.006), leptin (P = 0.001) (Fig. 7g) and resistin (P = 0.005) (Fig. 7f) levels, with no changes in other assayed peptide markers (Fig. 7h).

Fig. 7 Serum peptide markers for obesity and diabetes in male MNR and control offspring at 6 months old according to glucose tolerance. Resistin (P = 0.005) (d) and leptin (P = 0.001) (e) were significantly increased in MNR offspring that are glucose intolerant. PAI-1 (a), Ghrelin (b), GLP-1(c), GIP(f), insulin-to-glucagon (g) and c-peptide (h) were not significantly different in less tolerant MNR. Control n = 30 (5 litters, 3–8 pups/litter), tolerant MNR n = 43 (10 litters, 3–8 pups/litter), intolerant MNR n = 7 (5 litters, 1–2 pups/litter). Asterisk represents P <0.05 by Mann–Whitney test.
Discussion
In humans, FGR can be symmetric or asymmetric. Symmetric FGR, meaning all organs including the brain are reduced proportionately to body weight, is often associated with an insult of early onset.Reference Nardozza, Araujo Júnior and Barbosa25 Conversely, asymmetric FGR is more common in late-onset growth restriction, and is where less essential organs are reduced but vital organs such as the brain and the heart are spared.Reference Nardozza, Araujo Júnior and Barbosa25 Similar to humans, maternal undernutrition in mice resulted in an asymmetric growth restriction, with the most significant impact on the liver.Reference Man, Hutchinson and Ashworth26 The thymus and spleen are also smaller relative to body weight in SGA autopsies,Reference Man, Hutchinson and Ashworth26 but were not measured in this study. Although reduced again at 6 months, 1-month relative liver weights were similar to controls, which might indicate differences in growth rate of the liver in MNR offspring. MNR in guinea pigs do not result in reduced liver-to-fetal weight ratios, but the fractional growth rate is increased near term.Reference Nevin, Formosa and Maki9 These data suggest that liver growth may be more sensitive than other organs to fetal undernutrition.
The variation in response to fetal nutrient restriction in our model was similar to the variations observed in the human FGR populations. Some individuals with extremely low birth weights (ELBW) although having three times greater risk will not develop glucose intolerance and type 2 diabetes.Reference Morrison, Ramsingh and Gunn3 In adults, genetic variation and differential expression contribute to obesity and metabolic disorder resistant and/or susceptible populations of nonhuman primatesReference Harris, Alcott and Sullivan27 and rodent modelsReference Weingarten, Turchetti and Krohn28, Reference Chen, Jih and Osborn29 in response to nutritional stress, such as a high fat diet. Offspring in models exposed to maternal high fat diet or nutrient restriction have metabolic,Reference Xiao, Kou, Zhang, Guo and Wang7, Reference Zhu, Zhu, Liang, Shen and Wang30 gut microbeReference Ma, Prince and Bader31 and epigenomic changes,Reference Heo, Tozour and Delahaye32 but to our knowledge none of these models focus on changes specific to susceptible and resistant populations in these offspring. Having glucose tolerant and intolerant offspring resulting from MNR allow future studies to examine differences in glucose metabolism within the MNR populations, as well as adaptations that occur in all offspring exposed to nutrient restriction in utero.
In this study, normal glucose tolerance observed in 81% of the offspring might have been due to increased insulin sensitivity as adults, despite having smaller livers. Increased insulin sensitivity in peripheral tissues in response to growth restriction is thought to occur at birth and has been shown to persist a few weeks postnatally in lambs exposed to hypoxia-induced placental insufficiency.Reference Camacho, Chen, Hay and Limesand33 To our knowledge, evidence of insulin desensitizationReference Oliveira, Cezar and Gomes6, Reference Xiao, Kou, Zhang, Guo and Wang7 has been observed rather than persistence of the increased sensitivity into adulthood. Intolerant MNR offspring, which had higher serum insulin and relatively higher insulin-to-glucagon ratios, might have insulin resistance that was not detectable during insulin sensitivity test due to technical limitations in sample size. Studies comparing liver responses in intolerant and tolerant MNR mice may provide insight into why some offspring are able to adapt to the postnatal parameters assessed in this study.
Despite having similar body weight at 6 months, PAI-1 and resistin were increased in MNR offspring. Both are produced primarily in adipose tissue in miceReference Qatanani, Szwergold, Greaves, Ahima and Lazar16, Reference Kaji17 and are associated with obesity and meta-inflammation.Reference Qatanani, Szwergold, Greaves, Ahima and Lazar16, Reference Kaji17, Reference Kim, Park and Hong34 Individuals born SGA with the highest body mass index (BMI) have reduced insulin sensitivity,Reference Veening, Weissenbruch, Waal and D de35 however, total fat pads are increased in female adult rats that experienced 50% nutrient restriction throughout gestation with similar adult body weights to controls.Reference de Souza, Pedroso and Watanabe36 ELBW babies also have similar BMI with increased body fat mass,Reference Morrison, Ramsingh and Gunn3 suggesting that an increased markers for obesity and meta-inflammation may indicate reduced lean mass in response to fetal undernutrition in male offspring, despite no differences in adult body weight. MNR offspring with glucose intolerance had higher serum resistin, suggesting increased fat mass may contribute to the development of glucose intolerance.
Leptin was also increased in offspring with less glucose tolerance. Serum leptin is correlated with body fat mass in humansReference Soininen, Sidoroff and Lindi37 and mice,Reference Xiao, Sun and Kim38 supporting the notion of differences in body composition. This marker could also indicate a decreased appetite in MNR offspring, particularly in those with glucose intolerance. Alternatively, leptin resistance occurs in diet-induced obesity, in part, via Aβ1–42-induced basal STAT3 phosphorylation in the hypothalamus,Reference Meakin, Jalicy and Montagut39 indicating that the increased leptin in offspring with impaired glucose homeostasis may be a sign of leptin resistance. Leptin may also play a role in regulation of energy expenditureReference Meakin, Jalicy and Montagut39 and behavior changes, such as food preference and total activity, which are also altered in adulthood following IUGR or undernourishment during development.Reference Silveira, Pokhvisneva and Gaudreau40, Reference Lira, Almeida and da Silva41 Increased serum leptin levels suggest that behaviors and body mass composition may be altered in all or a portion of the MNR offspring and require further investigation.
Moderate nutrient restriction throughout gestation resulted in changes to the liver and adipose tissue, including decreased fetal liver weight, increased adult insulin sensitivity in the liver, and increased serum markers for body mass composition and meta-inflammation. Liver is well known to be important in regulation of lipid and glucose metabolism and a key tissue in the development of type 2 diabetes. Although it is possible that some adaptations occur in all offspring exposed to MNR, additional physiologic and biochemical changes in the liver and other organs may be specific to those that develop glucose intolerance. This model provides an opportunity to investigate the tissue-specific molecular mechanism underlying changes between control and MNR offspring, as well as between more affected MNR and those similar to the controls, and represents the diversity in human FGR populations and their susceptibilities toward type 2 diabetes.Reference Morrison, Ramsingh and Gunn3, Reference Würtz, Wang and Niironen4
Supplementary material
To view supplementary material for this article, please visit https://doi.org/10.1017/S2040174418000983
Acknowledgements
Serum peptide analysis was run by Ms. Shannon Seney at the Screening Lab for Immune Disorders, at the Lawson Health Research Institute, London, Ontario. Dr. Edith Arany for providing guidance for the method of insulin sensitivity testing. I would also like to thank members of my Graduate Advisory Committee, Dr. Greg Gloor, Dr. Nathalie Berube, Dr. Melissa Mann, and Dr. Daniel Hardy, for their guidance and support throughout the study.
Financial support
Grant support for these studies were provided by the Canadian Institutes of Health Research (V.K.M.H., Grant 111024), Douglas and Vivian Bocking Chair in Fetal and Newborn Growth from St Joseph’s Health Care Foundation (V.K.M.H. and B.R.) and the Children’s Health Foundation (V.K.M.H.).
Conflicts of interest
The authors have no conflicts of interest to disclose.
Ethical standards
The authors assert that all procedures contributing to this work comply with the ethical standards of the relevant national guides on the care and use of mice and has been approved by the Council on Animal Care at the University of Western Ontario (2017-033).