INTRODUCTION
Mitochondria are the organelles in eukaryotic cells that produce cellular energy (ATP). Over 1500 proteins are thought to be involved in the function of mitochondria (Taylor et al. 2003). The vast majority of these proteins are encoded by the nuclear genome, whereas 13 of these proteins are encoded by the organelle's own genome: the mitochondrial (mt) genome. Phylogenetic analyses have established that mitochondria evolved from free-living α-proteobacteria (Andersson et al. 1998; Gray et al. 1999; Rand et al. 2004), via endosymbiosis about 2 billion years ago (Dimauro and Davidzon, 2005). A common consequence of endosymbiosis for bacteria is reduction in the size of the genome of the bacteria, either by gene transfer from the bacteria to the host genome, or by gene loss (Gray et al. 1999). In multi-cellular animals (hereafter animals), this process has led to mt genomes that are about 16 kb long and encode, typically, 13 proteins, 2 rRNA subunits and 22 tRNAs. The mt genomes of animals are extremely compact: there is usually only 1 large non-coding region in each genome, which has been shown, in a few well-studied animals, to control genome replication and gene transcription (Goddard and Wolstenholme, 1980; Taanman, 1999; Saito et al. 2005); there are no introns and few non-coding nucleotides outside the large non-coding region (Wolstenholme, 1992). Although encoding only a small fraction of the proteins needed for the function of mitochondria, mt genomes play a critical role in cellular activities. Indeed, mutations in mt genomes are known to be associated with at least 13 types of disorders in humans (Wallace, 2002; Dimauro and Davidzon, 2005). Mt genomes are also a rich source of information about the evolution of eukaryotes. Due to their small size, abundance in cells, and a simple mode of inheritance, mt genomes caught the attention of evolutionary biologists soon after they were discovered in the 1960s (Nass and Nass, 1962; Brown et al. 1979; Gray, 1989; Wolstenholme, 1992). Indeed, data from mt genomes have been used in thousands of studies and have greatly advanced our understanding of many evolutionary phenomena (e.g. Boore et al. 1998; Lang et al. 1999; Ingman et al. 2000).
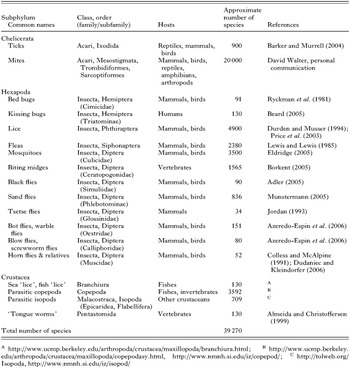
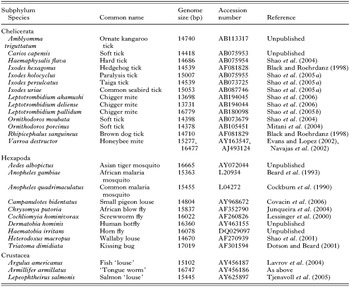
Arthropods are an ancient lineage that originated about 600 million years (MY) ago (Bergstrom, 1979). The Arthropoda is the largest animal phylum: it has over 80% of the one million or so described species of animals (May, 1990). Arthropods have adapted to every habitat, from oceans, lakes, rivers to the land and sky. Given the old age of the arthropod lineage and its abundance on earth, it is not surprising that arthropods have evolved many different life-styles, including parasitism. Parasitism, where one animal (the parasite) lives on (ectoparasite) or in (endoparasite) the body of another animal (the host) at the expense of its host, has evolved many times in arthropods. For example, the habit of blood feeding evolved at least 21 times, independently, in arthropods (Black and Kondratieff, 2005). Of the ~800000 described species of arthropods, 39270 (~5%) are parasites by our definition above. Ticks and mites of the subphylum Chelicerata account for ~53% of the described species of parasitic arthropods, followed by parasitic insects (~35%); the rest (~12%) are parasitic crustaceans (Table 1). Parasitic arthropods eat the blood, skin, flesh or feathers of their hosts, which range from non-parasitic arthropods to fishes, reptiles, birds and mammals, including domestic animals and humans. Parasitic arthropods may be a nuisance or cause injury directly through their sucking and chewing, which may lead to inflammation and/or toxic effects. The body parts and excreta of parasitic arthropods may be antigens and can cause allergic diseases in their hosts. Most importantly, however, many parasitic arthropods are vectors of organisms that cause life-threatening diseases, like malaria, plague, typhus, trench fever, relapsing fever, leishmaniasis, yellow fever, and dengue fever. Malaria, alone, causes about a million human deaths each year (http://malaria.who.int/). Parasitic arthropods also cause substantial losses in agriculture and fisheries. For example, the cost for the control of ticks and tick-borne diseases was estimated to be US$ 7 billion globally (McCosker, 1979), and the control of the salmon ‘louse’, Lepeophtheirus salmonis, costs a farmer, on average, C$350000 per crop in eastern Canada (Mustafa et al. 2001).
Despite their medical, veterinary and economic importance, most aspects of the population genetics and evolution of the vast majority of the parasitic arthropods are poorly understood, partly because of the lack of suitable markers. Mt genomes have been instructive in studies of the population genetics and evolution of both vertebrates and invertebrates (Avise, 2004), including parasitic nematodes and flatworms (Le et al. 2002; Hu and Gasser, 2006). For studies of parasitic arthropods, however, only the nucleotide (nt) sequences of a few mt genes have been used; many other markers from mt genomes have not been explored. Here, we review current knowledge on the mt genomes of parasitic arthropods, summarize applications of mt genes and genomic features in population genetic and evolutionary studies, and highlight prospects for future research.
MITOCHONDRIAL GENOMES OF PARASITIC ARTHROPODS
Of the over 700 species of animals whose mt genomes have been sequenced entirely, 24 are parasitic arthropods: 14 from the subphylum Chelicerata (ticks, mites, spiders and kin), 10 from the Hexapoda (insects and kin), and 3 from the Crustacea (crabs, shrimp and kin; Table 2). All these genomes are circular, and have the 37 genes that are typical of the mt genomes of animals: 13 for proteins, 2 for rRNAs and 22 for tRNAs, as exemplified by the mt genome of a soft tick, Ornithodoros moubata (Fig. 1). Most of the 27 parasitic arthropods whose mt genomes have been sequenced entirely have a single copy of each of the 37 genes, but there are 4 exceptions: (1) the chigger mite, Leptotrombidium pallidum, has 2 rrnL genes; (2) the African blow fly, Chrysomya putoria, has 2 trnI genes; (3) the human bot fly, Dermatobia hominis, has 2 trnV genes; and (4) the salmon ‘louse’, Lepeophtheirus salmonis, has 2 trnK genes (Fig. 2). In addition, L. pallidum has a pseudo-gene for small rRNA subunit, PrrnS, which is only half as long as the functional rrnS (Shao et al. 2005b). Non-coding regions are present in the mt genomes of all the 27 parasitic arthropods, but the size and number of non-coding regions vary. The non-coding regions of the mt genomes of the wallaby louse and the small pigeon louse are less than 100 bp long whereas the non-coding region of the kissing bug has over 2100 bp (Dotson and Beard, 2001; Shao et al. 2001; Covacin et al. 2006). For other parasitic arthropods, the non-coding regions range from 400 to 1000 bp, which is similar to those of most other animals. Eighteen of the 27 parasitic arthropods whose mt genomes have been sequenced entirely have a single copy of non-coding region in their mt genome, whereas the 2 ticks from the Australasian Ixodes lineage (sensu Barker and Murrell, 2004), the 4 metastriate ticks and 2 of the 3 chigger mites, have two non-coding regions that have near-identical nt sequences. The other chigger mite, L. pallidum, has 4 non-coding regions with near-identical nt sequences (Fig. 2).
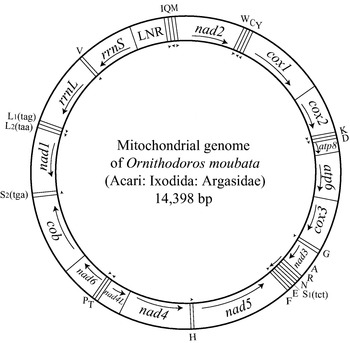
Fig. 1. The mitochondrial genome of the soft tick, Ornithodoros moubata. DNA strands are shown as 2 circles. Genes are represented as boxes and were drawn approximately to scale. Arrows inside and outside boxes (adjacent to the inner circle) indicate the orientation of transcription. Protein-coding and rRNA genes are abbreviated as atp6 and atp8 (for ATP synthase subunits 6 and 8), cox1–3 (for cytochrome c oxidase subunits 1–3), cob (for cytochrome b), nad1–6 and 4L (for NADH dehydrogenase subunits 1–6 and 4L), and rrnL and rrnS (for large and small rRNA subunits). The transfer RNA (tRNA) genes are shown with the single-letter abbreviations of their corresponding amino acids. The 2 tRNA genes for leucine are L1 (anti-codon sequence uag) and L2(uaa), and those for serine are S1(ucu) and S2(uga). LNR is the abbreviation for the large non-coding region. The gene content and gene arrangement of O. moubata is identical to those inferred for the hypothetical ancestor of the arthropods (Staton et al. 1997).
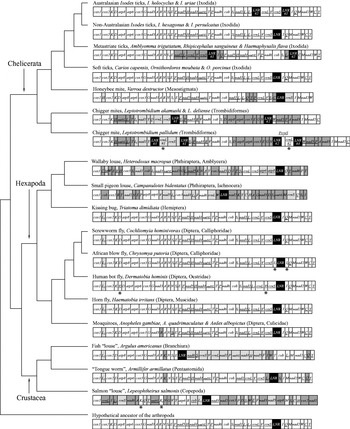
Fig. 2. Evolution of the arrangement of genes in the mitochondrial genomes of parasitic arthropods. The phylogenetic tree is from the Tree of Life Web Project (http://tolweb.org). Only the species whose mitochondrial genomes have been sequenced entirely are shown. For the purpose of illustration, the circular mitochondrial genomes are linearized arbitrarily at the 5′ end of cox1. Genes and large non-coding regions (LNR) are shown as boxes but were not drawn to scale. The abbreviations of the names of genes are defined in the legend of Fig. 1. Genes are transcribed from left to right except those genes whose names are underlined, which are transcribed from right to left. Asterisks indicate gene duplications. Large non-coding regions are highlighted in black. Dark, grey, shaded-boxes indicate genes that changed position in these genomes relative to the hypothetical ancestor of the arthropods. Pale, grey, shaded-boxes indicate genes that changed both position and the orientation-of-transcription, relative to the hypothetical ancestor of the arthropods.
The arrangement of mt genes varies among the 27 species of parasitic arthropods that have been sequenced. Of the 14 parasitic chelicerates sequenced, the non-Australasian Ixodes ticks and the soft ticks have an arrangement that is inferred to be ancestral for arthropods (Staton et al. 1997); thus, this gene arrangement has remained unchanged for over 400 MY in these two lineages (Fig. 2; Shao et al. 2004). The Australasian Ixodes ticks have the same gene arrangement as the non-Australasian Ixodes ticks and the soft ticks but have duplicate non-coding regions that have evolved in concert (Shao et al. 2005a). Several genes or blocks of genes changed positions and/or orientation-of-transcription in the mt genomes of the metastriate ticks and the honeybee mite (Fig. 2). The most rearranged mt genomes among the parasitic chelicerates are those of the chigger mites, in which over two thirds of the 37 genes have changed positions and/or orientation-of-transcription relative to the hypothetical ancestor of the arthropods (Shao et al. 2005b). Of the 13 species of parasitic insects and crustaceans whose mt genomes have been sequenced, the kissing bug, the screwworm fly, and the horn fly have a gene arrangement that is most similar to the inferred ancestral arrangement of the arthropods: the only difference is the arrangement of trnL2 gene. This tRNA gene is between nad1 and rrnL in the hypothetical ancestor of the arthropods but is between cox1 and cox2 in the kissing bug, the screwworm fly and the horn fly (Fig. 2). The rearrangement of trnL2 is apparently a shared-derived character that unites the Hexapoda and the Crustacea to the exclusion of all other arthropods (Boore et al. 1998). Thus, the kissing bug, the screwworm fly and the horn fly have retained the ancestral gene arrangement of the Hexapoda and the Crustacea. Mt genomes with rearranged trnL2 are also present in (1) the African blow fly and the human bot fly, which differ from the hypothetical ancestor of the Hexapoda and the Crustacea by having duplicated trnI and trnV, respectively; and (2) the 3 mosquitoes, the fish ‘louse’ and the ‘tongue worm’, which have the rearrangement of several other genes (Fig. 2). The trnL2 has been further rearranged in the wallaby louse, and the small pigeon louse and the salmon ‘louse’; all these 3 species have highly rearranged mt genomes, in which over four fifths of the 37 genes have changed locations and/or orientation-of-transcription (Fig. 2; Shao et al. 2001; Tjensvoll et al. 2005; Covacin et al. 2006).
MITOCHONDRIAL GENOMES ARE A RICH SOURCE OF MARKERS FOR STUDIES OF POPULATION GENETICS AND EVOLUTION
The mt genomes of extant organisms have been evolving for about 2 billion years, and thus contain much information about the evolution of these organisms. Two main types of markers from mt genomes can be used in population genetic and evolutionary studies: nt sequences, and genomic features. These 2 types of markers are complementary because they evolved by different mechanisms and at different rates (Lang et al. 1999), and can be further divided into (1) nt sequences of single genes, 2 or more genes, non-coding regions, all of the protein-coding genes, all of the tRNA genes, or the entire set of 37 genes, and (2) duplication of genes or non-coding regions, gene rearrangements, and variation in secondary structures of tRNAs and rRNAs, and variation in the number of repeats in non-coding regions.
Each of these markers has strengths and weaknesses, and their usefulness depends on the questions at hand, and the taxa studied. Nt sequences of mt genomes are a universal marker and are available, in theory, from all taxa. But the reliability of nt sequences in population genetic and evolutionary studies is affected by heterogeneity in evolutionary rate, bias in base composition and saturation of nt substitutions (Rokas and Holland, 2000). Genomic features do not have these problems but are not universal markers, and can only be useful in lineages where these features occur. Sequences of single genes are relatively easy to collect, and thus can be obtained for a large number of taxa in a single study. But sequences of single genes obviously contain a relatively small number of informative characters. Entire mt genomes, on the other hand, have many more informative characters than single genes but can be difficult to sequence.
ADVANTAGES OF MITOCHONDRIAL GENOMES OVER NUCLEAR GENOMES FOR STUDIES OF POPULATION GENETICS AND EVOLUTION
Mitochondrial genomes are dwarfed by nuclear genomes in many ways. The mosquito, Anopheles gambiae, is the only parasitic arthropod whose mt and nuclear genomes have been sequenced entirely (Beard et al. 1993; Holt et al. 2002). The nuclear genome of this mosquito is more than 18000 times larger, and has 370 times as many genes as the mt genome (Table 3). It is obvious that nuclear genomes contain many more informative characters and genomic features than mt genomes. Nuclear genomes, however, are not necessarily superior to mt genomes for studies of population genetics and evolution. Rather, mt genomes have several advantages over nuclear genomes for population genetic and evolutionary studies. First, with few exceptions, mt genomes are inherited only through maternal lineages. Thus, mt genome markers are more suitable and more powerful than nuclear genome markers for tracing the evolution of maternal lineages. Second, nt sequences of mt genes evolve faster than most nuclear genes, and thus are more suitable to address evolutionary questions at low taxonomic levels, eg. species, genera, or families. Third, mt genomes have a much higher proportion of coding sequence than nuclear genomes, and thus are better markers for studies that use coding sequences. For example, 96.5% of the mt genome of A. gambiae is coding sequence whereas only 7% of the nuclear genome of this mosquito is coding sequence (Table 3). Fourth, mt genomes are far easier to sequence and annotate than nuclear genomes, due to their small size and the abundance of mitochondria in cells.

APPLICATIONS OF MITOCHONDRIAL GENOMES IN POPULATION GENETIC AND EVOLUTIONARY STUDIES
Nucleotide sequences of single genes
Sequences of single mt genes have been used commonly to study the population genetics and evolution of parasitic arthropods. Of the 37 mt genes, cox1, cob, rrnS and rrnL have been used the most (e.g. Black and Piesman, 1994; Norris et al. 1996; Mangold et al. 1998; Murrell et al. 1999; Beati and Keirans, 2001; Leo et al. 2002; Skerratt et al. 2002; Reed et al. 2004; Mirabello and Conn, 2006); nad4 was used in only 1 study (Kittler et al. 2003). The other 10 protein-coding genes, the 22 tRNA genes and non-coding regions of the mt genome have not been explored in parasitic arthropods. Hu et al. (2003) compared the nt sequences of the mt genomes of 2 populations of the human hookworm, Necator americanus, and ranked the mt genes and non-coding regions by degree of sequence divergence as (1) non-coding regions>protein-coding genes>tRNA genes>rRNA genes; (2) between the 2 rRNA genes: rrnL>rrnS; and (3) among the 12 protein-coding genes (hookworms lack atp8 gene): nad1>nad3>cob>cox2>nad2>nad6>atp6>cox1>nad4> nad5>cox3>nad4L. This ranking illustrates a simple but important fact: mt genes and non-coding regions evolve at different rates, and thus each is suitable for addressing evolutionary questions over a particular timescale. If we assume, for the sake of argument, that the ranking above applies to parasitic arthropods, then the fastest-evolving non-coding regions and genes (i.e. nad1 and nad3) and the slowest-evolving protein-coding genes (i.e. nad5, cox3 and nad4L) have not been explored in parasitic arthropods.
Nucleotide sequences of non-coding regions
Mt non-coding regions evolve faster than coding regions and thus, generally, provide more resolution for recent evolutionary divergences than coding regions. Several studies have showed that mt non-coding regions are instructive for addressing phylogenetic relationships at low taxonomic levels (e.g. among populations, species and genera), but none of these studies was on parasitic arthropods. Liu et al. (2006) showed that a hypervariable segment of the mt non-coding region was instructive about the origins and phylogeographic history of domestic chickens. Aranishi and Okimoto (2005) studied polymorphisms in the nt sequence of a non-coding region of the mt genome of the Pacific oyster, Crassostrea gigas. These authors concluded that the nt sequence of this non-coding region was a suitable marker for resolving intra-specific relationships in the Pacific oyster and was more useful for this purpose than the less polymorphic coding regions. Drovetski (2002) compared 3 nuclear non-coding regions with an mt non-coding region of grouse (Aves: Tetraoninae), and showed that the fast-evolving mt non-coding region provided more resolution than the slow-evolving nuclear non-coding regions for relationships among 8 genera of grouse.
Concatenated nucleotide sequences of two or more genes
Sampling error is a major problem in population genetic and evolutionary studies that use sequences of single genes because different genes may have different evolutionary histories (Philippe et al. 2005). Further, the information in a single gene often cannot resolve phylogenetic relationships at a range of taxonomic levels. This problem may be overcome by using concatenated nt sequences of 2 or more genes. For example, in cnidarians, the commonly studied mt genes, cox1 and rrnL, evolved slowly, and were not informative about the evolution of these invertebrates. McFadden et al. (2004) sequenced fragments of 3 fast-evolving mt protein-coding genes, nad2, nad3 and nad6, to see if any of these genes contain sufficient variation to resolve phylogenetic relationships among genera of the anthozoan subclass Octocorallia. The relationships were poorly resolved when each gene was used alone, but there was much more resolution when concatenated nt sequence of the 3 genes was used. In 2 other studies, Hassanin (2006) showed that concatenated sequence of 6 mt protein-coding genes (atp6, atp8, cox1–3 and nad2) was instructive about the relationships among subphyla of arthropods, and Macey et al. (1999) showed that concatenated sequence of 2 protein-coding genes (nad1 and cox1) and 9 tRNA genes (trnI, trnQ, trnM, trnW, trnA, trnN, trnC and trnY) was able to resolve relationships among gekkonid lizards of the genus Teratoscincus.
Sequence of entire coding region
The nt sequence of the entire mt coding region (i.e. all 37 genes) has been used mainly in studies of the evolution of modern humans, Homo sapiens (e.g. Ingman and Gyllensten, 2003; Macaulay et al. 2005; Rajkumar et al. 2005; Thangaraj et al. 2005). These studies indicate that sequence of the entire coding region is more powerful than part of the coding region or non-coding region in population genetic studies. For example, by analysis of the nt sequence of the entire mt coding region, Rajkumar et al. (2005) identified 2 lineages (M30 and M31) in the human mt macrohaplogroup M, and led to the rejection of a hypothesis of 2 other lineages (M3 and M4) that have been previously defined, solely, from the non-coding region sequence.
Concatenated sequence of the entire set of 13 protein-coding genes
There have been many studies that use concatenated nt sequences or inferred amino acid sequences of entire sets of mt protein-coding genes to test phylogenetic relationships inferred from morphological data and nuclear gene sequences, but none of these studies was of parasitic arthropods. Most of these studies confirmed the relationships proposed from morphological data or nuclear gene sequences, and often provided more resolution of relationships that were ambiguous in the morphological and nuclear analyses (e.g. Kumazawa and Nishida, 1999; Nikaido et al. 2000; Janke et al. 2001; Arnason et al. 2002; Elmerot et al. 2002; Bae et al. 2004; Davis et al. 2004; Lavrov et al. 2004; Macey et al. 2004; Reyes et al. 2004; San Mauro et al. 2004). There are also cases, however, in which concatenated sequences of mt protein-coding genes shed little light on controversial relationships inferred from morphology or nuclear genes (Brinkmann et al. 2004), or indicated relationships that contradicted those inferred from morphology or nuclear genes (Dong and Kumazawa, 2005; Mueller et al. 2004; Nardi et al. 2003; Scouras et al. 2004).
Concatenated nucleotide sequence of tRNA genes
tRNA genes are less popular than protein-coding and rRNA genes for population genetic and evolutionary studies, primarily because of their small size (~65 bp each) and the effort required to sequence the 22 tRNA genes that spread throughout mt genomes. Sequences of tRNA genes, however, are accumulating in databases as more and more mt genomes are sequenced. Concatenated nt sequences of mt tRNA genes have been explored in only a few studies so far; none of them was on parasitic arthropods. Kumazawa and Nishida (1993) compared the power of concatenated sequence of the entire set of mt tRNA genes with the sequences of cox1 and cob to recover a well-established phylogeny of 7 representative animals that diverged 20–600 MY ago. The tRNA genes recovered the phylogeny with 100% bootstrap support whereas neither cox1 nor cob recovered this phylogeny. In another study, Kumazawa and Nishida (1995) showed that concatenated sequence of 11 tRNA genes recovered a sister-group relationship between birds and crocodilians relative to mammals. Haring et al. (2001) also showed that concatenated sequence of the entire set of 22 tRNA genes, together with the 2 rRNA genes, gave better resolution and higher bootstrap support in a phylogeny among 5 orders of birds than did the protein-coding and rRNA genes.
Gene rearrangements
Nucleotide sequences of mt genomes may be powerful markers in population genetic and evolutionary studies but are not without problems. Different substitution rates among nucleotide sites and among lineages, saturation of substitutions in lineages, non-independent substitutions among sites, and functional constraints on nucleotide substitution may confound the inference of phylogeny with nt sequences (Rokas and Holland, 2000). Compared with nt substitutions, mt genomic features are larger-scale mutations and occur much less frequently (Boore and Brown, 1998; Rokas and Holland, 2000). Mt genomic features, thus offer another way to test the relationships inferred from nt sequences.
In parasitic arthropods, 2 types of mt genomic features have been shown to be instructive to evolutionary studies: gene rearrangements, and duplications of non-coding region (see the section below). Mt gene rearrangements were initially used to address phylum-level relationships, due to the observation that the arrangements of mt genes were conserved at low taxonomic levels but varied at high levels (Boore and Brown, 1998). We now know, however, that mt gene arrangements also vary at low taxonomic levels, such as among genera and families. Several studies have shown that mt gene rearrangements are instructive markers to resolve relationships at low taxonomic levels. Covacin et al. (2006) reported that the mt genes between cox1 and cox3 have at least 4 different arrangements among 10 species of lice (Phthiraptera) from 6 families. Black and Roehrdanz (1998) and Campbell and Barker (1998) showed that the rearrangements of a tRNA gene, and a block of 7 genes are shared-derived characters that unite all known metastriate ticks (family Ixodidae). Further, in a study of whiteflies, Thao et al. (2004) showed that mt gene rearrangements are instructive for resolving phylogenetic relationships among genera of the family Aleyrodidae. Not all mt gene rearrangements, however, are informative. For example, two neighbouring genes, trnK and trnD, swapped positions independently in the locust and the honeybee (Crozier and Crozier, 1993; Flook et al. 1995), and 2 novel gene boundaries, cox2-trnG and cox3-trnR, evolved independently in the plague thrips (Thysanoptera) and a lepidopsocid species (Psocoptera; Shao and Barker, 2003). The chance of convergent evolution of novel gene arrangement, however, is low and such convergence can usually be identified by broadening the taxon sampling (Dowton et al. 2002).
Duplication of genes and non-coding regions
Mt genomes of animals typically have only 1 copy of each of the 37 genes and the non-coding region. Duplicate genes, however, are present in 4 of the 27 parasitic arthropods whose mt genomes were sequenced entirely: the African blowfly (duplication of trnI), the human botfly (trnV), the salmon ‘louse’ (trnK), and the chigger mite, L. pallidum (rrnL, Fig. 2). Duplicate non-coding regions are present in the Australasian lineage of Ixodes ticks, the metastriate ticks and chigger mites. Further, the chigger mite, L. pallidum, has a pseudo-rrnS gene, in addition to the apparently functional rrnS. Lessinger et al. (2004) reported that duplicate trnI genes in the African blow fly, Chrysomya putoria, were also present in 2 other Chrysomya species, C. megacephala and C. albiceps, whose mt genomes had been sequenced partially. These authors suggested that duplicate trnI genes might be a shared-derived character for species of the genus Chrysomya. Shao et al. (2005a) showed that duplicate non-coding regions occurred in both Australasian Ixodes ticks (one of the 2 main lineages of Ixodes ticks) and metastriate ticks, and were a shared-derived character for each of these 2 lineages. Among the chigger mites, however, duplicate rrnL genes and the pseudo-rrnS gene occurred only in L. pallidum, not in the other 3 species of Leptotrombidium studied (Shao et al. 2006). Studies of more Leptotrombidium species and different populations of L. pallidum should reveal whether duplicate rrnL genes and the presence of pseudo-rrnS gene are instructive specific or intra-specific markers.
Secondary structures of tRNAs
In most animals, all of the mt tRNAs can form clover-leaf-shaped secondary structures except tRNA-Ser (ncu) which lacks a D-arm and has a replacement loop instead (Fig. 3). The unusual structure of tRNA-Ser (ncu) was thought to be ancestral to all multi-cellular animals (Wolstenholme, 1992). In a number of animal species, however, several other tRNAs also lack a D-arm or a T-arm (Yamazaki et al. 1997; Macey et al. 2000; Lavrov and Brown, 2001; Masta and Boore, 2004). The most extensive changes in tRNA secondary structures occurred in nematodes of the class Secernentea, where all of the 22 tRNAs lack either a D-arm or a T-arm (Okimoto et al. 1992). Comparison between species of nematodes in this class with Trichinella spiralis indicates that 8 of the 20 modified secondary structures appear to be shared-derived characters for species of the class Secernentea (Lavrov and Brown, 2001). Unusual tRNA secondary structures that are likely to be derived characters have also been found in parasitic arthropods. In the honeybee mite and the metastriate ticks, tRNA-Cys lacks a D-arm (Black and Roehrdanz, 1998; Navajas et al. 2002); in the salmon ‘louse’, tRNA-Arg and tRNA-Ala lack D-arms whereas tRNA-Glu lacks the T-arm (Tjensvoll et al. 2005). In the chigger mite, L. pallidum, 9 of the 22 tRNAs lack a T-arm whereas 10 other tRNAs lack a D-arm (Fig. 3; Shao et al. 2005b). Another 3 chigger mites, L. akamushi, L. deliense, and L. fletcheri, share the truncated tRNAs with L. pallidum (Shao et al. 2006). Whether or not these modified tRNAs are instructive for population genetic and evolutionary studies of parasitic arthropods waits to be tested.

Fig. 3. The conventional cloverleaf secondary structure of tRNAs (A), and the consensus structures of the tRNAs of the chigger mite, Leptotrombidium pallidum (B). The numbering of nucleotides follows Sprinzl et al. (1989), except for those at D-arm replacement loop and TV replacement loop, which start with ‘D’ and ‘T’ respectively. Degenerate nucleotides are: K=G/U; R=A/G; Y=C/U; and W=A/U.
Nucleotide sequences combined with genomic features
The rapid advances in DNA sequencing technology have made it possible to sequence entire or near-entire mt genomes of a number of taxa relatively quickly and cheaply, and thus, to analyse nt sequences and genomic features simultaneously in a single study. This combined approach allows for reciprocal tests of the results obtained from different types of data. The power of this approach has been demonstrated in studies of phylogenetic relationships at the levels of phylum, subphylum and family (Boore and Brown, 2000; Morrison et al. 2002; Boore and Staton, 2002; Lavrov et al. 2004; Macey et al. 2004); 1 of these studies was on parasitic arthropods (Lavrov et al. 2004). We use 3 of these studies below to introduce this combined approach. Boore and Brown (2000) analysed the concatenated amino acid sequence of 8 mt proteins of 9 species from 5 animal phyla: Annelida, Arthropoda, Chordata, Mollusca, and Pogonophora. This study indicated that (1) pogonophorans (‘beard worms’) are a lineage within the phylum Annelida, rather than a sister lineage of the Annelida, and (2) annelids are more closely related to mollusks than to arthropods. Bootstrap support for these two relationships, however, was low (49% and 69% respectively). Boore and Brown (2000) then analysed the concatenated nt sequence of 12 mt tRNA genes, and the arrangement of over half of the total mt genes. These analyses provided more support for the two relationships above: for the first, the bootstrap value increased from 49% to 90%, and the second was supported by 2 shared-derived gene arrangements, trnS-nad2-cox1, and trnC-trnM-rrnS. Morrison et al. (2002) reported 4 gene rearrangements in hermit crabs (Anomura: Crustacea), and showed that 3 of these rearrangements corroborated relationships that were strongly supported by nt sequences of nuclear genes (18S, 28S) and mt genes (cox1, rrnL) whereas one of the gene rearrangements helped resolve the phylogeny of 3 families that could not be resolved with the nt sequences. Lavrov et al. (2004) addressed the controversial phylogenetic position of pentastomids (‘tongue worms’): a group of endoparasites that was thought to be related to arthropods. The analysis of concatenated amino acid sequence of 12 mt proteins (excluding ATP8) placed pentastomids in a well-supported group with arthropods and nematodes and, further, as the sister group of the nematodes. This sister-group relationship, however, was in doubt because the pentastomids and nematodes analysed have long branches in the phylogenetic tree. Thus, long-branch attraction may have confounded the analysis (Philippe and Laurent, 1998). The authors then analysed the mt gene arrangement and found that the pentastomid species had the gene arrangement, cox1-trnL(uaa)-cox2, which is a shared-derived character for Pancrustacea (Crustacea+Hexapoda). This gene arrangement strongly supports the view that pentastomids are arthropods and allows for the rejection of a sister-group relationship between pentastomids and nematodes. Further, the pentastomid species also shared 2 novel gene arrangements, trnR-trnK-trnN and trnY-trnQ-trnC, with 2 species of crustacea from the classes Cephalocarida and Maxillopoda. These 2 novel gene arrangements indicate strongly that pentastomids are crustaceans and are more closely related to cephalocarid and maxillopod crustaceans than to other crustaceans and hexapods.
CONCLUSION
Mt genomes are a rich source of markers for studies of population genetics and evolution. These markers include nt sequences of 3 types of genes (for proteins, rRNAs and tRNAs) and non-coding regions, and various genomic features. In parasitic arthropods, however, only the nt sequences of 4 of the 37 mt genes (cox1, cob, rrnS and rrnL) have been well explored. The sequences of 33 other mt genes and non-coding regions have not been explored; neither have most of the genomic features, such as gene duplications and novel gene arrangements. In addition, most population genetic and evolutionary studies of parasitic arthropods have relied on partial sequences of single mt genes whereas the more powerful approach of combing sequences of 2 or more genes together, or combining nt sequences with genomic features, has not received the attention it deserves. Thus, it is obvious to us that future studies on the mt genomes of parasitic arthropods should include (1) sequencing entire mt genomes of more species, especially from lineages that are currently not represented or are under-represented in databases (e.g. fleas, mites, parasitic crustaceans), and from lineages that have highly rearranged mt genomes (e.g. lice, salmon ‘lice’, chigger mites); (2) exploring the utility of genomic features, and nt sequences of non-coding regions and genes other than cox1, cob, rrnS and rrnL; and (3) applying approaches that combine sequences of 2 or more genes together, or combine nt sequences with genomic features in population genetic and evolutionary studies of parasitic arthropods.
We thank Professor Robin Gasser for initiating this review. We would also like to thank the editor, Professor Stephen Phillips, and the two anonymous reviewers for valuable comments on this manuscript. This work was supported by an Australian Postdoctoral Fellowship grant (DP0662755) to R.S. from the Australian Research Council.