INTRODUCTION
Advanced irrigation technologies, such as drip and sprinkler irrigation, are more efficient than traditional surface methods and achieve higher crop and water productivity (Sivanappan, Reference Sivanappan1998). Deficit (or regulated deficit) irrigation is one way of maximizing the water use efficiency (WUE) for higher yield per unit of irrigation water applied. The goal of deficit irrigation (DI) is to increase crop WUE by reducing the amount of water at irrigation or by reducing the number of irrigation events (Kirda, Reference Kirda and Kirda2002). Under DI, crops are deliberately exposed to water stress, which may consequently lead to yield reduction (Prichard et al., Reference Prichard, Hanson, Schwankl, Verdegaal and Smith2004; Smith et al., Reference Smith, Kivumbi and Heng2002; Zhang et al., Reference Zhang, Cai and Yang2004). Drip irrigation has been practised for many years for its effectiveness in reducing soil surface evaporation, increasing the crop yield and WUE (Sivanappan, Reference Sivanappan2004). Now it has been used widely in horticultural and wide-spaced agricultural crops to tackle the problem of water scarcity. In addition to DI, Partial Root zone Drying (PRD) is also a promising practice for inducing stress tolerance in some agricultural and horticultural crops (Kirda, Reference Kirda and Kirda2002; Prichard et al., Reference Prichard, Hanson, Schwankl, Verdegaal and Smith2004; Gencoglan et al., Reference Gencoglan, Gencoglan, Kırnak, Akbay and Boz2005). The DI and PRD systems require high management skills. Micro-irrigation technology facilitates the application of DI and PRD.
The PRD irrigation and DI involve manipulating the placement of irrigation water. This type of small frequent irrigation applications is achievable only with either drip irrigation or Large Mobile Irrigation Machines (LMIMs; White, Reference White2007). White (Reference White2007) also conducted a field trial to evaluate a range of both deficit and PRD irrigation strategies on cotton under commercial conditions through LMIMs and found that there was no significant influence of PRD on cotton. The use of permanent, pressurized irrigation systems also made it possible for small amounts applied at frequent intervals, thus providing an additional tool for stress management (Fereres and Soriano, Reference Fereres and Soriano2007). Several scientists studied the effect of water stress by reducing the irrigation amounts from 100 to 80 or 75% ET and reported that the yield was not significantly affected at these irrigation levels. Dagdelen et al. (Reference Dagdelen, Basal, Yilmaz, Gurbuz and Akcay2009) reported that seed cotton yield was not significantly affected by drip irrigation application rates of 100% and 75% ET. Darusman et al. (Reference Darusman, Khan, Stone and Lamm1997) reported that maximum grain yield was obtained under irrigation amount of 75% ET compared with 100% ET. El-Hendawy et al. (Reference El-Hendawy, El-Lattief, Ahmed and Schmidhalter2008) also demonstrated the effect of different irrigation rates on maize grain yield and concluded that comparable grain yield was obtained in both 100% and 80% ET. Du et al. (Reference Du, Kang, Zhang and Li2008) outlined the positive impact of alternate drip irrigation in cotton and stated that alternate drip irrigation showed good physiological response and increased the WUE of cotton.
Relative leaf water content (RLWC; Gadallah, Reference Gadallah1995), leaf proline accumulation (Yancey et al., Reference Yancey, Clark, Hand, Bowlus and Somero1982) and chlorophyll stability index (CSI; El-Sharkawi and Salama, Reference El-Sharkawi and Salama1977) are some sensitive physiological indicators used to study the response of plants under water stress.
The RLWC is a measure of the amount of water present in the leaf tissue. Sampathkumar (Reference Sampathkumar2003) reported that cotton plants irrigated at 100% pan evaporation maintained higher RLWC than water-stressed plants. In maize, water stress at vegetative stage decreased the RLWC in sensitive cultivars (Li and Staden, Reference Li and Staden1998). Song et al. (Reference Song, Dai, Gu and Li1995) reported that well watered maize leaves maintained relatively high water content than stressed one. Accumulation of proline in leaf is widespread plant response of environmental stresses, including water stress (Yancey et al., Reference Yancey, Clark, Hand, Bowlus and Somero1982). Proline acts as an osmoprotectant as well as a compatible solute (Ueda et al., Reference Ueda, Shi, Shimada, Miyake and Takabe2008) and its accumulation is more under water stress condition (Reddy et al., Reference Reddy, Chaitanya and Vivekanandan2004). Kar et al. (Reference Kar, Patro, Sahoo and Hota2004) studied the response of different cotton cultivars to moisture stress and found that stress apparently increased the proline accumulation. The stability of chlorophyll under water stress was expressed as CSI. Water stress damaged the cell membrane and affected the stability of chlorophyll (Blackman et al., Reference Blackman, Obendorf and Leopold1995). Gadallah (Reference Gadallah1995) studied the performance of maize plants under moisture stress for its physiological characters. In control (fully watered) plants, decrease in CSI was accompanied by a progressive decrease in soil water potential. The decrease was highly significant at low soil matric potential. Kar et al. (Reference Kar, Patro, Sahoo and Hota2004) studied different physiological characters in cotton cultivars under water stress and found that CSI was adversely affected by the moisture stress. Under sever water stress, the CSI decreased with increase in water stress in most of the genotypes of maize (Meena Kumari et al., Reference Meena Kumari, Dass and Pawan2004).
The PRD irrigation was implemented in orchards and other field crops by using two drip laterals per crop row in order to create alternate wet and dry soil profile. In practice, it is not an economically viable technology due to more investment on drip laterals. At present, a paired row system (one drip lateral for two rows of crop) was recommended in most of the field crops as an economically viable layout. Creation of soil moisture gradient is important to explore the beneficial effects of PRD irrigation and it could be possible only through the alternate deficit irrigation (ADI) practice in the present situation. Hence, in this study it was planned to use the PRD and DI approaches through drip irrigation in existing paired row layout and soil moisture gradient was created through application of ADI at two levels of irrigation (100% and 80% crop evapotranspiration (ETc)). In India, little attempt has been made to assess the physiological consequences of cotton–maize crop sequence under DI. The main objective of this research was the physiological response of cotton and maize to DI implemented through drip system under sequential cropping.
MATERIALS AND METHODS
Seasons and weather data
Field experiments were conducted at the Department of Agronomy, Agricultural College and Research Institute, Coimbatore, India from 2007 (winter) to 2009 (summer). The region is characterized as semi-arid tropical (SAT) climate, located at 11°8ʹ N latitude and 77° 8ʹ E longitude. The mean annual rainfall (83 years) at Coimbatore is 648 mm distributed over about 50 rainy days with a 30% annual coefficient of variation. The rainfall is monsoon type, with a south-west monsoon from June to September and a north-east monsoon from October to December. The annual mean maximum and minimum temperatures are 31.58 °C and 21.28 °C, respectively.
Cotton crop was raised during winter (from August 2007 to January 2008) and maize was raised during summer (from February to May 2008) under raised bed layout of drip system. Maize was sown after hybrid cotton under no till condition without disturbing the drip layout. A confirmation study with the same set of treatments was conducted in the same seasons during 2008–2009. The pre-sowing composite soil samples collected from the experimental soil were analysed for physical–chemical characteristics. The experimental soil was sandy clay with 1.36–1.42 g cc−1 (2007) and 1.34–1.41 g cc−1 (2008) of bulk density, field capacity of 25.2–26.3% (2007) and 25.1–26.1% (2008) and permanent wilting point of 12.5–13.7% (2007) and 12.4–13.6% (2008). The nutrient status was low (264–248 kg ha−1), medium (18.1–18.5 kg ha−1) and high (364–372 kg ha−1) for available nitrogen (N), phosphorus (P) and potassium (K), respectively.
Cotton crop raised in first year during winter (August 2007 to January 2008) received 483 mm of rainfall in 24 rainy days (Table 1). Weekly mean pan evaporation ranged from 4.6 to 7.2 mm per day. Maximum mean weekly temperature was 33.0 °C and minimum was 16.3 °C. Relative humidity ranged between 74% and 96% and 41% and 71% at 0722 hr and 1422 hr, respectively. Maize crop raised during February to May 2008 received 171 mm of rainfall in 9 rainy days (Table 2). Weekly mean evaporation ranged from 3.2 to 7.3 mm per day. Maximum mean weekly temperature was 29.0 to 35.7 °C and minimum temperature was 15.9 to 24.6 °C. Relative humidity fluctuated from 70 to 92% and 28 to 63% at 0722 hr and 1422 hr, respectively.
Table 1. Seasonal rainfall distribution (cotton).

Table 2. Seasonal rainfall distribution (maize).

Cotton crop raised in second year during winter (July to December 2008) received 473 mm of rainfall in 30 rainy days. Weekly mean pan evaporation ranged from 2.4 to 7.3 mm per day. Maximum mean weekly temperature was 27.1 to 33.4 °C and minimum temperature was 16.9 to 23.5 °C. Relative humidity ranged between 76% and 94% and 38% and 71% at 0722 hr and 1422 hr, respectively. The second maize crop raised from January to May 2009 received 101 mm of rainfall in four rainy days. Weekly mean evaporation ranged from 4.8 to 6.8 mm per day. Maximum mean weekly temperature ranged between 29.1 °C and 36.4 °C and minimum temperature ranged between 18.0 °C and 24.4 °C. Relative humidity fluctuated from 79 to 88% and 19 to 45% at 0722 hr and 1422 hr, respectively.
Layout and experimentation
The experiment was laid out in a randomized block design and the treatments were replicated thrice. Treatments comprised six irrigation treatments through drip irrigation, with one furrow irrigation for comparison (Table 3). Drip irrigation system was operated once in three days and water was applied as per the treatments based on estimated ETc. In the event of rain during the cropping period, the irrigation cycle was skipped if the cumulative rainfall exceeded cumulative pan evaporation (CPE), and the actual amount of rainfall was taken as effective rainfall. The treatments were allotted to the plots by randomization.
Table 3. Treatment details.

The experimental field was thoroughly ploughed and ridges and furrows were formed 75 cm apart to accommodate furrow-irrigated crop. Beds were formed in the dimensions of 120 cm width, 30 cm furrow and 15 cm height. Buffer channels were formed to control the lateral seepage of water from one plot to another. The plot size was 7.2 × 4.5 m, accommodating six rows of crop. Cotton Bt hybrid Malliga, released by Nuzi Veedu Seed (Pvt.) Ltd., and maize hybrid COHM (5), released by Millets Department, Tamil Nadu Agricultural University, were used for the experimental study. Seeds were hand-dibbled at the rate of one per hole. Paired row spacing of 120 + 30 × 60 cm was followed. Dates of sowing for cotton and maize were on 1.8.2007 and 23.7.2008, and 19.2.2008 and 18.1.2009, respectively. Sowing irrigation was uniformly given to all treatments. The depth of irrigation was fixed as 5 cm. The drip irrigation scheduling was done based on wetted area concept and irrigation system was operated once in three days.
Water requirement or ETc (litres per day or Lpd) = CPE × Kp × Kc × Wp × S,
where
ETc = crop evapotranspiration,
CPE = cumulative pan evaporation (mm),
Kp = pan factor (0.8) (Vijayalakshmi, Reference Vijayalakshmi2003),
Kc = crop coefficient,
Wp = wetting area percentage (80%) (Veeraputhiran, Reference Veeraputhiran2000),
S = Crop spacing (0.75 × 0.60 m for cotton; 0.75 × 0.20 m for maize),
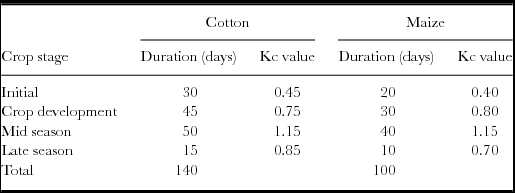
Irrigation water was pumped from the water source and conveyed to the main line of 63-mm outer diameter (OD) polyvinyl chloride (PVC) pipes after filtering through sand filter. In the main line, venturi was installed for fertigation. From the main, sub-mains of 40 mm OD PVC pipes were drawn, and from the sub-main, laterals of 12-mm low linear density polyethylene (LLDPE) pipes were installed at an interval of 1.5 m. Each lateral was provided with individual tap control for imposing respective irrigation schedules. Along the laterals, inline drippers with a discharge capacity of 4 L hr−1 were spaced at 0.6 m. Single lateral was used for a paired row of cotton. Sub-mains and laterals were closed at the end with end cap. After installation, trial run was conducted to assess mean dripper discharge and uniformity coefficient. This was taken into account while fixing the irrigation water application time. During the irrigation period an average of 90–95% uniformity was observed. The ETc was calculated as proposed by Allen et al. (Reference Allen, Pereira, Raes and Smith1998), and the tabulated Kc values (Brouwer and Heibloem, Reference Brouwer and Heibloem1986) were adjusted according to the local climatic conditions (Table 4). Furrow irrigation was applied based on IW/CPE (IW = irrigation water) ratio of 0.75. The depth of irrigation was fixed as 5 cm per irrigation.
Table 4. Crop factor (Kc) values.
Drip lines were laid out in a ‘one-line two-row pattern’ (i.e. two rows of crops were irrigated with one drip line). Irrigation was applied as 100% (T1) ETc and 80% (T4) ETc throughout the cropping period. Irrigation under simulated PRD, i.e. ADI treatments schedule was as follows: ADI treatment (T2) irrigation was applied 100% ETc in the first irrigation cycle and 50% in the second irrigation cycle, and treatment (T5) received 80% ETc in the first irrigation cycle and 40% ETc in the second irrigation cycle. Under severe water stress treatments (T3 and T6), irrigation was applied by skipping alternate cycle. Conveniently, it was fixed as once in six days with 50% and 40% ETc, respectively, in T3 and T6. Mild water stress was imposed in T2 and T4, while moderate stress was in T5 and severe stress in T3 and T6. A separate outlet in pipeline was used to deliver water to the furrow-irrigated plots, and the quantity of water was measured using water meter. The amounts of irrigation water applied in different treatments were provided in Tables 5 and 6. Pendimethalin @ 1.0 kg of active ingredient (a.i.) ha−1 and Atrazine @ 0.5 kg a.i. ha−1 were applied, respectively, in cotton and maize fields as pre-emergence herbicide at 3 days after sowing (DAS). Hand weeding was done at 25 and 60 DAS in cotton and 25 DAS in maize. Gap filling was done at 10 DAS for cotton and 6 DAS for maize in order to maintain the optimum plant population of 22,220 and 66,660 plants ha−1, respectively. Healthy crop stand was ensured by adopting recommended package of practices and need-based plant protection measures. Recommended dose of 90:45:45 kg and 150:75:75 kg of NPK per hectare were applied to cotton and maize, respectively. Nitrogen and potassium were applied through fertigation for drip irrigation treatments in the form of urea and muriate of potash, respectively. Full dose of phosphorus was applied basally as single super phosphate in all treatments. Fertigation schedule (Table 7) was adopted for both the crops and injected (once in 10 days and 6 days for cotton and maize, respectively) through venturi device. Both the nutrients were applied together during each fertigation. In surface irrigation treatment, fertilizers were soil-applied as split doses as per the recommendation.
Table 5. Irrigation water applied for cotton.
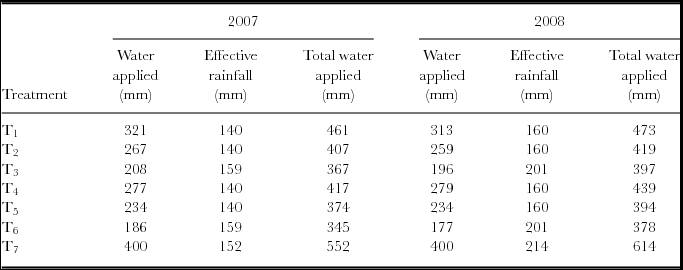
Table 6. Irrigation water applied for maize.
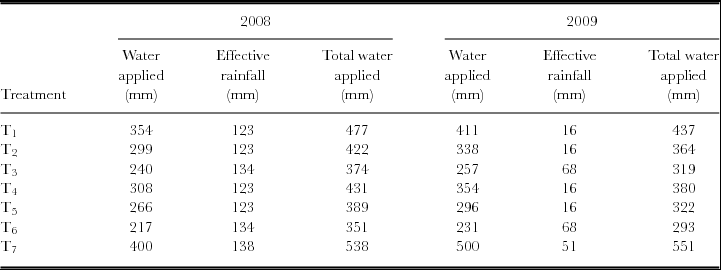
Table 7. Fertigation schedule for Bt hybrid cotton and maize.
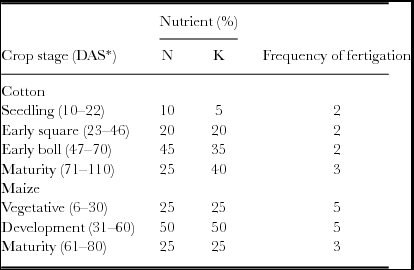
*Days after sowing.
Observations
Five fully expanded leaves per treatment from areas of the canopy exposed to sunlight were selected at random and tagged for assessing the physiological parameters. Observations were made before irrigation cycles during the rain-free period (blooming and boll development stages for cotton; tasseling and silking stages for maize) for analysing physiological parameters. RLWC was estimated as suggested by Barrs and Weatherly (Reference Barrs and Weatherley1962) and result was expressed as percentage. The leaf proline accumulation was estimated as described by Bates et al. (Reference Bates, Waldren and Teare1973). The quantity of proline in the test sample was calculated with reference to standard curve and expressed in terms of μmol g−1 FW. Chlorophyll stability index was assessed according to the method suggested by Murty and Majumder (Reference Murty and Majumder1962) and result was expressed as percentage. The hand-picked seed cotton obtained from net plot area was shade-dried, weighed at each picking and yields of all picking were added and calculated as kg per plot and then expressed in kilogram per hectare. Harvested matured cobs from net plot at physiological maturity were dried, threshed, weighed and calculated as kg per plot and expressed in kilogram per hectare. The cost of cultivation was worked out based on prevailing market rates of various inputs, and wages were paid to the labour at Central Farm Unit, Agricultural College and Research Institute, Coimbatore. The cost of drip irrigation unit per season was computed by dividing the capital investment on drip irrigation unit (25% subsidy) by its life span, which was assumed as 14 seasons. Gross income per hectare was calculated based on the local market price in Indian rupees (INR) and net income (benefit) was calculated by subtracting the corresponding cost of cultivation from the respective gross income. Benefit cost ratio was calculated based on input and output ratio,
 \begin{equation*}
{\rm Benefit}\;{\rm cost}\;{\rm ratio}\;{\rm (BCR)} = \frac{{\rm Net}\;{\rm income}\;{\rm (INR,}\;{\rm ha}^{\rm - 1})}{{\rm Cost}\;{\rm of}\;{\rm cultivation}\;{\rm (INR,}\;{\rm ha}^{\rm - 1})}
\end{equation*}
\begin{equation*}
{\rm Benefit}\;{\rm cost}\;{\rm ratio}\;{\rm (BCR)} = \frac{{\rm Net}\;{\rm income}\;{\rm (INR,}\;{\rm ha}^{\rm - 1})}{{\rm Cost}\;{\rm of}\;{\rm cultivation}\;{\rm (INR,}\;{\rm ha}^{\rm - 1})}
\end{equation*}Data analysis
The data pertaining to yield and physiological parameters were subjected to statistical analysis by Analysis of Variance (ANOVA) using AGRES (Data Entry Module for AgRes Statistical software version 3.01, 1994 Pascal Intl. Software Solutions). Differences between mean values were evaluated for significance using Least Significant Difference (LSD) at 5% probability level as suggested by Gomez and Gomez (Reference Gomez and Gomez1984).
RESULTS
Seed cotton yield
Water stress induces some physiological changes inside the plants, which are hidden and have cumulative effect on crop yields. In this study also water stress had significant effect on crop yields.
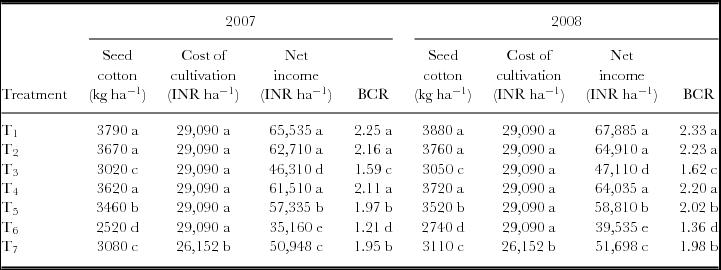
The seed cotton yield was significantly influenced by the DI practices during 2007 and 2008 (Table 12). In general, seed cotton yield was higher during 2008 than 2007. Water stress adversely affected the seed cotton yield and recorded the lowest values under drip irrigation at 40% ETc once in six days (T6). Significantly, the highest yields (3790 and 3880 kg ha−1 during 2007 and 2008, respectively) were recorded under CDI at 100% ETc (T1), which was at par with T2 and T4. Plants subjected to severe water stress (T3 and T6) recorded significantly lower yields than other treatments and the least yields (2520 and 2740 kg ha−1 during 2007 and 2008, respectively) were recorded under T6. Reduction in yield was observed more in T6 when compared with other treatments. However, seed cotton yield obtained under T3 was comparable with T7. ADI (T5 and T2) maintained good yields (3460 to 3670 kg ha−1 and 3520 to 3760 kg ha−1 during 2007 and 2008, respectively), even though consumed less water when compared with T4 and T1, respectively. Except in T3 and T6, significant yield increase was observed under DI applied through drip system when compared with surface irrigation (T7). The increase was 380, 540, 590 and 710 kg ha−1 in 2007 and 410, 610, 650 and 770 kg ha−1 in 2008 in T5, T4, T2 and T1, respectively, when compared with T7.
Maize grain yield
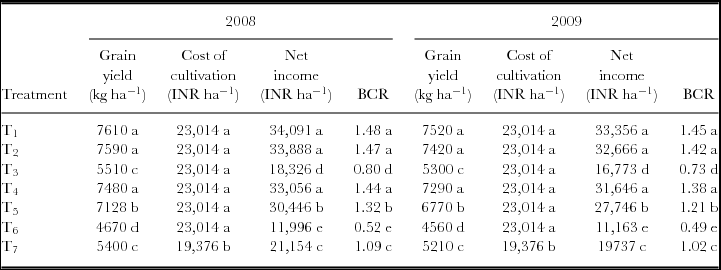
Maize grain yield was highly influenced by DI practices during 2008 and 2009 (Table 13). In general, irrespective of treatments, grain yield was more in 2008 than in 2009. This might be due to comparatively more and well-distributed in-season rainfall in 2008 (Table 2). Maize plants grown under CDI at 100% ETc (T1) produced significantly more yield (7610 and 7520 kg ha−1 during 2008 and 2009, respectively) and it was comparable with ADI at 100% ETc (T2) (7590 and 7420 kg ha−1, respectively, during 2008 and 2009). Next to T1 and T2, CDI at 80% ETc (T4) produced more grain yields but the differences were comparable with each other. Drastic reduction in grain yield was observed under severe water-stressed treatments (T3 and T6), and CDI at 40% ETc once in six days (T6) recorded the lowest (4670 and 4560 kg ha−1 during 2008 and 2009, respectively) grain yield than in other treatments. However, differences between T6 and T3 were significant. Moreover, T3 produced slightly higher grain yield, which was comparable to surface irrigation (T7).
Relative leaf water content
Water stress had significant effect on observed parameters for both the crops and registered relatively similar values during both the years. Irrigation treatments had profound influence on relative water content of leaf and registered higher values during the blooming (60–70 DAS) and comparatively less during the boll development (110–120 DAS) stages (Tables 8 and 9). During 60–70 DAS, RWC of cotton leaf was higher (84.8–85.2% and 85.2–85.4% during 2007 and 2008, respectively) under full irrigation (T1) and it was on par with mild water-stressed treatments (T2 and T4) and significantly different from the severe stressed treatments (T3 and T6). Among the DI treatments, the values registered under ADI practices (T2 and T5) were found to be nonsignificant when compared with high irrigation treatments (T1 and T4). Similar trend was also observed at 110–120 DAS. The least values (65.8–64.8% and 66.7–65.4% during 60–70 DAS and 110–120 DAS during 2007 and 2008, respectively) were registered under severely stressed plot (T6). The RLWC values recorded at tasseling and silking stages in maize crop are presented in the Tables 10 and 11, respectively. In general, RLWC was higher at tasseling when compared with silking during both the years. Significantly, more RLWC was noticed under T1 (84.6–85.6 and 83.7–84.8%, respectively, during tasseling and silking) and it was comparable with ADI treatment (T2) and T4. Drip irrigation at 40% ETc once in six days registered the least values (64.5–62.5% and 63.5–61.5%, respectively, during tasseling and silking) next to T3. The values obtained under T3 and T7 were comparable with each other. Although the trend was similar during 2008 and 2009, water stress had more effect in 2009 than in 2008.
Table 8. Effect of deficit irrigation on physiological parameters of cotton during blooming stage (60–70 DAS).
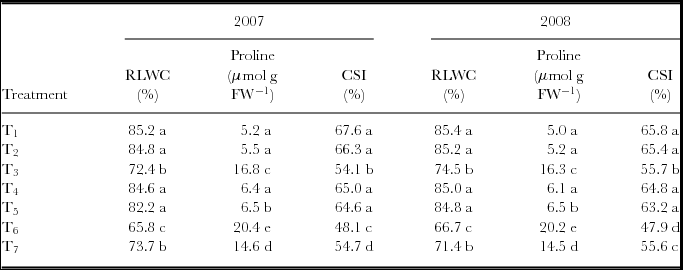
Mean values (n = 3) in columns followed by the same letter are statistically nonsignificant at p < 0.05.
Table 9. Effect of deficit irrigation on physiological parameters of cotton during boll development stage (110–120 DAS).
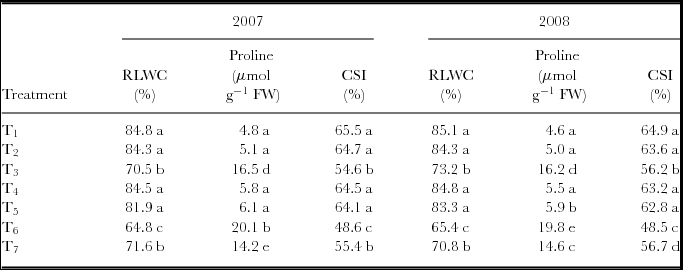
Mean values (n = 3) in columns followed by the same letter are statistically nonsignificant at p< 0.05 level
Table 10. Effect of deficit irrigation on physiological parameters of maize during tasseling (45–55 DAS).
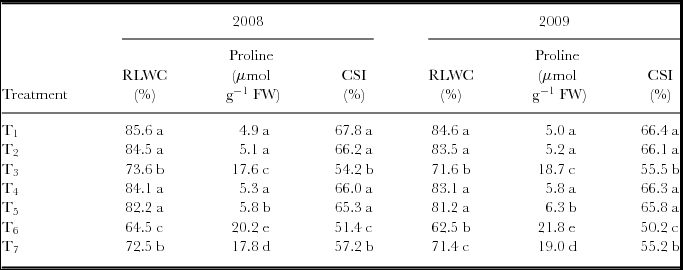
Mean values (n = 3) in columns followed by the same letter are statistically nonsignificant at p < 0.05.
Table 11. Effect of deficit irrigation on physiological parameters of maize during silking (60–70 DAS).
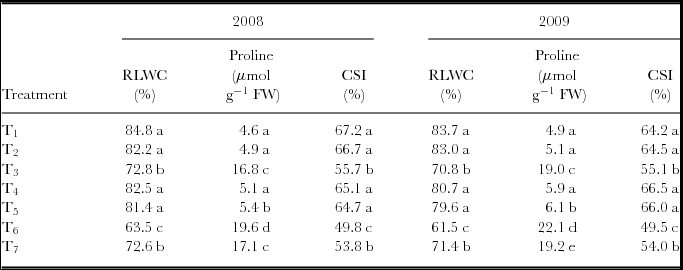
Mean values (n = 3) in columns followed by the same letter are statistically nonsignificant at p < 0.05.
Leaf proline accumulation
Proline accumulation was significantly affected by the irrigation practices in cotton leaf (Tables 8 and 9). Significantly, more values for proline accumulation of 20.4 and 20.2 μmol g FW−1 during 2007 and 2008, respectively, at blooming (60–70 DAS) were observed in severely water-stressed plant (T6) as compared with all the treatments. The same trend was observed (20.1 and 19.8 μmol g FW−1 during 2007 and 2008, respectively) at boll development (110–120 DAS) stage also. The full irrigated plants and mild stressed plants (ADI) accumulated less leaf proline when compared with other stressed plants. Among different DI treatments, difference between ADI practices at lower levels of water applied (T2 and T5) and higher levels of water applied (T1 and T4) treatments were found to be nonsignificant. The same trend was observed in the confirmation trial also. Maize plants subjected to severe water stress (T6) accumulated significantly more proline (19.6 to 20.2 and 21.8 to 22.1 μmol g FW−1, respectively, during 2008 and 2009) at silking and tasseling (Tables 10 and 11). In general, the values were higher during tasseling than silking in both the years. Next to T6, T7 accumulated more proline in leaf and it was comparable with T3 during both the stages and years. The plants grown in CDI at 100% ETc (T1) accumulated lesser (4.6 to 4.9 μmol g FW−1 and 4.9 to 5.0 μmol g FW−1, respectively, during 2008 and 2009) amount of leaf proline when compared with other treatments.
Chlorophyll stability index
Different irrigation practices influenced significantly the CSI of the tested crops. The full irrigated cotton plants (T1) recorded higher values of 67.6% and 65.8%, respectively, during 2007 and 2008 (blooming stage) and 65.5% and 64.9%, respectively, during 2007 and 2008 (boll development stage; Tables 8 and 9). The same was on par with T2 and T4 in all the observations during both the years of experimentation. The least values for CSI were registered in severely water-stressed plants (T3 and T6) and significantly differed from ADI (T2 and T5). However, the values registered under ADI practices (T2 and T5) were found to be nonsignificant when compared with higher irrigation treatments (T1 and T4). The DI practices implemented through drip system significantly affected the CSI of maize (Tables 10 and 11). In general, the values were higher during tasseling than silking in both the years. The values recorded during tasseling were higher than recorded at silking in both the years. The highest CSI (67.8 to 67.2% and 66.4 to 64.2%, respectively, during tasseling and silking in 2008 and 2009) was recorded with drip irrigation at 100% ETc scheduled once in three days (T1), which was comparable with T2, T4 and T5. Drip irrigation at 40% ETc once in six days (T6) registered least values for CSI next to T3.
Economic indicators
Increased income is the driving force for adoption of any technology. The economic indicators, viz. cost of cultivation, income and BCR, were calculated for economic analysis. In general, net income and BCR were higher during 2008 than 2007 (Table 12). Drip irrigation incurred higher costs and recorded significantly higher values for cost of cultivation (INR 29,090 ha−1) than surface irrigation (INR 26,152 ha−1) and there was no significant difference among drip irrigation treatments. Higher seasonal net income was registered under CDI treatment at 100% ETc (INR 65,535 and 67,885 ha−1, respectively, during 2007 and 2008) when compared with other treatments in cotton. The net income reaped under CDI at 100% ETc (T1) was on par with T2 and T4, but significantly differed from other treatments. The reduction in net income was found to be more under severe water-stressed treatments (T3 and T6) and the lowest net income was realized under T6 in both the crops. The surface irrigation treatment (T7) recorded significantly higher values for net income than T3. The BCR also follow the same trend as that of net income, and CDI at 100% ETc (T1) registered the highest values (2.25 and 2.33, respectively, during 2007 and 2008) followed by T2, T4, T5, T7, T3 and T6. Differences between T1, T2 and T4 were found to be nonsignificant for BCR during both the years of experimentation. The lowest BCR was recorded under T6 and it significantly differed from other treatments. The same trend was also observed in 2008.
Table 12. Effect of deficit irrigation on seed cotton yield and economic indicators.

Mean values (n = 3) in columns followed by the same letter are statistically nonsignificant at p < 0.05.
Data pertaining to economical indicators of maize cultivation (Table 13) indicated that the highest net income (INR 34,091 and 33,356 ha−1, respectively, during 2008 and 2009) and BCR (1.48 and 1.45, respectively, during 2008 and 2009) were recorded under CDI at 100% ETc (T1). The cost of cultivation was significantly higher under drip irrigation treatments (INR 23,014 ha−1) than surface irrigation (INR 19,376 ha−1) during both the years of experimentation. Next to T1, ADI at 100% ETc (T2) recorded higher values for net income and BCR and it was on par with T1 and T4 during both the years of experimentation. Severe water-stressed treatments (T6 and T3) reduced the net income and BCR significantly and the lowest values were recorded under T6 compared with other treatments during both the years of experimentation.
Table 13. Effect of deficit irrigation on maize grain yield and economic indicators.

Mean values (n = 3) in columns followed by the same letter are statistically nonsignificant at p < 0.05.
DISCUSSION
Crop yields
Water stress had accumulated effect on crop growth and was finally reflected in crop yields. This was evidenced from the values recorded for critical physiological characters, viz. RLWC, proline accumulation in leaf and CSI of the crops. Present study also showed drastic reduction in seed cotton yield under T6, and the least reduction was noticed for ADI at 100% and 80% ETc with respect to CDI at 100% ETc. The yield increase under CDI at 100% ETc (T1) ranged between 23.1% and 24.8% during 2007 and 2008, respectively, when compared with surface irrigation (T7). Maize grain yield in 2008 was slightly higher than in 2009 because of variability in seasonal rainfall (Table 2). The effect of water stress was apparent in 2009 than 2008, in which maize crop received less rainfall compared with the previous year and this is reflected in higher reduction in grain yield under stressed treatments. However, in 2009, all the treatments experienced water stress at some point during the season, but there was less stress during the first half of the season in 2008. ADI treatments (100% and 80% ETc) maintained grain yield as that of CDI at both the levels (100% and 80% ETc) and the reduction was very little compared with the same. The increment in grain yield under T3 when compared with T7 was due to maintenance of good soil physical conditions even under no till condition under drip irrigation, which favoured the root growth, good RLWC levels and eventually the crop yields. In surface irrigation, root subjected to more resistance due to hard surface soil under no till condition and was reflected in poor crop growth and crop yields.
Alternate deficit irrigation treatment (T2) produced more seed cotton yield than CDI treatment (T4), in which 10 to 20 mm of excess water was applied during both the years and it proved the better performance of ADI practices. Another interesting finding was that CDI once in six days with 50% ETc (T3) produced the same yield as surface irrigation (T7), which consumed 185 to 217 mm more water during 2007 and 2008, respectively. This is mainly because of efficient use of applied water combined with in-season rainfall as evidenced from effective rainfall of 159 and 201 mm during 2007 and 2008, respectively, under T3, which was higher than surface irrigation in 2007 and slightly lower in 2008 (Table 4). Ibragimov et al. (Reference Ibragimov, Evett, Esanbekov, Kamilov, Mirzaev and Lamers2007) reported the same range of seed cotton yield in Uzbekisthan under drip irrigation. Dagdelen et al. (Reference Dagdelen, Basal, Yilmaz, Gurbuz and Akcay2009) also expressed similar effect of water stress on seed cotton yield through drip irrigation. Nesmith and Ritchie (Reference NeSmith and Ritchie1992) also reported severe reduction in maize grain yield due to severe water stress.
Relative leaf water content
The RLWC declined with water deficit and recorded the lowest values in severely stressed treatments. Percentage reduction in RLWC in cotton due to water stress was up to 22.8% and 24.3% (blooming stage) and 23.6 to 23.1% (boll development stage) during 2007 and 2008, respectively. It might be due to unavailability of water in soil or root system, which was not able to compensate for water loss by transpiration through reduction of the absorbing surface. Nonsignificant values recorded under T3 and T7 indicated that intensity of water stress created in both the treatments was almost the same. Plants irrigated with mild DI maintained better levels for RLWC compared with severe stressed plants. The lowest reduction of RLWC 0.47 to 0.23% (blooming stage) and 0.59 to 0.94% (boll development stage) was observed in CDI at 100% ETc during 2007 and 2008, respectively. Severe stressed treatments reduced the RLWC significantly in repeated irrigation cycles, while ADI treatments, in which PRD was imposed (T2 and T5), could quickly recover it to the levels of CDI treatments. Water stress drastically reduced RLWC in maize also and the reduction was from 24.6 to 26.1% (tasseling stage) and 25.1 to 26.5% (silking stage) during 2008 and 2009, respectively. The higher percentage of reduction in RLWC in maize indicated that maize is more sensitive to water stress than cotton. Yang (2001) also reported that when leaf RWC of maize was reduced significantly with the increased degree of water stress, only maize plants subjected to mild water deficit could recover leaf RWC to the level of normal irrigation after resuming well-watered condition. ADI treatments performed better than conventional DI even though lesser water was applied under ADI (T2 and T5) than DI (T4) treatments. This indicated that ADI practice maintained relatively higher soil moisture status when compared with DI. Moreover, ADI treatments maintained good levels of RLWC as compared with DI practices. It might be due to mild water stress imposed through ADI practices that produced lengthier root in both the sides of the plant to extract moisture in soil profile. Under severe stressed treatments (T3 and T6), the root tips lost the capacity to extract soil moisture and resulted in lower RLWC due to continuous skipping of irrigation cycles. Similar views were expressed for many plant species grown under water deficit conditions (Gadallah, Reference Gadallah1995; Sairam, Reference Sairam1994).
Leaf proline accumulation
Proline accumulation in response to stress is widely reported, and may play a role in stress adaptation within the cell. In the present study, both cotton and maize plants recorded wide range of proline content in leaves under water-stressed conditions which indicated that it is one of the key osmolytes contributing towards osmatic adjustment. Proline content of leaves increased with decline in irrigation water, suggesting that the production of proline is probably a common response of crops under water-stressed condition. In this study also water stress imposed through DI and PRD irrigation increased the leaf proline content and the magnitude was higher at severe water-stressed and lower at mild water-stressed treatments. Severely stressed plants had accumulated more than four-fold proline level compared with non-stressed plants. The high level maintenance of water in full irrigation and mild DI prevents accumulation of proline in leaves. Moreover, ADI treatment produced lower values for leaf proline accumulation even at lower rate of applied water compared with normal DI. This was also evidenced from the status of RLWC at ADI practices. This trend clearly indicates that ADI practice had positive effect on crop physiology and reduced the intensity of water stress. Lobato et al. (Reference Lobato, Oliveira Neto, Costa, Santos Filho, Cost, Cruz, Neves and Lopes2008) reported that the accumulation of proline in soybean leaves was increased under water deficit of 67%. Teixeira and Pereira (Reference Teixeira and Pereira2006) also indicated that proline content was significantly increased in all potato organs in response to water stress condition.
Chlorophyll stability index
The higher CSI indicates the better availability of chlorophyll and it leads to increase in photosynthetic rate, dry matter production and high productivity. In this study, cotton and maize plants showed good response to water stress and recorded varied range of CSI values. Severe water stress drastically reduced the CSI compared with full irrigation. Water stress reduced CSI from 28.8 to 27.2% (blooming stage) and 25.9 to 25.9% (boll development stage), respectively, during 2007 and 2008. This might be due to degradation of chlorophyll by producing proteolytic enzymes such as chlorophyllase, which is responsible for degradation. In addition, under water deficit, the cell membrane is subjected to changes, such as increase in penetrability and leakage of cell solutes, which affect the stability of chlorophyll. Microscopic investigations of dehydrated cells revealed damages, including cleavage in the membrane and sedimentation of cytoplasm content (Blackman et al., Reference Blackman, Obendorf and Leopold1995). Maize also responded to water stress with respect to CSI in the same way as the cotton crop. Mild DI imposed under ADI practice maintained relatively higher values compared with full irrigation (CDI practices). The least reductions of 2.3 to 0.4% (tasseling) and 0.7 to 0.5% (silking) were registered under ADI at 100% ETc during 2008 and 2009, respectively. El-Sharkawi and Salama (Reference El-Sharkawi and Salama1977) also observed lower values for CSI under severe water stress condition and explained the cause for the degradation of chlorophyll due to low soil water status. In the present study also severe stressed plants had lower values for CSI, which indicated that chlorophyll is sensitive to water stress and disintegrated at lower RLWC. Kirnak et al. (Reference Kirnak, Kaya, Tas and Higgs2001) also reported that the total chlorophyll content was reduced significantly when compared with the control treatment by damaging cell membrane and resulted in low CSI values in high water-stressed plants.
Economic indicators
The cost of cultivation was higher in drip irrigation treatments than the surface irrigation and it was due the additional cost involved for drip irrigation components. The net income was higher under CDI at 100% ETc treatment (T1) when compared with other treatments for both the crops. It was mainly due to increased seed cotton yield achieved due to favourable growth and development of crop. The BCR also followed the same trend as that of net income. The reasons attributed to net income also hold good for BCR. The lowest net income was obtained in T6 followed by T3. Therefore, T6 was found to be less profitable than other treatments. ADI at 100% and CDI at 80% resulted in marginal reduction for net income than CDI at 100% ETc (T1). In maize also the cost of cultivation was higher in the drip irrigation system (INR 23,014 ha−1) when compared with surface irrigation (INR 19,376 ha−1) due to initial investment of drip system as added additional cost. In general, net income was more during 2008 than 2009 because of comparatively higher yield in all the treatments in 2008. Conventional drip irrigation at 100% ETc recorded the highest net income and BCR than other treatments. The increased yield under T1 resulted in the highest net income. Difference between T3 and T7 was found to be nonsignificant for crop yields, but this did not reflected in BCR values. The BCR values recorded under T7 were higher than those under T3 for both the crops during both the years of experimentation. This was due to additional cost of drip components incurred under T3. The net income realized in severe stressed treatment (T6) was lesser and the reduction was 64.8% and 66.5%, respectively, during 2008 and 2009 when compared with T1. Next to T1, ADI registered higher values for economical indicators. Therefore, under limited water conditions, ADI would be a reasonable option, and with sufficient water source, T1 would be an appropriate approach to achieve more economic yield and net income. Above all, the net income from T1 was found to be reasonable in areas with no water shortage. In regions where access to the irrigation water was costly or water supply was less than demanded, ADI at 100 and 80% ETc or CDI at 80% ETc was found to be a reasonable technology. Similar relationship was also obtained by Gencoglan et al. (Reference Gencoglan, Gencoglan, Kırnak, Akbay and Boz2005) and Dagdelen et al. (Reference Dagdelen, Basal, Yilmaz, Gurbuz and Akcay2009).
Difference between ADI practices at lower levels of water applied (T2 and T5) and higher level of water applied through conventional DI (T1 and T4) was nonsignificant for the observed physiological characters. The ADI practice reduced the effect of water stress on both the crops comparatively even under lesser amount of irrigation water.
CONCLUSIONS
Drip irrigation maintained favourable soil physical properties for the second crop raised without any tillage practices and disturbance to the existing drip layout. The results of the study showed that imposing wide ranging of water stress had profound effect on crop productivity and physiology when compared with full irrigation. Response of the crops to water stress indicated that crop yields were higher in mild water deficit (ADI at 100% ETc and CDI at 80% ETc once in three days) among different DI treatments. Among DI practices, mild deficit (ADI at 100% ETc and CDI at 80% ETc once in three days) recorded higher values for seed cotton yield (3670 to 3760 kg ha−1) and grain yield of maize (7420 to 7590 kg ha−1). The same mild stressed treatments recorded higher net income and BCR for cotton and maize. Cotton and maize crops recorded relatively the same range of values for physiological parameters under water stress for both the years of experimentation. Response of cotton and maize plants to water stress on physiology parameters indicated that plants under severe water stress recorded fewer values for RLWC and CSI and higher value for leaf proline content. Mild water DI maintained higher values for RLWC and CSI, while lower values for leaf proline in cotton and maize plants. The same mild water deficit is the optimal DI schedule in terms of high crop productivity and net income for cotton–maize cropping sequence. Under limited water conditions, ADI at 100% ETC or CDI at 100% ETc may be a reasonable option, but with sufficient water source, CDI at 100% ETc could be an appropriate approach to achieve more economic yield and net income. This study also helped to explore the benefits of PRD through implementing ADI practices in cotton and maize crops.


