


The European pharmacopoeia defines bentonite as a natural clay containing a high proportion of montmorillonite, a native hydrated aluminium silicate in which some aluminium and silicon atoms can be replaced by other atoms, such as magnesium or iron (Council of Europe, 2003). Bentonite is practically insoluble in water but swells to ~12 times its original volume to produce viscous, homogeneous suspensions or gels depending on its concentration (Nutting, Reference Nutting1943; Gattermann et al., Reference Gattermann, Wittke and Erichsen2001; Council of Europe, 2003; Gökalp et al., Reference Gökalp, Başcsaran and Uzun2011; USP-35, 2011). Montmorillonite, which is the main component of bentonite, consists of layers of negatively charged sheets held together by charge-balancing counterions such as Na+ and Ca2+. These cations tend to become hydrated in the presence of water, pushing the layers away from each other in a series of discrete steps (Van Olphen, Reference Van Olphen1953; Boek et al., Reference Boek, Coveney and Skipper1995). The hydrated aluminium silicates are not absorbable into the blood (Willhite et al., Reference Willhite, Ball and McLellan2012; Sharma et al., Reference Sharma, Mortensen, Schmidt, Frandsen, Hadrup, Larsen and Binderup2014), and according to Section 184.1155 in the federal code of Regulation 21 of the US Food and Drug Administration (FDA), bentonite is considered safe, can be used as an additive in its pure form and is appropriate for its intended use in food without limitation (FDA, 2021).
Bentonite has many advantages in terms of pharmaceutical and biomedical applications, such as its ability to improve organoleptic qualities, its solubility, stability and ability to protect the skin from external physical harm (Hun Kim et al., Reference Hun Kim, Choi, Elzatahry, Vinu, Bin Choy and Choy2016).
Many challenges associated with oral drug delivery systems can be resolved by formulating modified-release or targeted-release dosage forms (Bechgaard & Nielsen, Reference Bechgaard and Nielsen1978; Chen et al., Reference Chen, Wen and Park2010; Agarwal et al., Reference Agarwal, Agarwal, Karar and Goyal2017). The development of sustained-release formulations involves several challenges related to the cost of polymers, the complexity of the process, drug dumping and loading capacity (Chen et al., Reference Chen, Wen and Park2010; Wen & Park, Reference Wen and Park2011). Therefore, simple and cost-effective alternative strategies are needed.
Gel-forming hydrophilic polymers such as hydroxypropyl methylcellulose (HPMC) are employed often in preparing sustained-release tablets (Gao et al., Reference Gao, Nixon and Skoug1995; Chakraborty et al., Reference Chakraborty, Pandit and Srinatha2009; Cao et al., Reference Cao, Choi, Liu, Xu, Yang, Lee and Cui2013). The viscosity of cellulose derivatives such as HPMC varies depending on the degree of substitution. Furthermore, their solubility and gelation are temperature-dependent. Gel-forming polymers swell in the presence of water, meaning that a large quantity of the drug can be released immediately. Therefore, their sustained-release behaviour may become compromised (Ghosal et al., Reference Ghosal, Chakrabarty and Nanda2011).
Bentonite as a gel-forming matrix system is considered less expensive than other gel-forming polymers, including HPMC. The use of clay minerals such as bentonite and kaolinite in developing sustained-release dosage forms has been reported in many studies (e.g. Alkrad et al., Reference Alkrad, Abu Shmeis, Alshwabkeh, Abazid and Mohammad2017; Li et al., Reference Li, Wang, Liu, Xu, Zhou and Wang2021). The basic pH of bentonite makes it able to improve the absorption of class II drugs, such as IB, by increasing their solubility (Tantishaiyakul, Reference Tantishaiyakul2004). In addition, bentonite increases the stomach pH level, which can decrease the stomach emptying time (Chaw et al., Reference Chaw, Yazaki and Evans2001). This can improve patient compliance by reducing the residence time of the drugs in the stomach. The expected reduction in residence time can reduce the irritating effects of these drugs on the stomach. However, employing bentonite in the development of high-load drugs, such as ibuprofen (IB), in enteric-coated sustained-release tablets has not been explored previously.
Due to the added value of bentonite having a known biocompatibility profile and safety profile, its cost-effectiveness and its potential to improve patient compliance, this study aimed to investigate the use of bentonite for preparing compendial sustained-release 800 mg IB tablets as a high-dosing drug by employing a multi-particulate system made of bentonite matrix and studying the release kinetics of the drug from the developed tablets.
Materials
IB was received as a gift from United Pharmaceuticals Company Ltd (Amman, Jordan). Methanol and acetonitrile (high-performance liquid chromatography (HPLC) grade) were purchased from Honeywell Research Chemicals (Seelze, Germany). Microcrystalline cellulose (MCC; Avicel® 102) was purchased from FMC Corp. (Brussels, Belgium). Monobasic dihydrophosphate (KH2PO4) and magnesium stearate were purchased from Scharlau Chemicals (Barcelona, Spain). Pharmaceutical-grade bentonite (sodium–calcium bentonite), polyvinylpyrrolidone (PVP-40T) and polyethylene glycol 4000 (PEG-4000) were purchased from Sigma-Aldrich (Steinheim, Germany). Sodium hydroxide, glacial acetic acid and sodium acetate were purchased from Merck (Darmstadt, Germany).
Experimental
Granulation and tableting
IB powder was sieved through a 45 μm sieve after milling using a pestle and mortar. The required amounts of bentonite, binder and IB were weighed and mixed thoroughly using a pestle and mortar. Three binders were investigated, including MCC (5–10%), PEG-4000 (5–10%) and starch (10%). Tablets without binders were also prepared. HPMC is a gel-forming binder, and polymers used often in formulating sustained-release tablets were excluded from this study to prevent them from having any influence on the results (Gao et al., Reference Gao, Nixon and Skoug1995; Ghosal et al., Reference Ghosal, Chakrabarty and Nanda2011; Cao et al., Reference Cao, Choi, Liu, Xu, Yang, Lee and Cui2013). The amount of each component was calculated based on a final tablet weight of 1400 mg containing a constant amount of IB (800 mg). Magnesium stearate was mixed with granules as a lubricant at a concentration of 1% w/w. Table 1 presents the percentages (w/w) of each ingredient.
Table 1. Summary of the compositions of various IB-loaded sustained-release tablets.

Wet granulation
The powder blend was sprayed with a sufficient amount of granulating liquid (water) for wet massing. Then, the wet mass was forced through a 350 μm sieve to form the granules. The obtained granules were placed on a stainless-steel tray and dried in a hot-air oven at 56°C for 12–14 h. Finally, the dry granules were passed through a 250 μm sieve.
Dry granulation
The large tablets were prepared from a mixture of IB and MCC milled using a pestle and mortar and then passed through a sieve with an aperture size of 355 μm. The prepared granules were mixed with 1% magnesium stearate before manual compression in a 13 mm die to obtain IB tablets using an AR 400E single-punch tableting machine made by Erweka (Heusenstamm, Germany).
Granule flowability measurement
An approximate volume of 20 g of the prepared granules was obtained from a 25 mL measuring cylinder. The powder volume was measured using the same measuring cylinder after tapping the cylinder 50 times or until a fixed volume was attained. The bulk density of the powder was calculated by dividing the weight of the powder by its volume, whereas the tapped density was calculated by dividing the weight of the powder by its volume after tapping. Three replicated measurements were performed following the guidelines of the US Pharmacopeia (USP-35, 2011). Carr's compressibility index (CCI) and the Hausner ratio (HR) were calculated according to Equations 1 & 2 (USP-35, 2011):


Measuring friability
The friability of the prepared tablets was determined using 10 IB tablets. The tablets were weighed accurately before placing them in the friability tester (Erweka TAR20, Heusenstamm, Germany). The device was set at 25 rpm for 4 min. The discs were removed, and the tablets were reweighed accurately after dedusting and careful evaluation of their integrity. Friability was calculated using Equation 3 (USP-35, 2011):

where W I is the initial weight of the tablets and W F is their weight after the friability test.
Measurement of tablet hardness
The hardness of the prepared tablets was measured using an Erweka TBH30 tablet hardness tester (Heusenstamm, Germany). Each test was performed on six tablets.
Fourier-transform infrared spectroscopy analysis
A Fourier-transform infrared (FTIR) spectrometer (PerkinElmer UATR Two, Li600301, Beaconsfield, UK) was used to predict the compatibility between IB and bentonite. The spectra of IB, bentonite, water, the physical mixture of bentonite and IB and the prepared granules (IB + bentonite) were measured between 450 and 4000 cm–1 to evaluate any change in the spectra after granulation or in the mixture.
Differential scanning calorimetry measurements
A differential scanning calorimeter (DSC; Model 204 F1 Phoenix, Netzsch-Gerätebau GmbH, Selb, Germany) was used to record the thermograms of the mixture of bentonite and IB. The thermograms were measured in triplicate between 25°C and 300°C under a dry nitrogen flow of 20 mL min–1 at a heating rate of 10°C min–1. DSC calibration was performed using indium.
X-ray powder diffraction
The X-ray powder diffraction (XRD) traces of bentonite powder and the milled granules of bentonite with IB were obtained using a Shimadzu XRD-7000 diffractometer (Kyoto, Japan) equipped with monochromatic Cu-Kα radiation and a fixed power source (40 KW, 30 mA) with λ = 1.5406 Å. The scan rate was 0.5°2θ min−1. The basal spacing (d 100) of bentonite alone or with the IB mixture was calculated using Bragg's law (Haoue et al., Reference Haoue, Derdar, Belbachir and Harrane2020) and Equation 4 to assess whether the blending process caused substantial changes in the lamellar layers of the bentonite crystal structure:

where d is the calculated basal spacing (d 001) measured in Å, λ is the X-ray wavelength, n is the diffraction order (n = 1 in the case of first order) and θ is Bragg's angle in degrees.
Dissolution test
The dissolution test was performed using a USP II dissolution apparatus (SR6, Hanson Research, CA, USA) by measuring the amount of drug released from the tablets over 24 h at a rotation speed of 50 rpm and a temperature of 37 ± 0.1°C. The dissolution medium was made of 900 mL of phosphate buffer (pH 7.2; USP-35, 2011). Samples were removed (2 mL) at the following time intervals: 1, 2, 3, 4, 5, 6, 7, 8, 16, 20 and 24 h. Samples were filtered using a 0.45 μm membrane filter before determining the amount of dissolved drug using the corresponding HPLC method.
HPLC assay
The released drug amount was quantified using a Thermo Scientific chromatographic system (Dionex Ultimate 3000 HPLC, Germering, Germany) connected to a diode array detector. A 10 μL injection volume was separated through a 250 × 4.6 mm C8 column (Nanologica, Södertälje, Sweden). The mobile phase used to quantify IB was composed of 5 mL L–1 glacial acetic acid in HPLC-grade water and acetonitrile (50:50). IB was pumped at a flow rate of 2 mL min–1 to detect IB at a wavelength of 230 nm.
Enteric coating using EUDRAGIT®
The tablets were sub-coated using Opadry-28900 (Colorcon, PA, USA). The percentage of sub-coat was 3% of the weighed tablets. A 12.5% EUDRAGIT® L 30 D-55 suspension (Evonik Rhon GmbH, Steinau an der Straße, Germany) was used for enteric coating of the tablets. The aqueous suspension was composed of 1% triethyl citrate (plasticizer) and 5% talc (anti-tacking) plus the polymer. The tablet coater setup was as follows: nozzle bore: 1.2 mm; distance from nozzle to product: 10 cm; and internal silicone tube diameter: 2 mm. The coating was performed using a HI-Coater system (Freund-Vector, IA, USA) and according to the technical information for EUDRAGIT® L 30 D-55 for top spraying on 1 kg of tablets (Evonik, 2021). The processing parameters were as follows: atomizing air pressure: 1.8 bar; filter rattling time: 5 s; filter rattling interval: 30 s; drying air volume: 90 m3 h–1; and drying air capacity of 1.5 m3 (min kg–1)–1. The inlet air temperature was set at 40°C, the exhaust air temperature was set at 28°C, the product temperature was set at 28°C and the spray rate was set at 15 g (min kg–1)–1.
Evaluation of enteric-coated tablets
Three tablets from each enteric-coated tablet type were immersed in 0.1 N HCl solution as a dissolution medium. The apparatus was run at a rate of 50 rpm and a temperature of 37 ± 0.1°C. A sample from each vessel was removed after 2 h to guarantee the acid resistance of the coating by testing whether the drug was released from the coat in the acidic medium (USP-35, 2011). Then, the HCl solution was replaced by pH 7.2 phosphate buffer, and the samples were then assessed for IB drug release over 24 h.
Release kinetics modelling and statistical evaluation
The release data of IB up to 16 h (after releasing ~60% of the total amount of the drug from the formulated tablets) were used to determine the most appropriate model from four kinetic models by estimating the correlation coefficients (R 2). The first model was the zero order release model. This model describes the independent drug-release concentration at a constant rate from modified-release tablets. The correlation was obtained by plotting the cumulative released amount (Q) against time (t) as in Equation 5 (Narashimhan et al., Reference Narashimhan, Mallapragada, Peppas and Mathiowitz1999; Dash et al., Reference Dash, Murthy, Nath and Chowdhury2010; Bruschi, Reference Bruschi2015a):

where Q 0 is the initial concentration of the active ingredient that is released at t = 0 (generally, Q 0 = 0) and K0 is the zero order constant.
The second model was the first order model. This relationship could be used to describe drug dissolution in pharmaceutical dosage forms such as those containing water-soluble drugs in porous matrices. The data were obtained by plotting the log cumulative released amount of drug (logQ) vs t using Equation 6 (Narashimhan et al., Reference Narashimhan, Mallapragada, Peppas and Mathiowitz1999; Dash et al., Reference Dash, Murthy, Nath and Chowdhury2010):

where Q 0 is the initial concentration of the active ingredient released at t = 0 (generally, Q 0 = 0) and K is the first-order constant.
The third model was the Higuchi model (Bruschi, Reference Bruschi2015b). The Higuchi model was applied to describe the diffusion pattern of a saturated drug in a liquid form compared to the release of a drug contained in a porous matrix. This model proposed that the matrix was non-swellable and that the diffusivity from this matrix was constant. The correlation coefficient was calculated for the cumulative released amount (Q) against the square route of t as per Equation 7:

where KH is the release constant of Higuchi.
The fourth model was the Korsmeyer–Peppas model. This model describes the release of a drug molecule from a polymeric matrix, such as a hydrogel. The correlation coefficient and the value of the exponent (n) were calculated for ln(percentage of cumulative released amount (${{M_i} \over {M_\infty }}$ )) against lnt (Koros & Punsalan, Reference Koros, Punsalan, Buschow, Cahn, Flemings, Ilschner, Kramer, Mahajan and Veyssière2001) as per Equation 8:

where M ∞ is the total amount of drug contained in the dosage form, M i is the amount of released drug at time t, n is the exponent of release, which can reflect the drug-release mechanism of the drug, and K is a constant of the geometrical and structural properties of the dosage form, and it is also considered as the release velocity constant (Bruschi, Reference Bruschi2015b). The measurements were repeated three times to estimate the means and standard deviations.
Statistical analysis
Statistical analysis was performed using Minitab statistical software (v. 18 statistical pack; Pennsylvania State University, PA, USA). The level of significance was set at p < 0.05.
Results
HPLC method and calibration curve
A calibration curve for IB was established for concentrations ranging between 0.05 and 0.80 mg mL–1. The calibration curve showed a correlation coefficient (R 2) of 0.999 and a regression standard deviation of 4.03% (Fig. 1a). The ratio of the height of the peak of the lowest concentration (0.05 mg mL–1) to the height of the peak of the noise was much greater than 9, indicating that the detection limit was much lower than 0.05 mg mL–1 (Council of Europe, 2003; ICH, 2005).

Fig. 1. Chromatograms of released IB from the tablets (1) after 1 h, (2) after 2 h, (3) after 3 h, (4) after 4 h, (5) after 5 h, (6) after 6 h and (7) after 20 h. (a) HPLC and (b) calibration curve.
Flowability of granules
Using bulk density and tapped density, the CCI and HR are estimated and tabulated in Table 2 according to Equations 2 and 3, respectively. The measured flowability of the physical mixture of IB and bentonite as shown in Table 2 (CCI values and the corresponding HRs were 29.17 ± 1.1 and 1.41 ± 0.047, respectively) revealed the poor flowability of this mixture. On the other hand, Table 2 shows that the CCI values and the corresponding HRs for the various prepared granules were less than 16% and 1.2, respectively. Hence, the flowability was improved after granulation (USP-35, 2011). Despite a statistically significant difference between CCI and HR among the various formulations (one-way analysis of variance (ANOVA), p < 0.001 for both), flowability was appropriate for all formulations.
Table 2. Calculated flowability results using CCI and the HR for all of the prepared formulations (mean ± SD, n = 3).

FTIR spectra evaluation
The FTIR spectra of the various pure components, granules and hydrated IB tablets are presented in Fig. 2.

Fig. 2. FTIR spectra of pure IB, bentonite, water, granules of IB and hydrated granules of IB without binder.
A broad band at wavenumbers between 3000 and 3700 cm–1 and a band that appeared at 1638 cm–1 were detected in the FTIR spectrum of water and were related to O–H stretching and bending vibrations, respectively. The FTIR spectrum of bentonite powder showed a sharp band at 1028 cm−1, which was probably related to the stretching vibrations of Si–O in the Si–O–Si groups of the tetrahedral sheet. Additionally, the bands at 480 and 521 cm−1 were produced by Si–O–Al (octahedral sheet) and Si–O–Si bending vibrations, respectively. Moreover, the stretching O–H water band at 3000–3700 cm–1 was observed in the dried granules, indicating the presence of some moisture in the granules after drying. Furthermore, the intensity of this band and H2O bending vibration at 1638 cm–1 increased in the hydrated bentonite tablets, whereas the intensity of the band of the stretching vibrations of Si–O in the Si–O–Si groups at 1028 cm−1 were reduced after the addition of water, indicating the presence of water between the bentonite sheets (Senturk et al., Reference Senturk, Ozdes, Gundogdu, Duran and Soylak2009; Tabak, Reference Tabak2009; Youssef et al., Reference Youssef, Al-Awadhi and Akl2014). The FTIR spectrum of IB presented in Fig. 2 also showed characteristic bands at 2946, 1734, 1251 and 780 cm–1 for CH3 stretching, C=O stretching, =C–H in-plane deformation and CH2 rocking, respectively (Mallick et al., Reference Mallick, Pattnaik, Swain, De, Saha, Mazumdar and Ghoshal2008; Ramukutty & Ramachandran, Reference Ramukutty and Ramachandran2012). However, the FTIR spectra of IB in the dry and hydrated granules (Fig. 2) showed all of the characteristic bands related to IB without any shifts in their positions. A reduction in the intensity of the peaks could be attributed to the dilution effect of IB in the IB–bentonite granules. Based on the above results, it was concluded that there was no evidence of any chemical interaction between IB and bentonite. Therefore, IB was compatible with bentonite in the used formulations.
DSC measurements
DSC thermograms were obtained to identify any possible interactions between IB and bentonite in their physical mixture. The measured thermograms are represented in Fig. 3. The thermograms showed endothermic peaks at temperatures between 75°C and 89°C for IB, which agreed with previously published works in the literature (Tudja et al., Reference Tudja, Khan, Meštrovic, Horvat and Golja2001; Wahab et al., Reference Wahab, Khan, Akhlaq, Khan, Hussain, Zeb and Shah2011). Furthermore, there were no significant changes in the peaks of the thermograms of pure IB in comparison with the peaks of the drug mixture with bentonite. Hence, there was no potential interaction between bentonite and IB.
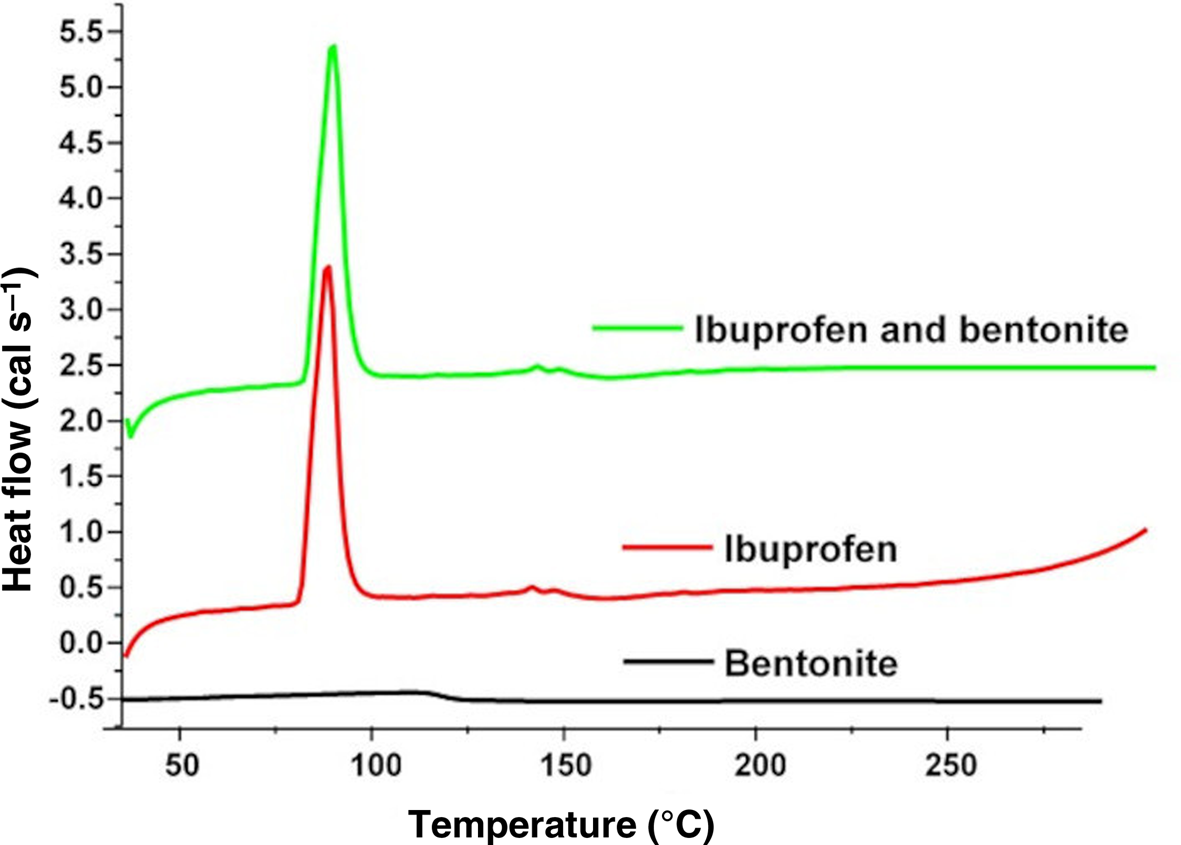
Fig. 3. DSC thermograms of bentonite, pure IB and a physical mixture of bentonite with IB.
XRD measurements
The XRD traces obtained of pure bentonite and milled granules of IB in bentonite with a range of 2–100° are given in Fig. 4. The XRD trace of bentonite (Fig. 4) showed that bentonite was composed of montmorillonite (Si374Al2O3Fe0.03Mg0.02O11) as a major component, cristobalite (SiO2), albite (NaAlSi3O8) as a feldspar mineral and microcline (KAlSi3O8) as a feldspar mineral with various structures rather than albite (Ikhtiyarova et al., Reference Ikhtiyarova, Özcan, Gök and Özcan2012; Macías-Quiroga et al., Reference Macías-Quiroga, Giraldo-Gómez and Sanabria-González2018). In addition, Fig. 4 shows that the XRD trace of bentonite did not change in its crystallinity after granulation with IB except for a slight shift in the montmorillonite peaks to a lower degree. This may be related to the increase in the lattice spacing of montmorillonite crystals due to the drugs intercalated in the interlayers of montmorillonite (Pergher et al., Reference Pergher, Oliveira and Alcântara2017). Therefore, no significant change in the crystalline structure of bentonite due to the granulation process of IB with bentonite was observed. Using Bragg's equation (Equation 4), the basal spacing (d 001) was calculated for bentonite at 7.58°2θ and 5.98°2θ for bentonite–IB granules. The calculated basal spacing value for bentonite was 11.654 Å, whereas the granules had a basal spacing value of 14.768 Å. The basal spacing for bentonite, particularly montmorillonite, is in agreement with previously published results (Karaborni et al., Reference Karaborni, Smit, Heidug, Urai and Van Oort1996; Matusewicz et al., Reference Matusewicz, Pirkkalainen, Liljeström, Suuronen, Root and Muurinen2013). The slight increase in basal spacing upon granulation with IB could be attributed to the increase in lattice spacing, as discussed earlier. Additionally, Kalaleh et al. (Reference Kalaleh, Tally and Atassi2013) reported that the increase in basal spacing could be attributed to the formation of hydrogen bonds between IB and bentonite and any water molecules that remain after granulation.

Fig. 4. XRD traces of bentonite and bentonite–IB granules.
Quality control of tablets
The hardness and friability of the tablets were measured after tablet compression. The mean values along with the standard deviations were calculated and are presented in Table 3.
Table 3. Hardness and friability results for the prepared IB-loaded tablets (mean ± SD).

The results in Table 3 show that the friability decreased with increasing MCC and PEG-4000 concentrations from 5 to 10% w/w. In addition, binder-free tablets demonstrated greater hardness in comparison to the prepared tablets with binders. One-way ANOVA of the results regarding the hardness of various formulations showed that there were significant differences among the formulations (p < 0.001). The results also revealed a correlation between the hardness and the friability results. However, the friability for all of the prepared formulations was <0.5%, which is in accordance with the pharmacopeial requirements.
Release profiles of the coated and uncoated tablets
MCC, PEG-4000 with concentrations of 5% and 10% and starch with a concentration of 10% were used as binders for preparing 800 mg IB tablets. Formulations of IB and bentonite were prepared from granules made without any binder addition. The released amounts of IB in the dissolution vessel were estimated over 24 h using the corresponding HPLC method (Fig. 1b). The dissolution profiles of the various prepared tablets were established by plotting the percentage of the cumulative amount of IB released against time (Fig. 5a,b).

Fig. 5. (a) Dissolution profiles of the IB tablets prepared using wet granulation with free binder (IB–W), 5% MCC (IB–MCC5), 10% MCC (IB–MCC10) and dry granulation 10% MCC (IB–MCC10dry). (b) Dissolution profiles of the IB tablets prepared using wet granulation with 5% PEG (IB–PEG5), 10% PEG (IB–PEG10) and 10% starch (IB–starch10). (c) Dissolution profiles of the enteric-coated IB–MCC5 and enteric-coated IB–W tablets. Values are means of three experimental runs ± SD.
To mimic the transit of formulated tablets through the gastrointestinal tract, the uncoated tablets prepared via granulation were tested for dissolution in 0.1 N HCl at various time intervals. The immersed tablets did not withstand HCl. Hence, the tablets had to be protected from HCl with enteric coating. The two types of IB tablets – namely IB–MCC5 and IB–W (without binder) – that showed greater linearity in their release profiles were selected for enteric coating. The coated tablets were subjected to 0.1 N HCl for 2 h (USP-35, 2011). Samples of 2 mL were taken from the acidic media after 2 h to test the amount of released IB and hence the resistance of the enteric coating to the acidic media. Then, the acidic media were replaced by a pH 7.2 phosphate buffer, and the sampling continued for 24 h. Overall, IB was not detected after 2 h in the dissolution medium (acidic medium); therefore, the enteric coating of the formulated tablets maintained its integrity and did not disintegrate in the acidic media. These results are presented in Fig. 5c.
The next stage focused on modelling the release profiles. The correlation coefficients (R 2) for released IB from the prepared tablets were estimated for each of the zero order, first order, Higuchi and the Korsmeyer–Peppas models, and these results are presented in Table 4.
Table 4. Correlation coefficients of the percentage of cumulative released amount of IB against time for the Higuchi model, logarithm of the percentage of cumulative released amount of IB against time in terms of the first-order model, the zero-order model and the Korsmeyer–Peppas model.

The release modelling results indicated that the greatest correlation coefficients were observed for the Korsmeyer–Peppas model, followed by the zero-order model and then the Higuchi model, while the lowest determined coefficients were for the first-order model. However, the estimated n values of the Korsmeyer–Peppas model for IB–PEG5, IB–MCC5 and IB–starch10 were close to 1. On the other hand, the IB–W (without binder), enteric-coated, IB–PEG10 and IB–MCC10 (binder concentration of 10%) showed n values between 1.12 and 1.35. Furthermore, K, which is the release rate constant, was calculated from the intercept of the Korsmeyer–Peppas equation (Equation 8). The results in Table 4 showed that the rate constants were low from enteric-coated tablets and form binder-free tablets (IB–W). On the other hand, K was greatest from tablets prepared using MCC via dry granulation. This means that the release was slower from the enteric-coated tablets and from binder-free tablets (IB–W) in comparison to the other formulated tablets. Furthermore, the estimated intercept values of the zero order equation model were negative in the cases of enteric-coated tablets and binder-free tablets, whereas these were greatest in the case of tablets prepared using MCC via dry granulation, which corroborates the results mentioned previously regarding the release rate constant showing that the intercept of the zero-order equation model refers to the initial amount released.
Discussion
In many previous studies, bentonite was not used solely to produce a sustained-release formulation of the incorporated drugs. Pergher et al. (Reference Pergher, Oliveira and Alcântara2017) investigated the incorporation of olanzapine into montmorillonite dispersed in a mixture of alginate and xanthan gum biopolymers to achieve a controlled-release profile. Additionally, García-Guzmán et al. (Reference García-Guzmán, Medina-Torres, Calderas, Bernad-Bernad, Gracia-Mora, Mena and Manero2018) used a blend of a gelatin carrier and montmorillonite to evaluate its capability as a controlled drug delivery system for atorvastatin. In addition, Joshi et al. (Reference Joshi, Kevadiya and Bajaj2010) prepared sustained-release ranitidine tablets using montmorillonite as a carrier via an ion-exchange approach. Dziadkowiec et al. (Reference Dziadkowiec, Mansa, Quintela, Rocha and Detellier2017) reported that the preparation of an IB–salt-loaded nanocomposite from bentonite and neutral guar gum that released IB in a controlled manner. Similarly, Alkrad et al. (Reference Alkrad, Abu Shmeis, Alshwabkeh, Abazid and Mohammad2017) used 50% mixtures of bentonite with various drugs to study their release behaviour from prepared tablets by direct compression. The blends produced had poor flowability, which was considered the main limitation of the direct compression method (Timmins et al., Reference Timmins, Delargy, Howard and Rowlands1991; Aulton & Taylor, Reference Aulton and Taylor2013; Franc et al., Reference Franc, Vodáčková, Kubal’ák, Jendryková and Goněc2018). Hence, the current investigation was designed to granulate bentonite before compression to improve flowability and enable the large-scale production of IB–bentonite tablets.
FTIR spectroscopy, thermal analysis using DSC and XRD analysis did not reveal any changes to IB after its mixing with bentonite. Both IB and bentonite retained their characteristic features upon formulation. Consequently, bentonite was a compatible ingredient with the granulated drug in this study. By employing wet granulation, the reported poor flowability of bentonite was improved in the current investigation, thus eliminating the main disadvantage of preparing sustained-release tablets using bentonite (Gao et al., Reference Gao, Nixon and Skoug1995). Solid bridges represented the main force that remained between the particles in the dry granules. These was attributed to the hardening process of the binder or recrystallization of the dissolved materials upon drying of the wet granules (Olsson & Nyström, Reference Olsson and Nyström2001; Aulton & Taylor, Reference Aulton and Taylor2013). However, the granules of IB and bentonite could be formulated using water alone without any additional binder. The binding force between these particles in dry granules is probably attributable to solid bridges being formed by the recrystallization of the dissolved materials in water.
The produced granules had good flowability, as the granules had greater weight and less specific surface area than separate particles. Furthermore, the hardness of the compressed granules was great, and this provided the tablets with sufficient mechanical strength to prevent rapid disintegration upon contact with the buffer (Saravanan et al., Reference Saravanan, Nataraj and Ganesh2002). The mechanical strengths of the various tablets with or without binder were comparable. The mechanical strength was even greater in the case of IB tablets without any binder. The key binding forces within the formulated tablets could be attributed to the interactions between bentonite particles. Several studies have reported the good compactability of bentonite (e.g. Gattermann et al., Reference Gattermann, Wittke and Erichsen2001; Gökalp et al., Reference Gökalp, Başcsaran and Uzun2011). Moreover, the compacted commercial granulated clay mineral (magnesium aluminium smectite; gMgSm) showed good cohesive strength and greater porosity after compression than MCC; hence, it could be used to formulate tablets (Laity et al., Reference Laity, Asare-Addo, Sweeney, Šupuk and Conway2015).
Furthermore, the results from the release studies revealed that the employed binders did not influence or slow the release through the gel matrix of the tablets prepared using the wet or dry granulation process in comparison to tablets prepared without any binder. Statistical analysis of the release profile of the formulations showed that there was no significant difference between the formulations in terms of their release patterns (one-way ANOVA, p = 0.9277). In addition, the results shown in Tables 3 & 4 indicate that the increase in hardness did not lead to a slowing of the release of IB.
Visual observation of the tablets during the dissolution test (Fig. 6) indicated that bentonite forms a gel structure in dissolution media at pH 7.2, whereas the tablets disintegrated at less acidic pH values, which could be related to the dissolution of montmorillonite at low pH and itself was responsible for gel-building in bentonite (Bendou & Amrani, Reference Bendou and Amrani2014; Mouzon et al., Reference Mouzon, Bhuiyan and Hedlund2016; Alkrad et al., Reference Alkrad, Abu Shmeis, Alshwabkeh, Abazid and Mohammad2017; González-Santamaría et al., Reference González-Santamaría, Fernández, Ruiz, Ortega and Cuevas2020).
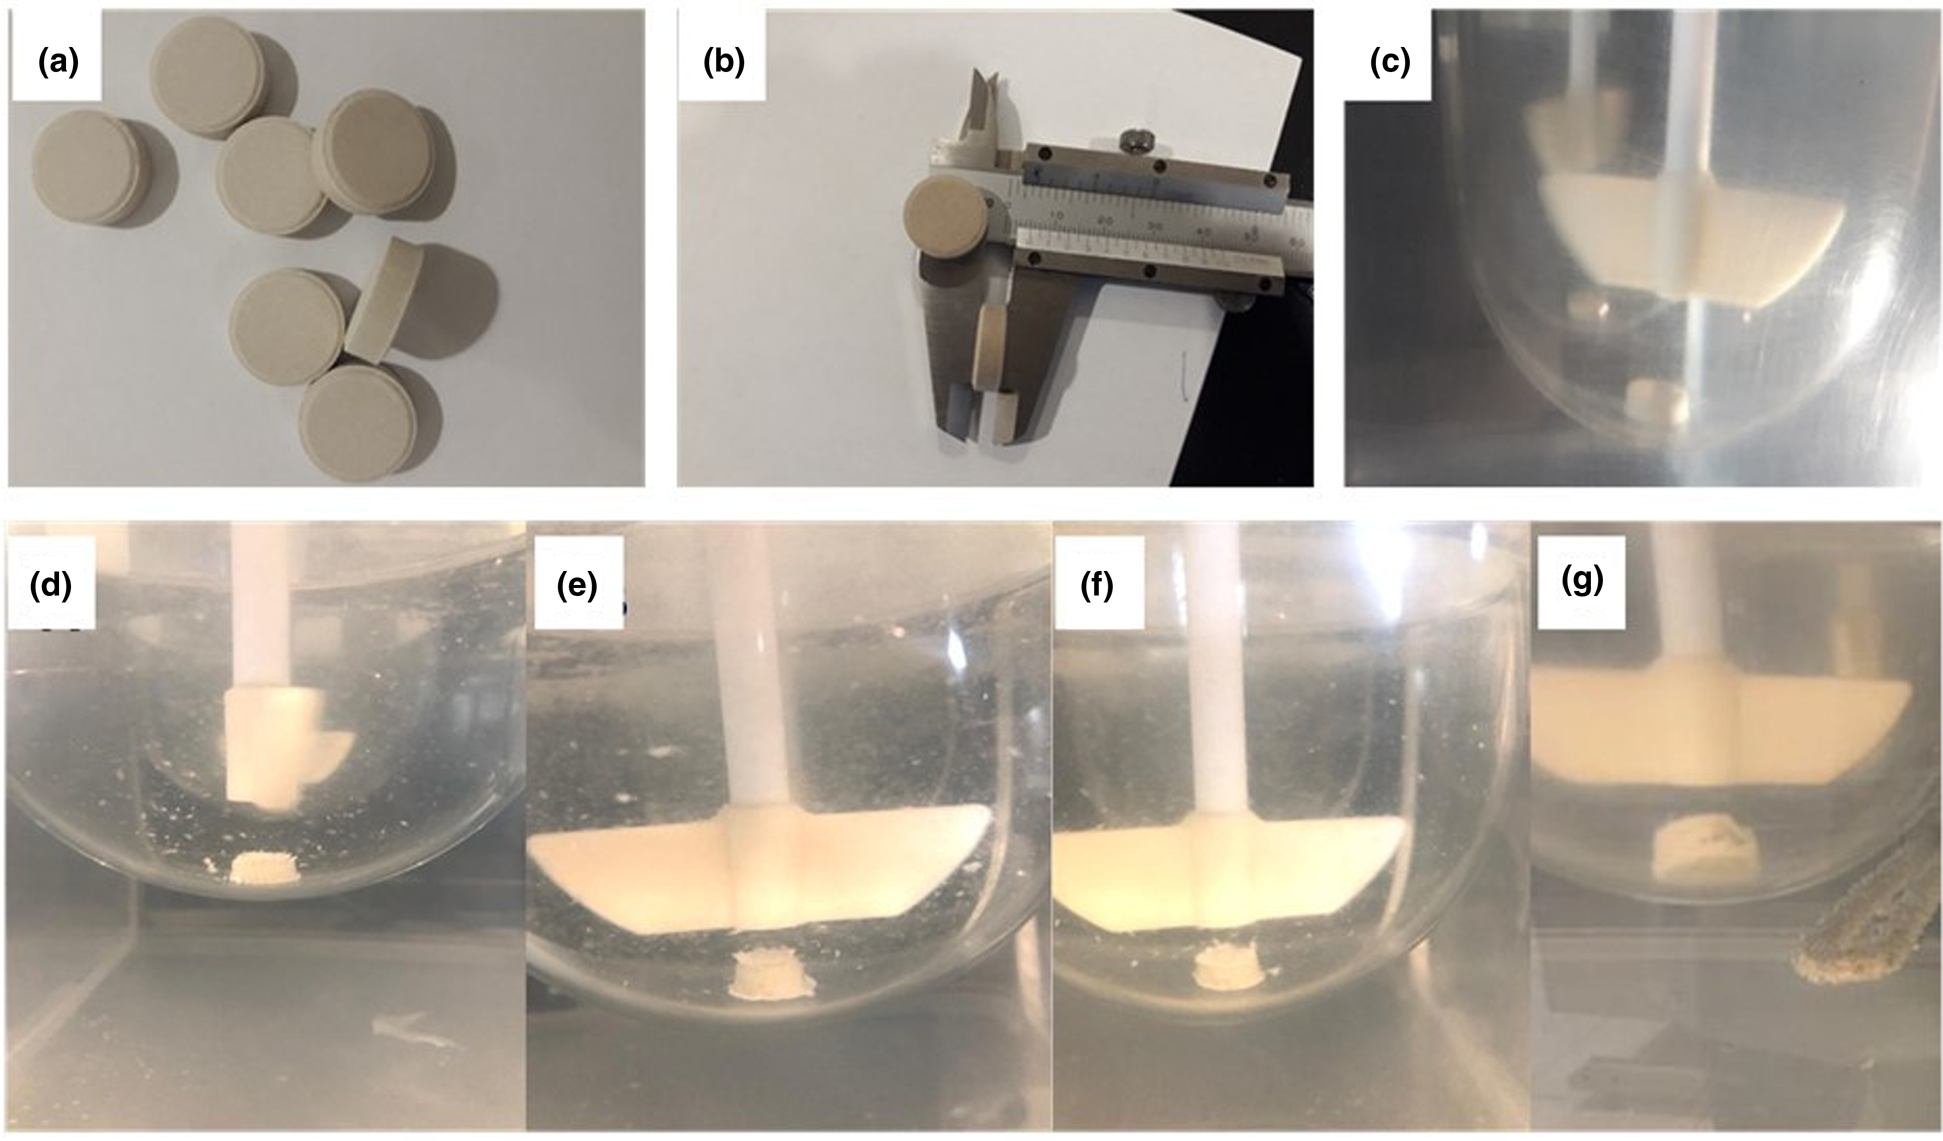
Fig. 6. (a & b) Photographs of IB–bentonite tablets before the dissolution study. (c) Photograph of an IB–bentonite tablet at time 0 in the dissolution apparatus. (d–g) Photographs of the gel structure of IB–bentonite tablets upon dissolution in a medium using phosphate buffer at pH 7.2 after (d) 1 h, (e) 2 h, (f) 3 h and (g) 24 h.
To protect IB–bentonite tablets from harsh acidic media, enteric coating was carried out. The results of this work revealed that enteric-coated tablets resisted 0.1 N HCl for 2 h. This coating is vital to protect bentonite from hydrolysis upon exposure to the acidic media in the stomach.
The next step focused on assessing the release kinetics of the formulated tablets. Table 4 shows high correlation coefficients in the case of zero-order fitting of between 0.95 and 0.99 for the various formulated tablets (except for the tablets prepared with PEG and IB–MCC10dry). The results also indicated that IB was released from the bentonite gel-forming matrix in a sustained manner. Furthermore, the release data were fitted using the Korsmeyer–Peppas model to determine the mechanism of drug release from the bentonite gel-forming matrix. The Korsmeyer–Peppas model assesses the release of drugs from a swelling gel structure (Bruschi, Reference Bruschi2015a). The results showed a high correlation coefficient with this model.
The Korsmeyer–Peppas model differentiated between Fickian and non-Fickian models according to the n value. When n = 0.5, the model is Fickian (Case I) and the drug is released by diffusion and is characterized by great solvent diffusion inside the matrix and low polymeric relaxation. When n > 0.5, the model is non-Fickian, which is associated with vitreous polymers and can be classified into three subtypes. The first subtype of the non-Fickian model is anomalous release, which occurs when 0.5 < n < 1. Generally, the diffusion and relaxation rates in this model are comparable. The second subtype of the non-Fickian mode (Case II) is when n = 1. In this model, the velocity of solvent diffusion is less than that of the polymeric relaxation process. The drug-release rate is constant and the order of release is zero. Finally, the third subtype of the non-Fickian model is the super-Case II model when n > 1. In the super-Case II model, the velocity of solvent diffusion is much greater, causing an acceleration of solvent penetration (Klech & Simonelli, Reference Klech and Simonelli1989). In this study, the values of n for IB–PEG5, IB–MCC5 and IB–starch10 were close to 1, indicating that the drug was released according to the non-Fickian zero order. On the other hand, for the prepared tablets without binder, enteric-coated tablets and when the concentrations of the binder in IB–PEG5 and IB–MCC5 were increased from 5% to 10%, the n values were >1.12 and <1.35. Such results indicate that the release from these tablets was according to Case II (zero order) or super-Case II. The results suggest that there was an increase in solvent diffusion in such cases through the swelled tablets. However, the results revealed that an n value of close to 1, such as those for IB–PEG5 and IB–PEG10, was not always associated with an increase in the correlation coefficient in the case of zero order correlation.
Overall, varying the binder concentration could lead to a targeted-release pattern. The produced formulations using a cost-effective excipient such as bentonite to formulate tablets containing a high dose of IB, which is a challenging active ingredient, were accomplished using a commonly used binder or even without a binder.
Conclusion
In this research, bentonite was investigated for the development of sustained-release tablets containing a high-dosing/load drug such as IB. Wet and dry granulation techniques were employed to prepare IB–bentonite tablets. Molecular and thermal profiling confirmed the compatibility of IB with bentonite. Furthermore, the granulation process improved the poor flowability of bentonite, which is advantageous for large-scale manufacturing purposes. In addition, this work showed that bentonite acts as a binding agent and has good compaction characteristics, which produced tablets with high mechanical strength. Upon dissolution, bentonite tablets formed a gel matrix that enabled the sustained release of IB over 24 h. In addition, the enteric coating of the optimal formulations protected the gel structure of bentonite from degradation in the acidic media. The release kinetics of IB from the optimal formulation followed Case II (zero order) and super-Case II models, suggesting an increase in solvent diffusion through the swelled tablets. Based on these findings, bentonite could be a potential excipient for formulating sustained-release tablets containing high-dosing drugs.
Author contributions
JAA: conceptualization, methodology, investigation and original draft preparation. SA-S: data curation and investigation. EZD: writing – reviewing and editing and statistical analysis. NAQ: critical reviewing and editing the original draft. AYN: statistical evaluation.
Acknowledgements
The authors would like to express their appreciation of Isra University for funding this project and the United Pharmaceuticals Company Ltd for the generous donation of ibuprofen and enteric coating materials, as well as for the permission to use the coater system in the research and development department.
Financial support
The research was funded by Isra University.
Conflicts of interest
The authors declare that there are no conflicts of interest.
Data availability
All raw data are available from the corresponding author upon reasonable request.


