Introduction
Lentil is an annual, herbaceous, self-pollinated, diploid legume (Sharma et al., Reference Sharma, Dawson and Waugh1995) with high nutritional value, as its seeds are rich in amino acids, proteins and dietary fibres and low in fat (Sarker and Erskine, Reference Sarker and Erskine2006; Fikiru et al., Reference Fikiru, Tesfaye and Bekele2011). In Greece, lentil cultivation is dated back to the Neolithic era according to findings at the Franchthi cave in Peloponnese (Horneburg and Becker, Reference Horneburg and Becker2008; Rutter, Reference Rutter2017). Centuries of lentil cultivation in the diverse Hellenic landscape has led to the development of many landraces. However, landrace cultivation was replaced by new improved varieties, such as ‘Samos’ and ‘Demetra’, due to low yield, sensitivity to diseases (Chatzivassiliou, et al., Reference Chatzivassiliou, Giakountis, Kumari and Makkouk2016) and low farmers’ income, leading to the inevitable loss of lentil genetic resources. On the other hand, few local landraces are still cultivated in small farms. An exceptional example is the ‘Eglouvis’ landrace that is exclusively cultivated at an isolated plateau (altitude 750–950 m) near the village Eglouvi in the Ionian island Lefkada. According to historic data cultivation of this microsprema type lentil landrace with traditional agricultural practices, is uninterrupted for centuries (before 1717 AD, as reported in Nikolaou and Maxted, Reference Nikolaou, Maxted, Vetelainen, Negri and Maxted2009), making it a rare example of on-farm conservation through traditional cultivation within the community (Thomas et al., Reference Thomas, Thanopoulos, Knüpffer and Bebeli2012). Further, this lentil has superb characteristics, including good taste and boiling quality (Nikolaou and Maxted, Reference Nikolaou, Maxted, Vetelainen, Negri and Maxted2009), leading to increased consumers’ interest that in combination with the low crop yield formed a high market price. Therefore, adulteration of ‘Eglouvis’ is a common problem in the market. Isolation of the island and the special plateau microclimate may have contributed to the development of a distinct genetic background of the landrace that merits further study. Currently, the use of molecular markers enables genetic analysis and the identification of important genotypes and allows to study genetic erosion and gene flow, but also adulteration in the market. Many researchers evaluated the genetic variation between lentil species, varieties and landraces using agromorphological traits, molecular markers such as ISSR, AFLP, SRAP and imaging analysis. (Toklu et al., Reference Toklu, Karaköy, Hakli, Bicer, Brandolini, Kilian and Ozkan2009; El-Nahas et al., Reference El-Nahas, El-Shazly, Ahmed and Omran2011; Fikiru et al., Reference Fikiru, Tesfaye and Bekele2011; Bosmali et al., Reference Bosmali, Ganopoulos, Madesis and Tsaftaris2012; Torricelli et al., Reference Torricelli, Silveri, Ferradini, Verona, Veronesi and Russi2012; Alghamdi et al., Reference Alghamdi, Khan, Ammar, El-Harty, Migdali, El-Khalik, Al-Shameri, Javet and AL-Faifi2014). Most of the studies estimated high genetic diversity among different landraces, but data on variation within a landrace are still limited and when available are inconsistent. ‘Eglouvis’ is a landrace cultivated for a long time in an isolated area, with no purposeful admixture of the planting material with other varieties, which enjoys high market value and appreciation by consumers, but is frequently adulterated and downgraded in the market. Genetic characterization of the landrace could provide significant information for landrace conservation and specify tools and measures to restrict markets from fraud or adulteration (Bosmali et al., Reference Bosmali, Ganopoulos, Madesis and Tsaftaris2012; Torricelli et al., Reference Torricelli, Silveri, Ferradini, Verona, Veronesi and Russi2012). Thus, the purpose of this study was to evaluate the genetic variability within ‘Eglouvis’ with morphological and molecular data and compare its genetic profile with the most widely cultivated commercial varieties.
Materials and methods
Plant material
A sample of 584 randomly selected ‘Eglouvis’ lentil seeds was used for morphological trait assessment. Molecular analysis was performed in a sample of 67 individuals from ‘Eglouvis’ landrace (E1–E67), 10 individuals from the commercial variety ‘Samos’ (S1–S10) and 10 individuals from the commercial variety ‘Demetra’ (D1–D10). The varieties ‘Demetra’ and ‘Samos’ were selected as controls, because as registered varieties have a high degree of phenotypic uniformity implying also a low level of genetic variation within the variety. Two bulked DNA samples from all the individual samples of ‘Eglouvis’ (Emix1 and Emix2), one bulked DNA sample from ‘Samos’ (Smix) and one from ‘Demetra’ (Dmix), were prepared by mixing equal amounts of the isolated DNA from each plant, to evaluate the ability of the methodology to discriminate bulked material from the different sources.
Image analysis
The 584 seeds of the random sample from a lot of 2 kg ‘Eglouvis’ lentils were assigned to six categories according to visual estimation of seed size, colour and pattern using standard criteria of IBPGR and ICARDA (1985). Size categories were large (L) with seeds larger than 3 mm diameter and small (S) with seeds smaller than 3 mm diameter, while colour was estimated in large seeds and was brown (B), green (G) and black (B). The pattern was estimated as present or absent in brown and green seeds and the categories were brown/patterned (BP) and green/patterned (GP) accordingly. The chi-square test was used to estimate the significance of a difference between percentages of seeds in each category. Images of all seeds from each category were acquired using a flatbed scanner (Epson Perfection V33, EPSON, Indonesia). Seeds were placed on the flatbed scanner avoiding contact to each other, and a digital image of 5.120 × 7.392 pixels at a resolution of 600 × 600 dpi was obtained. Image analysis was performed with the Adobe Photoshop CS3 (Adobe Systems Inc., San Jose, CA) and by using the MAGIC WAND TOOL to select and delete image background, with settings of Tolerance at 60, Anti-alias and Contiguous boxes selected, which resulted in clear separation of the lentil seeds from the background and no need of using the REFINE EDGE Tool (we also tested the use of the tool and got identical results). With background deleted from the image, each seed was displayed as a unique object that was selected using again the MAGIC WAND TOOL to select the empty space of the image and the INVERSE command from the SELECT menu. Measurements were recorded selecting ANALYSIS from the toolbar and RECORD MEASUREMENTS from the submenu. For each object (individual seed) the measurements of area (in squared pixels), perimeter (in pixels), circularity (4π × Area)/Perimeter2, where a value of 1.0 indicates perfect circle and lower values indicate more elongated shapes, grey value (minimum, maximum, median and mean, a measurement of brightness in a scale from 0 to 255), integrated density (the sum of the values of the pixels in each object, which is equivalent to the product of Area in pixels and Mean Gray Value), height (max y–min y, in pixels) and width (max x–min x, in pixels), were recorded and exported as a tab delimited file. The Euclidean distance for morphological traits of the seeds, principal component analysis (PCA), comparison of groups formed by cluster analysis with the Wilks’ Lambda test and analysis of variance (ANOVA) between seed groups formed by visual examination or the groups formed by cluster analysis, were performed using the XLSTAT 2009 software (Addinsoft, NY, USA).
DNA isolation and high resolution melting (HRM)-polymerase chain reaction (PCR) analysis
Isolation of DNA from 1 week old seedlings was performed with a standard CTAB protocol, as described in Tsanakas et al., (Reference Tsanakas, Polidoros and Economou2013). The integrity of the DNA was estimated on 1% agarose gel (0,5X TBE) electrophoresis and all samples were diluted to 100 ng/μl. Genotypic analysis was performed by PCR amplification and HRM melting analysis using the LightCycler® 96 Real-Time PCR system (Roche Diagnostics). The PCR reaction mixture, in a total volume of 11 µl, consisted of 100 ng genomic DNA, 1X PCR master mix (LightCycler 480 High Resolution Melting Master, Roche Diagnostics, or KAPA HRM FAST qPCR Master Mix, Kapa Biosystems) and 0,2 µM each of the forward and reverse primers. The sequence and the characteristics of the simple sequence repeat (SSR) primers used in the study initially described by Hamwieh et al. (Reference Hamwieh, Udupa, Sarker, Jung and Baum2005), are shown in online Supplementary Table S1. PCR was performed by preincubation of the samples at 95°C for 180 s, followed by 45 cycles of three-step amplification consisting of denaturation at 95°C for 5 s, annealing at a temperature depending on the primer pair for 20 s and extension at 72°C for 45 s. The final extension was 5 min to ensure complete synthesis of all PCR products. For the HRM analysis, which followed immediately after the PCR, the melting protocol consisted of denaturation of the PCR products at 95°C for 1 min, a rapid ramp down to 40°C and annealing for 60 s, then rapid heating at 65°C to initiate a continuous melting up to 95°C at a rate of 2.2°C/s. Normalized melting curves and difference plots were generated on the LightCycler® 96 Real-Time PCR system (Roche Diagnostics) by measuring fluorescence 15 times per °C change between 65°C and 95°C, using algorithms supplied by the manufacturer. The genetic profile of each sample was determined based on the difference plots and a binary matrix for further analysis was generated. Also, all PCR products were electrophoresed in 2% agarose gels (0.5× TBE) for 1 h at 80 volts and the results were compared. Nei's genetic distance was calculated (Nei, Reference Nei1978) and similarity estimates based on the distance matrix were clustered by UPGMA (Unweighted Pair Group Method using Arithmetic Averages) and depicted as a circular dendrogram using ‘MEGA 5’ (Tamura et al., Reference Tamura, Peterson, Peterson, Stecher, Nei and Kumar2011). Finally, principal coordinates analysis (PCoA) was performed using ‘GenAlEx 6.41’ (Peakall and Smouse, Reference Peakall and Smouse2006).
Results
Morphological characters
We estimated the thousand-seed weight (TSW) that was on average 30 g with negligible deviation. Distribution of the sampled 584 seeds in visually estimated classes resulted in six categories shown in Fig. 1. About 1/3 of the seeds (36.6%) were very small, below 3 mm diameter. The rest five categories stand between 8.4% and 13.8% and the percentage of seeds in each class did not differ of another in a statistically significant level (χ2observed = 12.144 >χ2critical = 9.488, P = 0.016). Measurements of all phenotypic characters were statistically analyzed and summary statistics are shown in Table 1. Data show that seeds are almost perfectly circular with big differences in seed size and coloration. When the different seed categories were examined separately, the Wilks’ Lambda test revealed significant differences of the mean vectors for the various classes in all measurements (P < 0.0001). A Pearson's correlation matrix (online Supplementary Table S2) revealed high correlation (above 0.9) of the area with perimeter, height and width, and mean with median grey value, suggesting that highly correlated characters could be represented by a single character measurement. Regarding the other measurements, circularity had a negative correlation with all other characters, the closest being perimeter (−0.614), while minimum and maximum grey value had no significant correlation with other characters. Agglomerative hierarchical clustering of the 584 sampled seeds using UPGMA and multivariate PCA based on the image measurements for the morphological characters were performed to estimate grouping of the samples and partitioning of the variation to specific characters. UPGMA analysis distributed the seeds in seven classes, the relation of which with the categories of the optical clustering is shown in Fig. 2. Almost all C1 seeds are grouped together in a clade with two closely related branches in a dendrogram, and the same can be observed for all C6 seeds. Most of the other categories are clustered mixed in three branches of the dendrogram. ANOVA of the morphological characters between seed groups formed by visual examination or the groups formed by cluster analysis revealed statistically significant differences in both classifications for all the examined characters, which is indicative of the rich phenotypic variation of ‘Eglouvis’ seeds (online Supplementary Table S3). Finally, a PCA was conducted to estimate the Eigenvalues and the variability assigned to each different vector of the PCA (online Supplementary Table S4). The first two dimensions could explain a cumulative 78.355% of the variability of the data. In a bi-plot graph of the PCA, the highly-correlated characters of the seeds are in close proximity and the distribution of the seeds do not form well-separated groups (online Supplementary Fig. S1).
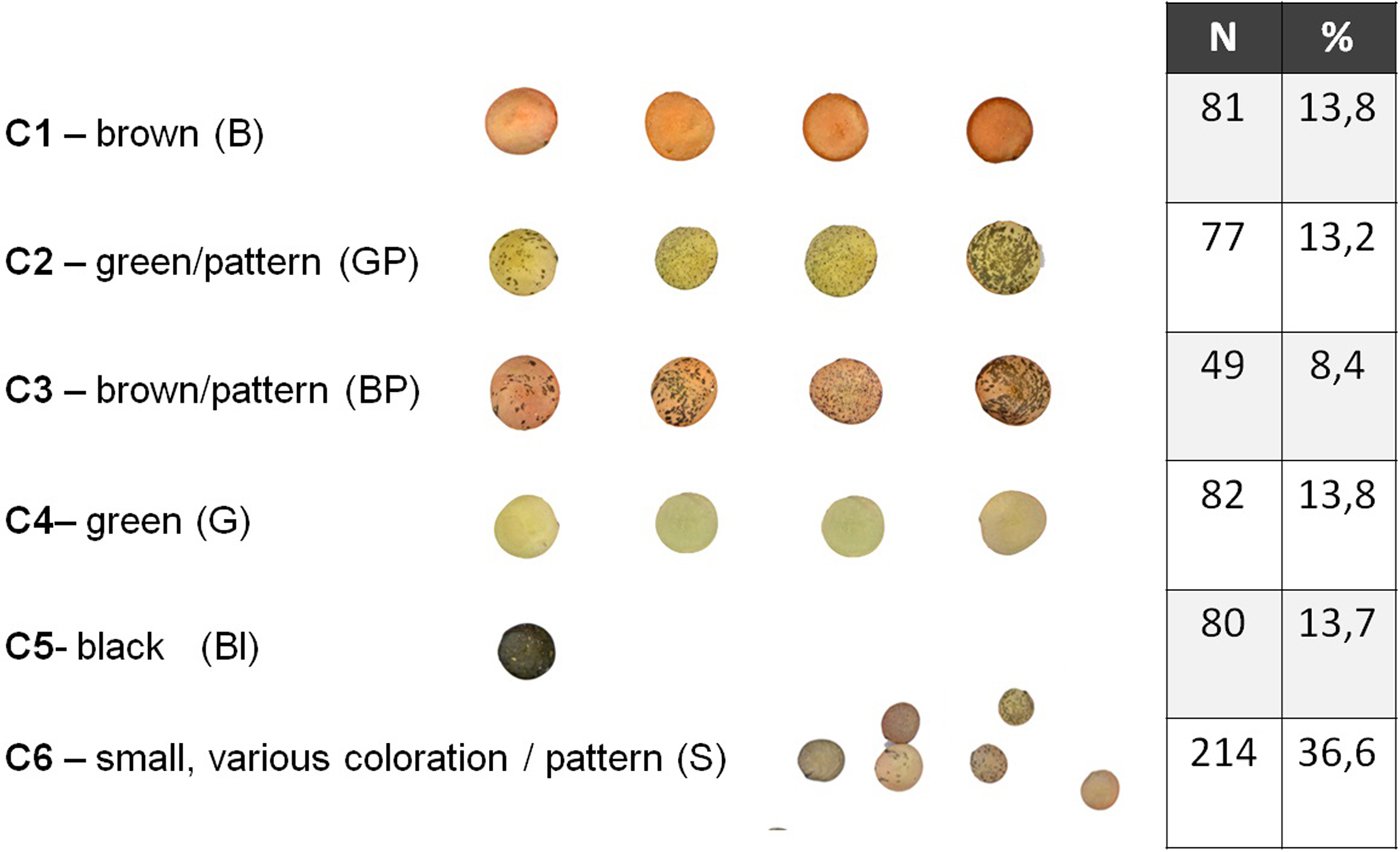
Fig. 1. Representative seeds of the ‘Eglouvis’ landrace separated into six categories (C1-C6). The columns at the side are the number (N) of seeds in each category and the percentage of the seeds in the category from the total of 586 seeds.
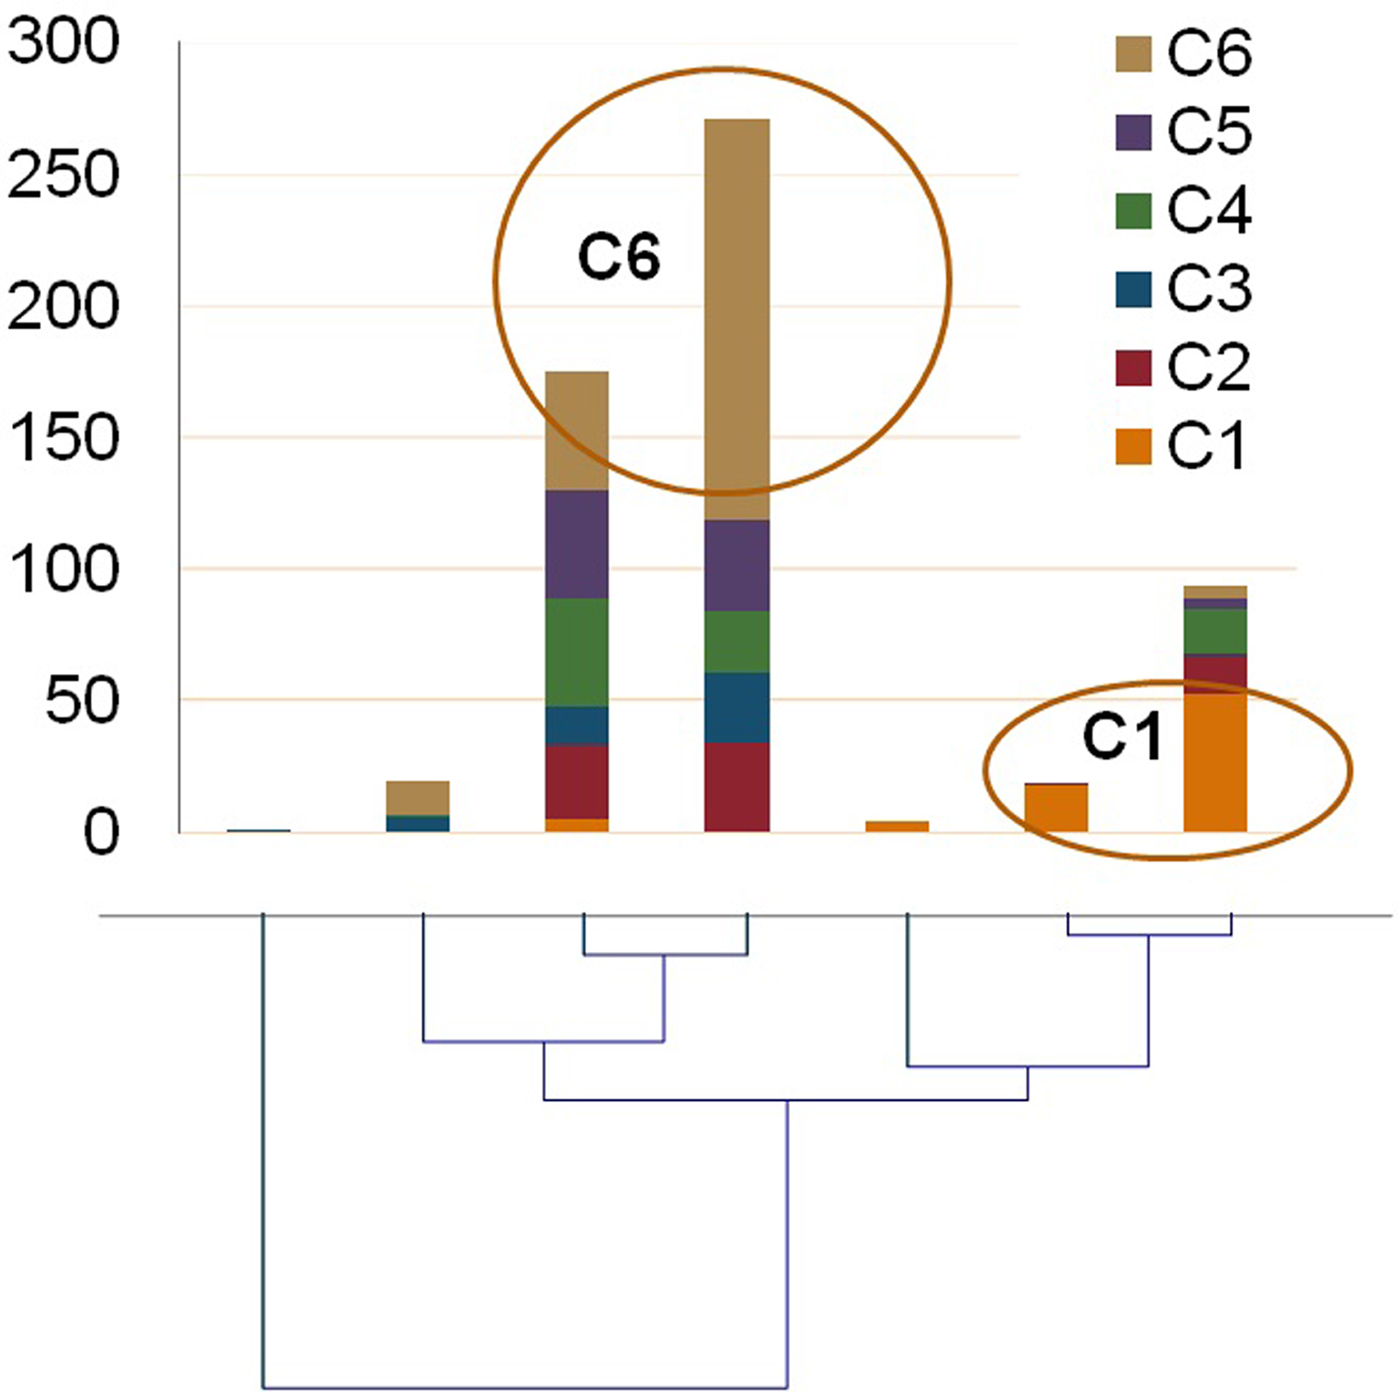
Fig. 2. UPGMA dendrogram based on the Euclidian distance of the morphological characters of the ‘Eglouvis’ seeds. Participation in each clade of seeds from the categories formed by optical clustering is shown as composite columns above the clades.
Table 1. Summary statistics of the morphological characters examined by image analysis

Values are calculated in image pixels.
Genetic analysis using SSR markers
Genetic variability within ‘Eglouvis’ was estimated by 11 SSR molecular markers using the melting profile of PCR products to assign allelic patterns. HRM analysis of PCR products is a method using the high data-density acquisition to detect small sequence differences in PCR fragments analyzing melting curves. Different melting profiles are representative of the presence of different alleles that may differ in as little as a single nucleotide in their sequence. HRM resulted in 45 completely different melting profiles, which were assumed as different alleles over the 11 SSR markers. A number of alleles varied from 2 (meaning two different melting profiles) for SSR204, to 6 for SSR113 (online Supplementary Table S5). HRM patterns were fully confirmed when differences of PCR products allowed, by agarose gel electrophoresis (data not shown). Also, the reproducibility and the sensitivity of the analysis were validated in duplicate experiments. Polymorphism within the samples has been detected based on the pattern of temperature-shifted curves and difference plot. For statistical analysis of the data, each HRM pattern was recorded as the binary value represented with 1 for presence and 0 for absence. PIC values for each primer pair were calculated according to Smith et al. (Reference Smith, Chin, Shy, Smith, Wall, Seniot, Mitcell, Kresovich and Ziegle1997). The PIC-values range is between 0 for monomorphic markers and 0.5 for fully polymorphic markers. An average PIC value of 0.191 was scored across all SSRs with lower PIC (below 0.1) estimated for SSR19, SSR80 SSR107 and SSR302, and higher (above 0.3) for SSR 204 and SSR 317-2 (online Supplementary Table S5). Based on the presence/absence of HRM patterns a matrix from the SSR data was generated to calculate the Nei's genetic distance (Nei, Reference Nei1978) and a circle dendrogram using UPGMA clustering indicated samples’ partitioning (Fig. 3). As expected, one clade consisted of the ‘Samos’ and ‘Demetra’ samples (which share common ancestry, since ‘Demetra’ and ‘Samos’ derived from crosses of the variety ‘Thessaly’ with different male parents) and the other clade consisted of the ‘Eglouvis’ samples that were further segregated. In particular, two large groups (with two sub-clusters each), two medium and two small groups within the ‘Eglouvis’ were detected, while some samples were not grouped at all. The large group A consisted of the two sub-clusters: A1 with 15 samples (22.3% of the ‘Eglouvis’ samples) and A2 with seven samples (10.5%). The large group B had also two sub-clusters: B1 with six samples (9%) and B2 with 10 samples (15%). The medium group C had seven samples (10.5%) and the medium group D had 12 samples (18%); while the small group E had three samples (4.5%) and the small cluster F had two samples (3%). The two ‘Eglouvis’ DNA mix samples (Emix1 and Emix2), as well as three other samples were not grouped with the other samples. Patterns of the relationship among the ‘Eglouvis’ landrace and the two lentil cultivars as revealed by PCoA can be seen in the graph (Fig. 4). The HRM/SSR phylogenetic analysis fully distinguished the three different lentil varieties in three groups and no overlapping was found. Also, the DNA pooled samples (Emix, Smix and Dmix) were members of these groups, but they were located at the borders. In addition, the samples of ‘Eglouvis’ had greater distribution in the two axes than the samples of ‘Samos’ and ‘Demetra’ that have very low genetic variability.
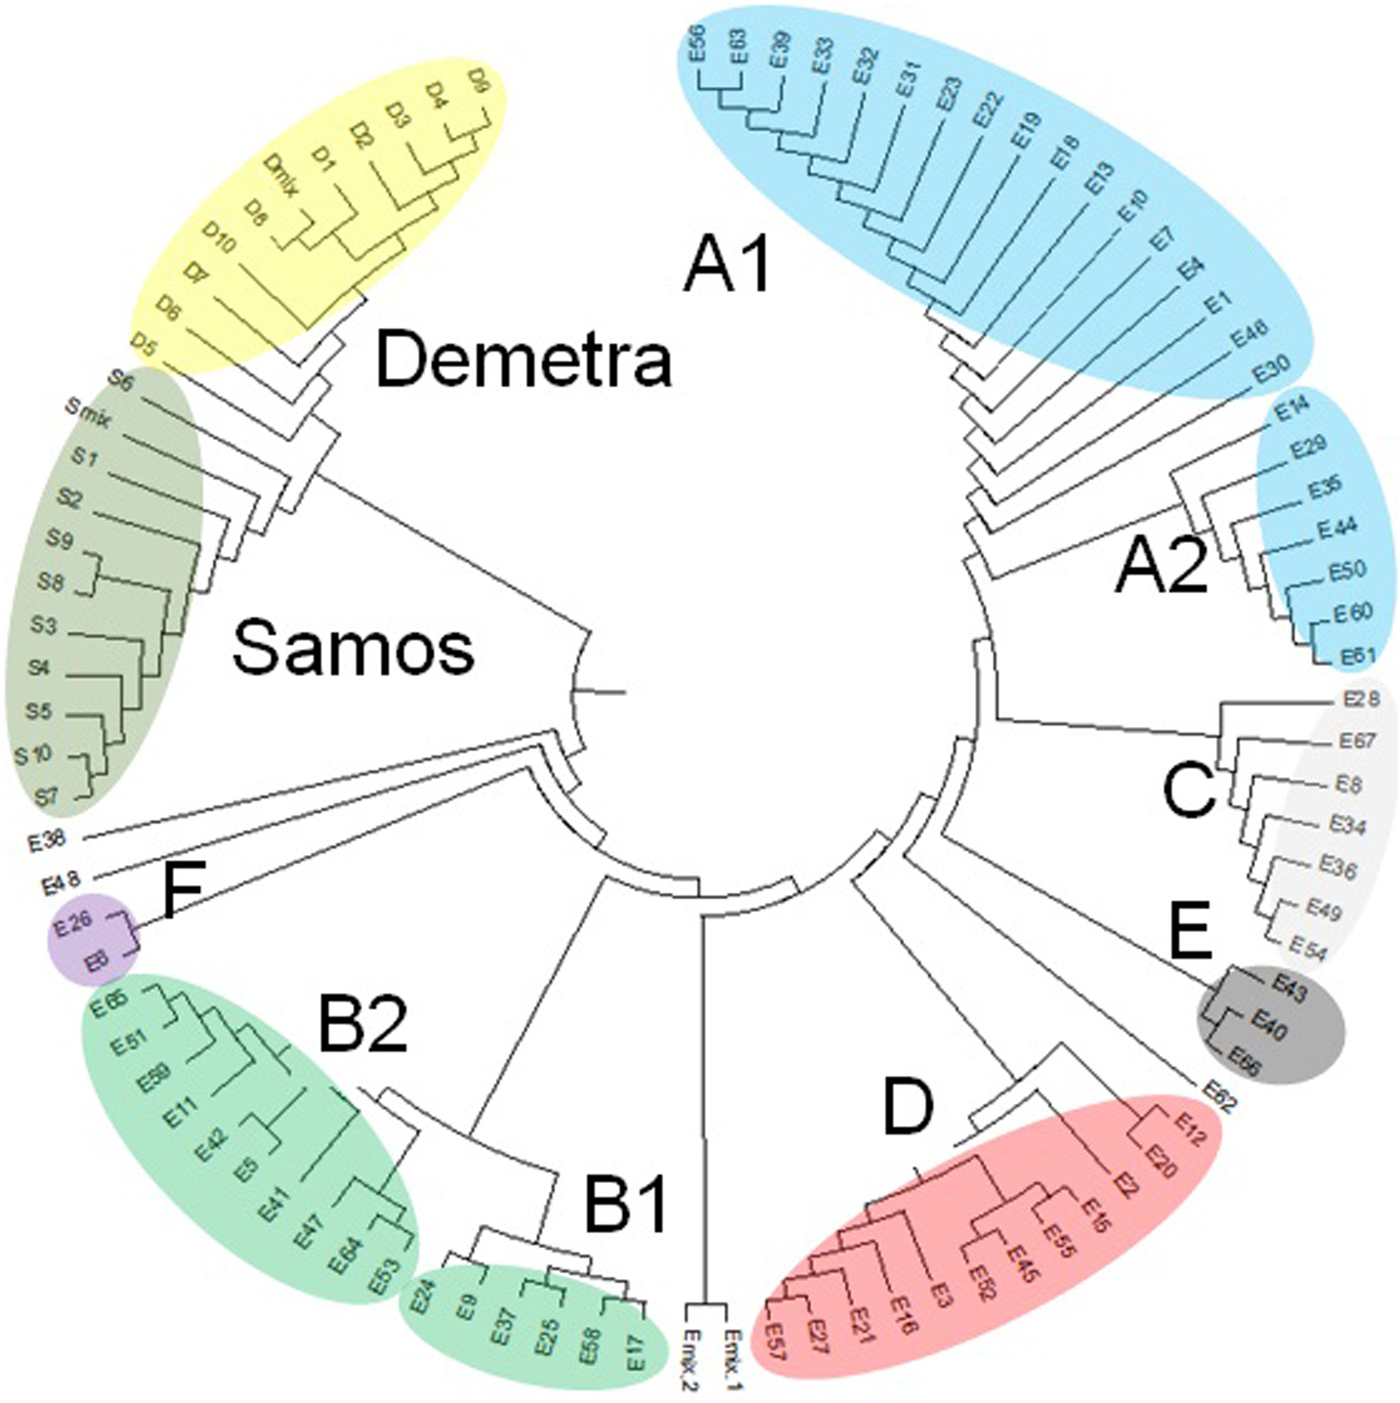
Fig. 3. UPGMA circular dendrogram showing the distance between samples of the traditional lentil variety ‘Eglouvis’ and the varieties ‘Samos’ and ‘Demetra’. All genotypes of ‘Samos’ and ‘Demetra’ belong to one clade and the varieties are separated into two branches. ‘Eglouvis’ seeds form a clade with several branches. Groups and subgroups can be seen with a different colour.
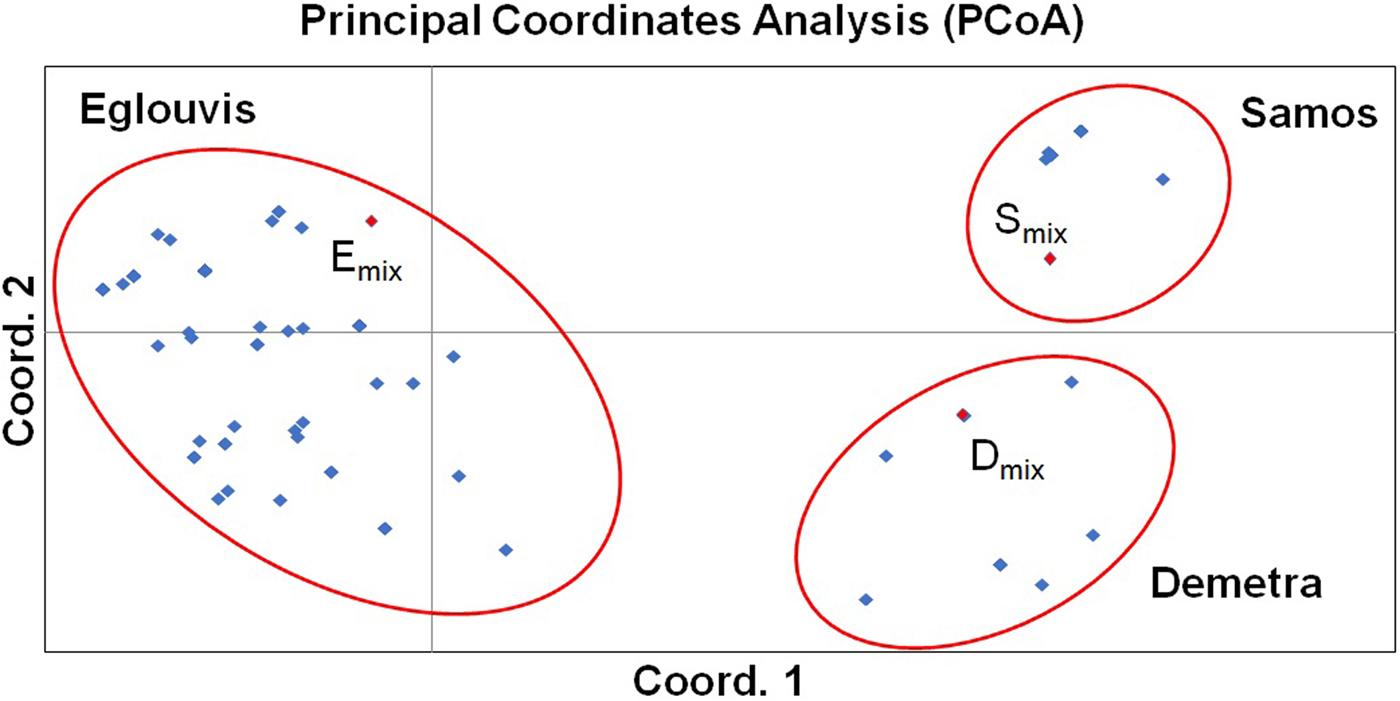
Fig. 4. Two-dimensional representation of 68 lentil genotypes according to PCoA analysis. Three distinct groups (one for every cultivar and no overlapping) are indicated by red ovals. Pooled DNA samples (Emix, Smix and Dmix) can be seen within the appropriate groups with red colour spots.
Discussion
Industrialization of modern agriculture is based upon high yielding varieties that are products of intensive breeding efforts and are meeting strict requirements for distinctiveness-uniformity-stability (DUS), undergo extensive testing, and are regulated by Intellectual Property Rights (IRP) and seed legislation. These new varieties have replaced older local varieties known as ‘landraces’ that were used in traditional agricultural systems in the past. A landrace is defined as a ‘dynamic population(s) of a cultivated plant that has historical origin, distinct identity and lacks formal crop improvement, as well as often being genetically diverse, locally adapted and associated with traditional farming systems’ (Camacho Villa et al., Reference Camacho Villa, Maxted, Scholten and Ford-Lloyd2005). Genetic diversity within a landrace represents a valuable resource of potentially useful alleles, which confer local adaptation and resistance to biotic and abiotic stress. These alleles are lost when landrace cultivation is replaced by modern varieties and crop's genetic variability is eroded at a serious scale, exacerbated by climate change. This is threatening to the future agricultural sustainability. The importance of food security with a growing world population but limited land and water resources, and Farmers’ Rights regulated by the Convention on Biological Diversity (CBD) and the International Treaty on Plant Genetic Resources for Food and Agriculture (ITPGRFA), converge into the significance of traditional varieties as a vital genetic resource that can be preserved by cultivation. Mediterranean lentil landrace genetic diversity and population structure have been studied recently (Lombardi et al., Reference Lombardi, Materne, Cogan, Rodda, Daetwyler, Slater, Forster and Kaur2014; Khazaei et al., Reference Khazaei, Caron, Fedoruk, Diapari, Vandenberg, Coyne, Mc Gee and Bett2016; Idrissi et al., Reference Idrissi, Piergiovanni, Toklu, Houasli, Udupa, Keyser, Damme and Riek2017). All studies report higher genetic diversity among the landraces from Greece and Turkey in comparison with other agro-climatic environments, suggesting a higher level of genetic diversity within this germplasm. This may be related to the domestication of lentil in the eastern Mediterranean region. Other researchers even suggest that Mediterranean lentil germplasm could be introduced to broaden the genetic basis of South-Asian lentils to alleviate the low yielding due to limited resistance in biotic and abiotic stress (Dikshit et al., Reference Dikshit, Singh, Singh, Singh, Aski, Prakash, Jain, Meena, Kumar and Sarker2015). However, there are limited data on genetic variation within the landraces. We found that the ‘Eglouvis’ landrace has a wide genetic basis, pointing to the significance of this genetic material as a source of valuable alleles. In a comparative study of northern and southern Mediterranean lentil germplasm diversity, Idrissi et al. (Reference Idrissi, Piergiovanni, Toklu, Houasli, Udupa, Keyser, Damme and Riek2017) reported that landraces from Greece as well as from Morocco and Italy, had a greater diversity among individuals within the landrace, as compared with landraces originated from Turkey. It is worth noting that none of the above mentioned Greek landraces was ‘Eglouvis’ and seven of the SSR markers were common with the ones used in the present study. The difference in genetic diversity among individuals of landraces originating from different countries could be a result of specific adaptation towards different agro-environments (Idrissi et al., Reference Idrissi, Udupa, Houasli, Keyser, Van Damme and De Riek2015) and different practices adopted by the villagers who keep seeds to sow for the next season. Indeed, farmers from the Eglouvi village reported that they try to preserve the ‘original’ seed's morphological variance when they keep seed for the next cultivation. This is in accordance with our findings that reveal the high phenotypic variation of the seed characters examined. On the contrary, whenever farmers are keeping seeds from their ‘best’ plants, they narrow the genetic base of the landrace, especially in self-pollinated species such as lentil. Our data revealed that the landrace has high seed phenotypic variation with seeds that form two chromatic classes (green and brown) with or without patterns or dots and two size classes of seeds larger or smaller than 3 mm. It should be noted that ‘Eglouvis’ is a microsperma lentil variety with seeds that do not exceed 6 mm diameter. This conclusion was supported by the Wilks’ Lambda test, which revealed significant differences for the various classes in all measurements. The genetic variation of lentils has attracted much attention as a subject for genetic analysis during the last decades, using available marker technologies. Ferguson and Robertson (Reference Ferguson and Robertson1996) could evaluate the genetic diversity of more than 400 species, subspecies and landraces of lentils using allozyme markers. Ford et al., (Reference Ford, Pang and Taylor1997) used RAPD molecular markers to study the genetic distance of lentils originating from targeted breeding. During the last years a lot of interest has been given to the lentil landraces of the Mediterranean basin and their genetic background, as they can be considered as significant phytogenetic resource. In Italy, lentil landraces are also cultivated since ancient times, but nowadays the cultivation has been restricted mainly to the Central and Southern Italy and in some small islands (Piergiovanni Reference Piergiovanni2000). Sonnante et al. (Reference Sonnante, Hammer and Pignone2009) analyzed the genetic variation of Italian landraces using ISSR markers and found that the lentils originating from the mainland had greater genetic variability than those from the islands. Toklu et al. (Reference Toklu, Karaköy, Hakli, Bicer, Brandolini, Kilian and Ozkan2009) evaluated the genetic diversity of Turkish lentil landraces with ISSR and AFLP molecular markers and found that two main groups are formed and only one landrace significantly differs from the others; while Fiocchetti et al. (Reference Fiocchetti, Laddomada, Roselli and Lucrettia2009) used AFLP markers in order to analyze the genetic diversity within and between three Italian landrace lentils as also the gene flow. Hamwieh et al. (Reference Hamwieh, Udupa, Sarker, Jung and Baum2005) developed and used SSR markers for the construction of a lentil genetic linkage map aiming to the localization of fusarium vascular wilt resistance genes and later the same group (Hamwieh et al., Reference Hamwieh, Udupa, Sarker, Jung and Baum2009) developed an additional set of 14 microsatellite markers to estimate genetic diversity and relationships within a core collection of lentil germplasm held at ICARDA. The microsatellite markers developed in their studies were highly polymorphic, locus-specific and most of them co-dominant. These SSRs proved to be valuable analytic tools for genetic diversity assessment in many other studies. Liu et al. (Reference Liu, Guan, Xu, Zhang, Gu and Zong2008) used 14 of these SSR markers to analyze 440 accessions of lentil sampled from the National Genebank of China, while Babayeva et al. (Reference Babayeva, Akparov, Abbasov and Mammadov2009) used five SSR markers to study the genetic relationships among the 39 lentil accessions. Their results confirmed that these microsatellites could be powerful tools to explore cultivar diversity in lentil. In addition, Bacchi et al. (Reference Bacchi, Leone, Mercati, Preiti, Sunseri and Monti2010) used six SSR markers to study genetic relationships between 25 lentil accessions from different areas. They concluded that a few SSR markers could provide significant information about the genetic relationships between accessions. Zaccardelli et al. (Reference Zaccardelli, Lupo, Piergiovanni, Laghetti, Sonnante, Daminati, Sparvoli and Lioi2012) could group different Italian lentil landraces in different clusters and sub-clusters principally on the basis of their geographical origin, in a study using 16 SSR markers out of which, seven were common with our study. SSR markers developed by others confirmed their potential in analysis of genetic relationships between cultivated and wild Lens species (Verma et al., Reference Verma, Sharma, Srivastava, Abdin and Bhatia2014). Specific SSR markers show high level of polymorphism and their use in studies concerning the genetic variation in lentil varieties could be effective. In the present study, we used 11 of the most polymorphic SSR markers developed by Hamwieh et al. (Reference Hamwieh, Udupa, Choumane, Sarker, Dreyer, Jung and Baum2005) combined with an HRM approach to analyze the genetic variation within the ‘Eglouvis’ landrace and compare it with the variation of the two most widely cultivated varieties in Greece (‘Samos’ and ‘Demetra’). Similarly, (Idrissi et al., Reference Idrissi, Udupa, Houasli, Keyser, Van Damme and De Riek2015) reported the genetic differentiation of Moroccan lentil landrace known for its seed quality among other landraces using SSR and AFLP markers. Results also allowed to evaluate if there is mixing between the varieties, as according to the traditional cultivation practices the local lentil populations are cultivated in marginal areas and farmers do not take particular care towards genetic homogeneity of populations or to prevent their contamination (Bosmali et al., Reference Bosmali, Ganopoulos, Madesis and Tsaftaris2012). As mentioned above, abandonment of traditional varieties has a detrimental effect on genetic diversity for a species. Loss of valuable alleles in a species may impair breeding efforts to increase resistance in certain biotic and abiotic stresses. To avoid loss of genetic diversity and preserve valuable genetic resources, seeds of landraces are deposited in Genebanks for storage and preservation. Samples from many Greek lentil landraces have been collected and deposited to Genebanks around the world. For example, the Genebank of IPK Gatersleben has 86 accessions of lentil collected from Greece by scientists of the German occupation army during the 1941–1942 Balkan expedition; while another 97 accessions are deposited in the Greek Genebank collected between 1982 and 2008 and represent landraces and breeding varieties. Accessions of the ‘Eglouvis’ landrace have been deposited in the Greek Genebank (Col. No. GRC1015/04) the ICARDA Genebank (accession no. ILL 293) and the US Department of Agriculture Western Regional Plant Introduction Station (WRPIS), Pullman, Washington (PI 297761). However, this type of conservation depending on the initial sample and the seed multiplication method for seed renewal will eventually encompass a loss of genetic variation. Obviously, the conserved accessions do not reflect the rich total genetic variation of the ‘Eglouvis’ landrace. ‘Eglouvis’ is an example of a traditional variety that is preserved by cultivation, thus there is no danger of loss of genetic diversity because of propagation from limited seeds. Nevertheless, this type of preservation incurs the danger of willingly of unwillingly mixing-up with seeds from other varieties. Such contamination when occurs in the material used for sowing the next season's cultivar will lead to the degeneration of the variety and loss of its characteristics. According to our results, the ‘Eglouvis’ landrace significantly differs from the two most widely cultivated lentil varieties in Greece (‘Samos’ and ‘Demetra’) and no genetic contamination or mixing was found. On the contrary, it was found that ‘Eglouvis’ has a unique genetic background that does not overlap with the above-mentioned varieties when examining individuals, or even bulk samples with molecular markers. This is in accordance with Bosmali et al. (Reference Bosmali, Ganopoulos, Madesis and Tsaftaris2012) who reported that bulk seed samples prepared from the ‘Eglouvis’ traditional variety could be distinguished from bulk seed samples from other varieties and species using an SSR marker. During the last years the Greek growers have made remarkable efforts to maintain the genetic originality of many local cultigens trying to satisfy the needs of the market (Tzitzikas et al., Reference Tzitzikas, Monforte, Kypriotakis, Iacovides, Ioannides and Kalaitzis2009). This probably is also true for ‘Eglouvis’ and could be due to the higher profit of this particular landrace for the growers, who realized that they can benefit trying to maintain its purity. Even though, continuous effort of the farmers is still needed for further improvement of standard cultivation techniques in order to avoid the danger of intercrossing or mixing with modern varieties. Also, in the present study it was found that ‘Eglouvis’ has high genetic variation. Our results agree with other studies indicating that lentil traditional varieties of the Mediterranean counties have a wide genetic background, that is even higher than the Asian or American varieties. Furthermore, Singh et al. (Reference Singh, Srivastava, Gupta, Basu and Kumar2016) found that the Mediterranean landraces of lentils have a higher total dietary fibre and B9 content than a series of widely cultivated varieties. ‘Eglouvis’ should be included in similar studies in the future and we assume that will have a very good ranking due to its very wide and genetically pure background. According to our results, ‘Eglouvis’ lentils form eight groups and subgroups of genetic similarity, the landrace is distinct from the major Greek cultivars and no contamination has been found from these sources. Furthermore, some samples of the ‘Eglouvis’ showed a unique genetic background that could not be grouped with others, highlighting the great importance of this traditional variety as a phytogenetic resource. It should be also noted that during the last years the great genetic variation of landraces has been linked with much higher prices that the consumers are ready to pay, as these local varieties have excellent quality and nutritional value (Cebolla-Cornejo et al., Reference Cebolla-Cornejo, Soler and Nuez2007). Finally, the pooled DNA samples were not clustered with the other genotypes of the ‘Eglouvis’ clade and formed their own group, leading to the conclusion that the use of bulk samples to distinguish varieties can be very challenging and risky in a highly sensitive molecular analysis such as the HRM. To that advocates the enormous morphological diversity present in seeds in association to differences in nutrient contents (unpublished data). ‘Eglouvis’ can be considered as a lentil landrace with a unique genetic background, which has not been mixed up with the most widely cultivated varieties in Greece, till now. However, we are not aware of specific measures taken by the growers in order to ensure the genetic purity of this valuable genetic resource and further actions should be considered towards this direction. ‘Eglouvis’ genetic pool is a phytogenetic resource that can be used (and such efforts are already in progress) in targeted breeding programs in order to exploit its high nutritional value into the development of novel varieties and according to the needs of the market, e.g. with desirable agronomical traits or/and increased nitrogen fixation, resistance to viruses and other diseases, as well as other important agronomic characters.
Supplementary material
The supplementary material for this article can be found at https://doi.org/10.1017/S1479262118000096
Acknowledgement
The authors would like to thank Vasilis Sgouropoulos for kindly providing the ‘Eglouvis’ seeds.