Introduction
Rice (Oryza sativa L.) has been shown to have originated from its wild relative, brownbeard rice (Oryza rufipogon Griffiths), which after many domestication events and hybridization of wild rice with cultivated rice, further gave rise to weedy rice (Oryza sp.) (Londo et al. Reference Londo, Chiang, Hung, Chiang and Schaal2006). Weedy Oryza sp. is widespread in the southern U.S. rice-producing states and continues to be a major constraint to production wherever it occurs. It belongs to the same species as cultivated rice (Oryza sativa L.) and is highly competitive with the crop (Burgos et al. Reference Burgos, Norman, Gealy and Black2006). Although some weedy Oryza sp. biotypes share many phenotypic traits compared with cultivated rice, other biotypes have phenotypically distinct traits such as a black-colored hull, presence of awn, high to intermediate shattering, greater height, and early to late flowering (Federici et al. Reference Federici, Vaughan, Norihiko, Kaga, Xin, Koji, Francis, Zorrilla and Saldain2001; Gealy et al. Reference Gealy, Tai and Sneller2002; Suh et al. Reference Suh, Back and Ha1997; Vaughan et al. Reference Vaughan, Ottis, Prazak-Havey, Bormans, Sneller, Chandler and Park2001). Competition results in significant yield losses and reduction of rice grain quality (Ottis et al. 2005; Shivrain et al. Reference Shivrain, Burgos, Gealy, Smith, Scott, Mauromoustakos and Black2009). Hence, to make Oryza sp. management sustainable, it is important to understand the physiological characteristics of populations.
Among its weedy traits, seed dormancy is one of the major important factors for persistence of weedy Oryza sp. Seed dormancy can allow weedy Oryza sp. to persist in the soil for up to 10 yr (Goss and Brown Reference Goss and Brown1939; Teekachunhatean Reference Teekachunhatean1985). The ability to predict dormancy level is important for improved weed management, as it allows prediction of infestation levels of various weedy species, thereby enabling farmers to adopt appropriate weed management techniques (Grundy and Mead Reference Grundy and Mead2000). Our current work contributes to characterization of seed dormancy genes, which eventually should help in breeding preharvest sprouting resistance in rice varieties to eliminate preharvest sprouting problems in Southeast Asia (Dong et al. Reference Dong, Tsuzuki, Kamiunten, Terao, Lin, Matsuo and Zheng2003).
The length of dormancy in weedy Oryza sp. is affected by storage temperature and afterripening time. In previous experiments, it was determined that the optimum afterripening time for weedy Oryza sp. to release dormancy is 90 d, and the optimum germination temperature is 35 C (Tseng et al. Reference Tseng, Burgos, Shivrain, Alcober and Mauromoustakos2013). The hull also plays an important role in imposing seed dormancy. In weedy Oryza sp., the blackhull ecotype is generally more dormant than the strawhull ecotype (Do Lago Reference Do Lago1983; Tseng et al. Reference Tseng, Burgos, Shivrain, Alcober and Mauromoustakos2013). Our study on variation in weedy Oryza sp. seed dormancy (Tseng et al. Reference Tseng, Burgos, Shivrain, Alcober and Mauromoustakos2013) revealed that afterripening time and germination response to incubation temperature differed both among and within weedy Oryza sp. accessions. In this paper, a population represents multiple plants of the same ecotype from the same field. One field can be infested with multiple weedy Oryza sp. ecotypes. The mean germination capacity (GC) of weedy Oryza sp. populations at 35 and 15 C was 84% to 100% and 44% to 97%, respectively. Blackhull populations showed 3% to 11% lower germination than strawhull accessions at all incubation temperatures and required an afterripening time at least 30 d longer to release dormancy. In addition, blackhull weedy Oryza sp. showed a higher inter- and intrapopulation variation in dormancy than strawhull. The phenotypic diversity, specifically maturation period and seed dehiscence, among both blackhull and strawhull weedy Oryza sp. populations is high (Shivrain et al. Reference Shivrain, Burgos, Agrama, Lawton‐Rauh, Lu, Sales, Boyett, Gealy and Moldenhauer2010a). Knowing this, we evaluated the genetic diversity of dormancy-related loci among and within weedy Oryza sp. populations. Because of the large variability in seed dormancy variation among weedy Oryza sp. populations, we hypothesized that the genetic diversity of seed dormancy-linked loci may even be high among populations of the same hull color. Therefore, the objective of this study was to determine the genetic diversity among and within the Arkansas weedy Oryza sp. populations with respect to selected dormancy-linked loci.
Materials and Methods
Plant Materials
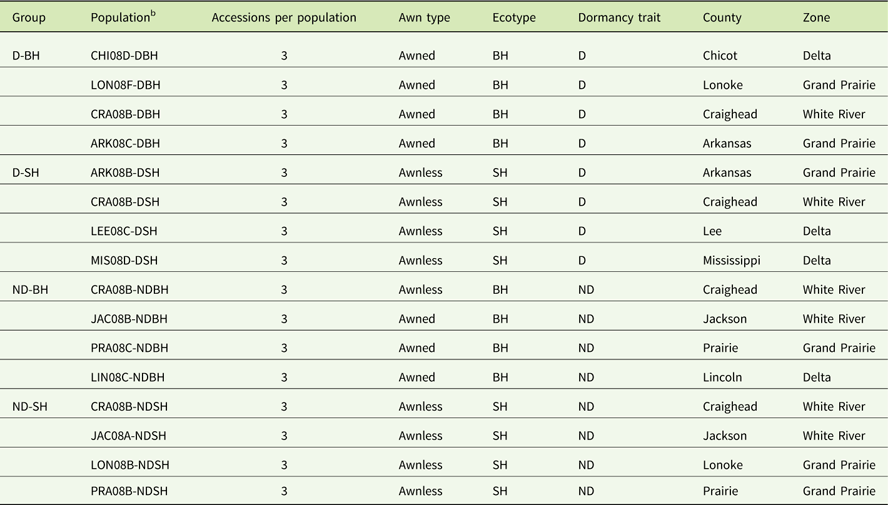
Thirty-two nondormant and 26 dormant weedy Oryza sp. accessions, equally representing blackhull and strawhull ecotypes, were selected (Tseng et al. Reference Tseng, Burgos, Shivrain, Alcober and Mauromoustakos2013). These plants were harvested between July and August 2008 from 17 fields across 9 counties, namely, Arkansas, Chicot, Craighead, Jackson, Lee, Lincoln, Lonoke, Mississippi, and Prairie. An accession represents a weedy Oryza sp. plant of a particular ecotype collected from a rice field. To confirm the dormancy category, seeds of all accessions were incubated at 30 C for 28 d. The germination assay was conducted as described in Tseng et al. (Reference Tseng, Burgos, Shivrain, Alcober and Mauromoustakos2013). From this germination assay, eight nondormant (≥80% GC) and eight dormant (≤20% GC) populations, equally representing strawhull and blackhull ecotypes, were selected (Table 1). Three accessions per population were included to assess the genetic diversity within populations. Three accessions per population were used, because the majority of populations had at least three accessions. The 16 populations were assigned to 4 groups: dormant blackhull (D-BH), nondormant blackhull (ND-BH), dormant strawhull (D-SH), and nondormant strawhull (ND-SH).
Table 1 List of weedy Oryza sp. populations used in this study showing respective group, zone, and county of collection.Footnote a

a Abbreviations: BH, blackhull; D, dormant; ND, nondormant; SH, strawhull.
b County codes: ARK, Arkansas; CHI, Chicot; CRA, Craighead; JAC, Jackson; LEE, Lee; LIN, Lincoln; LON, Lonoke; MIS, Mississippi; PRA, Prairie; letter before hyphen indicates field code.
DNA Extraction
From the germination assay, a germinated seed from each accession of the nondormant populations was planted in the greenhouse, and leaf tissues were harvested from each plant at the 3-leaf stage. For the dormant populations, DNA was extracted from a firm and nongerminated seed from each accession. Total genomic DNA was extracted from leaf tissues and seeds using a modified hexadecyltrimethylammonium bromide (CTAB) protocol (Doyle and Doyle Reference Doyle and Doyle1990). Briefly, 0.05 g of leaf tissue or a single dehulled seed was placed in 2-ml collection microtubes (Qiagen, Hilden, Germany) containing two stainless-steel beads (Qiagen). Each collection microtube had 500 µl of CTAB extraction buffer (containing 100 mM Tris-HCl, 20 mM EDTA, 2 M NaCl, 2% CTAB, 2% polyvinylpyrrolidone-40, 1 mM phenanthroline, and 0.3% β-mercaptoethanol) added. The sample was then homogenized using a MM400 mixer mill (Retsch, Haan, Germany) at 30 Hz for 2 min. After an equal volume of phenol:chloroform:isoamyl alcohol (25:24:1) was added to each tube, the mixture was incubated at 55 C for 45 min and centrifuged at 12,000 rpm for 10 min. The supernatant was transferred to a new 1.5-ml centrifuge tube (Eppendorf) containing an equal volume of absolute isopropanol, mixed by inverting the tube, and incubated overnight at -80 C. DNA was then pelleted by centrifugation at 12,000 rpm for 10 min. The DNA pellet was washed with absolute ethanol, air-dried, and resuspended in 30 ml of 1X TE (containing 10 mM Tris-HCl and 1 mM EDTA). The genomic DNA was quantified using a NanoDrop 2000c spectrophotometer (NanoDrop Technologies, Inc., Wilmington, DE), diluted to 100 ng/µl with deionized water, and used as a template in PCR.
Microsatellite DNA Amplification
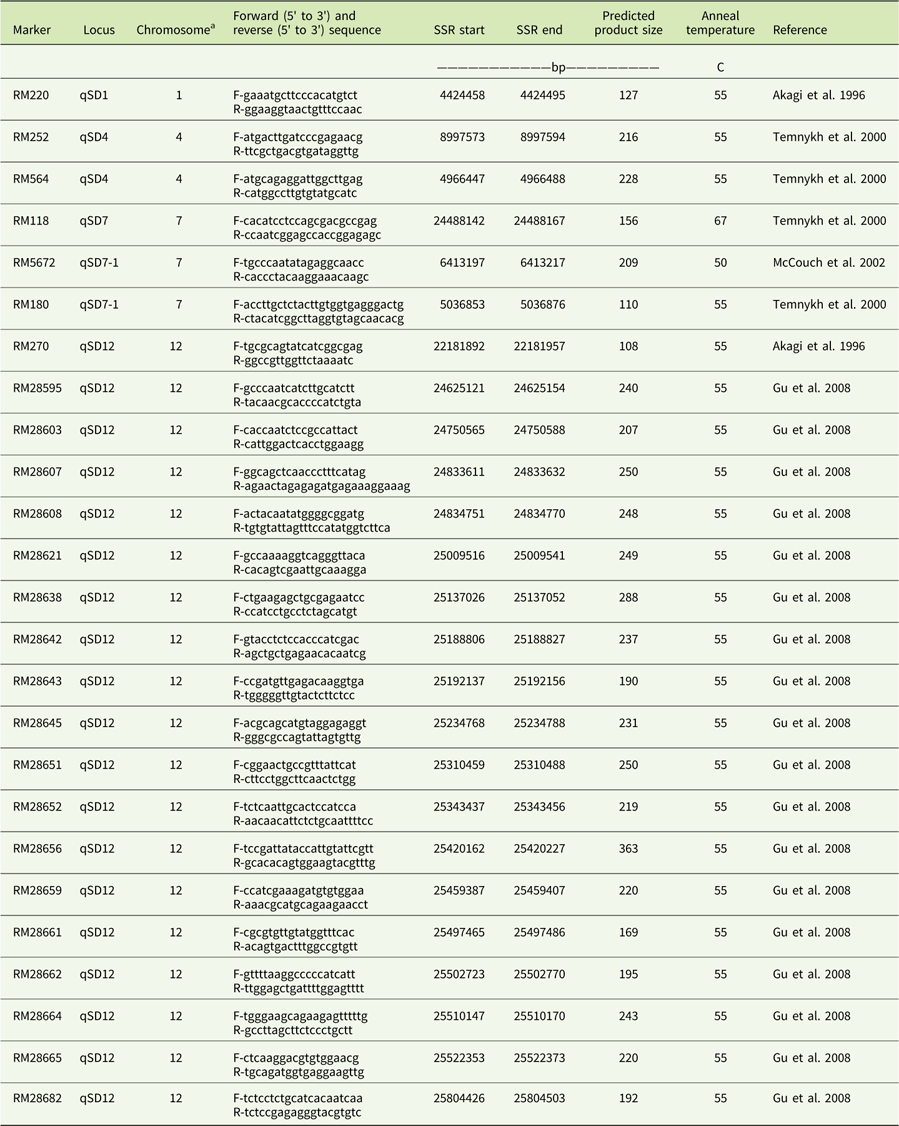
For PCR, 25 simple sequence repeat (SSR) primers distributed across four chromosomes were used (Table 2). PCR was carried out in 25-μl reaction mixtures containing 100 ng/μl DNA and 0.4 mM dNTPs each, 25 µ/ml Taq DNA polymerase (New England Biolabs, Ipswich, MA), 3 mM MgCl2, and 1 μM each of forward and reverse primers. The PCR profile started at 94 C for 5 min, followed by 35 cycles of denaturation at 94 C for 1 min, annealing at 55 C for 1 min, and extension at 72 C for 2 min. A final extension of 72 C for 7 min was included. The PCR products were electrophoresed in a 6% denaturing polyacrylamide gel at 180 V for 70 min. Gels were stained with ethidium bromide, and bands were photographed.
Table 2 List of 25 rice SSR markers used for DNA amplification in this study.

a Chromosomal location of markers with respect to rice.
Data Analysis
The individual bands were scored as codominant markers using Cross Checker 2.91 (Buntjier Reference Buntjer1999). Because the number of bands produced by the SSR markers ranged from 1 to 9, the bands were scored as binary characters to maintain the allelic information. Thus, data were entered into a binary matrix as discrete variables (1 for presence and 0 for absence of the band), and this data matrix was used to compute the allelic frequencies, observed alleles (n a), effective alleles (n e), number of alleles per locus (A), percentage of polymorphic loci (P), genetic distance (D), Shannon’s index (I), and Nei’s gene diversity (h), using POPGENE software v. 1.32 (Yeh et al. Reference Yeh, Yang, Boyle, Ye and Mao1999). The values of genetic distance were used to conduct cluster analysis with a UPGMA (unweighted pair group method with arithmetic mean) algorithm, and a dendrogram was constructed using the program TREEVIEW v. 1.52 (Page Reference Page1996). A one-way ANOVA and LSD t-test (P<0.05) were conducted to compare gene diversity values of SSR markers among and within weedy Oryza sp. populations and groups using JMP for Windows software (v. 10.0.0; SAS Institute, Cary, NC).
Results and Discussion
Marker Analysis
A total of 102 alleles with an average of 4.12 alleles per locus (ranging from 60 to 650 bp) was generated by the 25 SSR primers (Table 3). The highest number of alleles was scored at the locus RM564 (9 alleles) and the lowest number (1 allele) was scored at the loci RM28662 and RM28682. The highest level of gene diversity was detected at the locus RM28665 (h=0.486; Table 3), and the lowest level of gene diversity was detected at locus RM28656 (h=0.153; Table 3). The allelic frequency data indicated two monomorphic loci (RM28656 and RM28682) in the D-BH group, while loci RM5672 was monomorphic in both the D-SH and ND-SH groups (Table 4). The ND-BH group, however, showed the highest polymorphism, with all loci being polymorphic. Marker RM28656 was unique to blackhull, while marker RM5672 was unique to strawhull weedy Oryza sp. Among the D-BH populations, 92% of loci were polymorphic (Table 4). In addition, one rare allele, RM25 (140 bp), was observed exclusively in the D-BH populations (unpublished data). Among the ND-BH populations, all loci were polymorphic (Table 4), and one rare allele, RM28621 (290 bp), was observed (unpublished data). Twenty-four out of 25 loci were polymorphic among the D-SH populations and among the ND-SH populations (Table 4). No rare alleles were observed exclusively in the D-SH or ND-SH population.
Table 3 Allele number, gene diversity, and Shannon’s index of the 25 SSR markers.
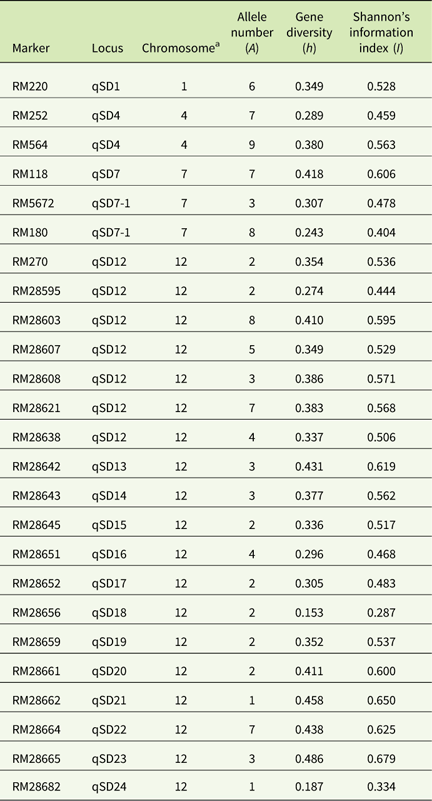
a Chromosomal location of markers with respect to rice.
Table 4 Genetic diversity among weedy Oryza sp. populations by groups based on polymorphisms of the 25 SSR markers.Footnote a
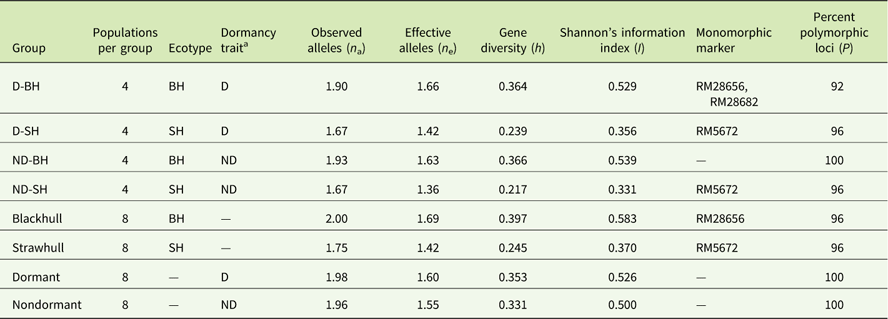
a Abbreviations: BH, blackhull; D, dormant; ND, nondormant; SH, strawhull.
Seed dormancy is a hereditary trait that varies from one genotype to another, and this variation is dependent on the environment (Baskin and Baskin Reference Baskin and Baskin1998; Gu et al. Reference Gu, Kianian and Foley2004; Hori et al. Reference Hori, Sugimoto, Nonoue, Ono, Matsubara, Yamanouchi, Abe, Takeuchi and Yano2010; Li et al. Reference Li, Zhou and Sang2006; Ye et al. Reference Ye, Foley and Gu2010). Many studies have used molecular approaches to investigate seed dormancy mechanisms in various species, including wild and cultivated rice and weedy Oryza sp. (Cai and Morishima Reference Cai and Morishima2000; Gu et al. Reference Gu, Kianian and Foley2004, Reference Gu, Foley, Horvath, Anderson, Feng, Zhang, Mowry, Ye, Suttle, Kadowaki and Chen2011; Lang Reference Lang1996; Li and Foley Reference Li and Foley1997). Most of these studies involved identification of quantitative trait loci (QTLs) associated with seed dormancy. QTLs are regions in the genome that are associated with complex traits, in this case, seed dormancy. A study using 245 restriction fragment length polymorphism markers was able to detect 5 QTLs linked to seed dormancy in cultivated rice (Lin et al. Reference Lin, Sasaki and Yano1998). These QTLs accounted for about 48% of the total phenotypic variation and were located on chromosomes 3, 5, 7, and 8. Furthermore, qPHS-7 was found to be associated with after-ripening time, whereby increasing the afterripening period released the qPHS-7–linked dormancy in rice. In wild rice, three QTLs, namely grm 1.1 (in chromosome 1), grm 4.1 (in chromosome 4), and grm 6.1 (in chromosome 6) were identified to be associated with decreased seed germination (Thomson et al. Reference Thomson, Tai, McClung, Lai, Hinga, Lobos, Xu, Martinez and McCouch2003). Gu et al. (Reference Gu, Kianian and Foley2004) used 151 rice microsatellite markers distributed across 12 chromosomes to identify seed dormancy QTLs in an EM93-1/SS18-2 cross, where EM93-1 is a nondormant rice cultivar, while SS18-2 is a dormant weedy Oryza sp. accession from Thailand. Four of the QTLs, qSD-4, qSD-6, qSD-8, and qSD-12, were located on chromosomes 4, 6, 8, and 12, respectively, while qSD-7-1 and qSD-7-2 were located on chromosome 7. Locus qSD-12 was associated with the after-ripening period, whereas locus qSD-7-1 was found to be linked to red pericarp color and was later found to be responsible for increasing abscisic acid production, which in turn induces seed dormancy (Gu et al. Reference Gu, Foley, Horvath, Anderson, Feng, Zhang, Mowry, Ye, Suttle, Kadowaki and Chen2011). Markers used in this study were selected from the abovementioned studies based on their high association with seed dormancy in weedy Oryza sp. (Table 2). We found two markers that were able to discriminate between blackhull and strawhull weedy Oryza sp. However, none of the markers were found to be unique to dormant or nondormant weedy Oryza sp. alone. This is contrary to the findings of Gu et al. (Reference Gu, Kianian and Foley2004), who reported that all these markers were tightly linked to dormant weedy Oryza sp. This difference may be due to the difference in biotypes used. The materials used in the current study were from field populations in Arkansas, USA, while Gu et al. (Reference Gu, Kianian and Foley2004) used a pure line derived by crossing a nondormant strawhull rice (EM93-1) with dormant blackhull weedy Oryza sp. (SS18-2) originating from Thailand. Although we did not find any rare alleles to discriminate dormant and nondormant plants of the strawhull ecotype, we found two alleles, RM28621 (140 bp) and RM28682 (290 bp) that can be used to distinguish between dormant and nondormant plants, respectively, of the blackhull ecotype. To this date, there is no information on alleles that are specific to dormant or nondormant blackhull weedy Oryza sp. These rare alleles are of immense importance, as they can be used to ascertain whether a blackhull weedy Oryza sp. population infesting a rice field is dormant or not.
Genetic Diversity among Oryza sp. Ecotypes
Gene diversity (h) and Shannon’s index (I) are methods most commonly used for measuring genetic variation (Nei Reference Nei1978). Gene diversity is a measure of expected heterozygosity, while Shannon’s index is a measure of degree of uncertainty in determining the species an individual would belong to if randomly picked from a group of species. Higher values of gene diversity and Shannon’s index would indicate higher genetic diversity. A positive correlation of genetic diversity with weedy Oryza sp. groups, ecotype, dormancy trait, populations, and county of collection (P<0.05; Figures 1 and 2; Table 4) was observed. Overall, a substantial level of genetic diversity was detected among Oryza sp. populations across the dormancy loci (mean h=0.355, I=0.534).
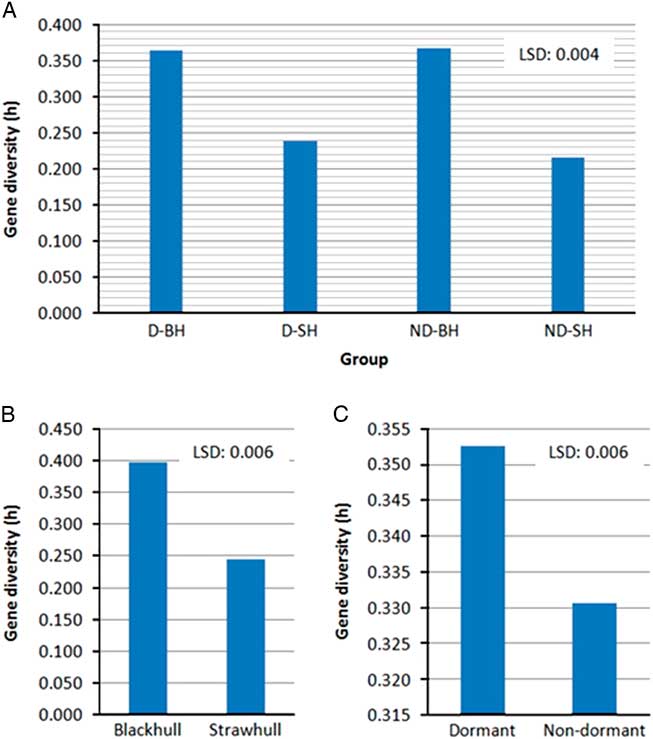
Figure 1 Variation in gene diversity among (A) weedy Oryza sp. groups, (B) ecotypes, and (C) dormancy types. Abbreviations: D-BH, dormant blackhull; D-SH, dormant strawhull; ND-BH, nondormant blackhull; ND-SH, nondormant strawhull. Gene diversity values are among all weedy Oryza sp. accessions within each group.
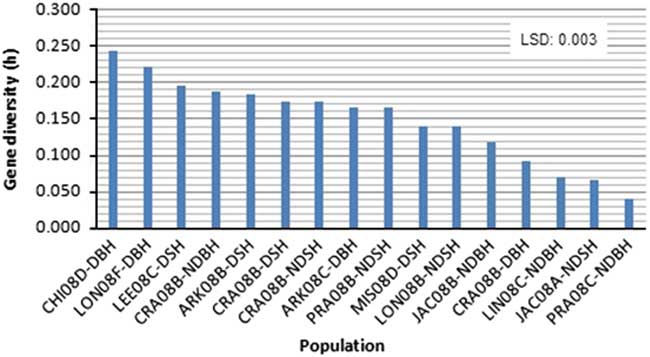
Figure 2 Variation in mean gene diversity among weedy Oryza sp. populations based on 25 SSR markers linked to four dormancy loci. Gene diversity values are among three Oryza sp. accessions within each population. Please refer to Table 1 for population codes.
Among the two primary ecotypes, the blackhull groups possessed the highest level of gene diversity and Shannon’s index (h=0.398, I=0.584) when compared among themselves (Figure 1; Table 4). In contrast, the strawhull group showed lower levels of genetic diversity (h=0.245, I=0.370) among populations. Also, among the four dormancy categories, the blackhull groups D-BH and ND-BH showed the highest genetic diversity (h=0.367, I=0.539, and h=0.365, I=0.530, respectively). The ND-SH group of populations were least diverse (h=0.218, I=0.332) (Figure 1; Table 4). Among the blackhull groups, gene diversity within populations ranged from 0.092 to 0.244 for the D-BH group and from 0.039 to 0.187 for the ND-BH group (Figure 2; Table 3). The highest level of gene diversity was found within the CHI08D-DBH and CRA08B-NDBH populations of the D-BH and ND-BH groups, respectively, whereas the lowest gene diversity was found within the CRA08B-DBH and PRA08C-NDBH populations of the D-BH and ND-BH groups, respectively. The gene diversity within populations ranged from 0.139 to 0.196 for the D-SH group and from 0.065 to 0.174 for the ND-SH group. The highest level of gene diversity was within the LEE08C-DSH and CRA08B-NDSH populations of the D-SH and ND-SH groups, respectively, whereas the lowest gene diversity was within the MIS08D-DSH and JAC08A-NDSH populations of the D-SH and ND-SH groups, respectively.
Gene diversity among weedy Oryza sp. accessions found in this study (h=0.355) was similar to gene diversity of the overall genome (h=0.407) reported by Shivrain et al. (Reference Shivrain, Burgos, Scott, Gbur, Estorninos and McClelland2010b). These results also complement previous observations on high variability in seed dormancy among and within weedy Oryza sp. populations (Do Lago Reference Do Lago1983; Veasey et al. Reference Veasey, Karasawa, Santos, Rosa, Mamani and Oliveira2004). The high level of gene diversity among blackhull weedy Oryza sp. compared with the strawhull weedy Oryza sp. may be because blackhull is more closely related to wild rice (Londo and Schaal Reference Londo and Schaal2007; Vaughan et al. Reference Vaughan, Ottis, Prazak-Havey, Bormans, Sneller, Chandler and Park2001), and the wild rice group displays higher gene diversity compared with cultivated and weedy Oryza sp. groups (Londo and Schaal Reference Londo and Schaal2007). Also, blackhull weedy Oryza sp., in general, shows higher phenotypic and genetic variation compared with strawhull weedy Oryza sp. (Burgos et al. Reference Burgos, Singh, Tseng, Black, Young, Huang, Hyma, Gealy and Caicedo2014; Shivrain et al. Reference Shivrain, Burgos, Agrama, Lawton‐Rauh, Lu, Sales, Boyett, Gealy and Moldenhauer2010a, Reference Shivrain, Burgos, Scott, Gbur, Estorninos and McClelland2010b). Thus, it is not surprising that the blackhull weedy Oryza sp. populations are more genetically diverse than the strawhull types. Because the majority of the accessions were awned blackhull and awnless strawhull, our data conform to previous findings of Shivrain et al. (Reference Shivrain, Burgos, Scott, Gbur, Estorninos and McClelland2010b), wherein the awned blackhull group had higher gene diversity (0.337) than the awnless strawhull group (0.239) with respect to genome-wide markers. These findings also support the high intrapopulation variation in dormancy in blackhull weedy Oryza sp. observed in our previous studies (Tseng et al. Reference Tseng, Burgos, Shivrain, Alcober and Mauromoustakos2013).
Genetic Diversity among Dormant and Nondormant Oryza sp.
The mean gene diversity and Shannon’s index among individuals for the dormant populations was higher (mean h=0.177, I=0.254), than for the nondormant populations (mean h=0.120, I=0.171) (Figure 1). Also, when comparing among populations, the dormant group showed higher diversity (h=0.353, I=0.526) than the nondormant group (h=0.331, I=0.500) (Table 4). Higher genetic diversity is known to increase the longevity or fitness of many plant and animal species (Danzmann et al. Reference Danzmann, Ferguson, Allendorf and Knudsen1986; Ledig Reference Ledig1986; Wills Reference Wills1981). Greater levels of genetic diversity help a population adapt to a wide range of environmental changes, thus allowing them to persist or dominate. The dormant weedy Oryza sp. Populations, which show higher gene diversity than the nondormant populations, are expected to persist longer in the soil. It is therefore very important to adopt an intensive weedy Oryza sp. management strategy in locations infested with a dormant weedy Oryza sp. ecotype to prevent new deposits of weedy Oryza sp.
Effect of County of Origin on Genetic Diversity
Among the nine counties represented by the populations, the Chicot County populations showed the highest genetic diversity among individuals (h=0.244, I=0.350), while the Jackson County and Lincoln County populations showed the lowest genetic diversity among their individuals (mean h=0.092, I=0.131, and h=0.070, I=0.100, respectively) (Table 5). The high genetic diversity of weedy Oryza sp. populations from Chicot County is not yet understood. One theory is that Chicot county, being at the border of major rice-producing states (Arkansas, Mississippi, and Louisiana), embodies the confluence of a significant volume of rice grains and the seed-distribution hub across these states. Louisiana and Mississippi have very diverse weedy Oryza sp. populations (Constantin Reference Constantin1960; Do Lago Reference Do Lago1983). Thus, Chicot County also acts as the gateway for interchange of weedy Oryza sp. seeds being moved along with rice grain. The geographical zones, however, had no significant impact on genetic diversity of the weedy Oryza sp. populations, implying that the evolution of dormancy trait is not localized to a particular zone in Arkansas.
Table 5 Genetic diversity within the 16 populations based on polymorphisms of 25 SSR markers.Footnote a

a Abbreviations: B, blackhull; D, dormant; ND, nondormant; SH, strawhull.
b County codes: ARK, Arkansas; CHI, Chicot; CRA, Craighead; JAC, Jackson; LEE, Lee; LIN, Lincoln; LON, Lonoke; MIS, Mississippi; PRA, Prairie; letter before hyphen indicates field code.
c Gene diversity values are among three plants within each population.
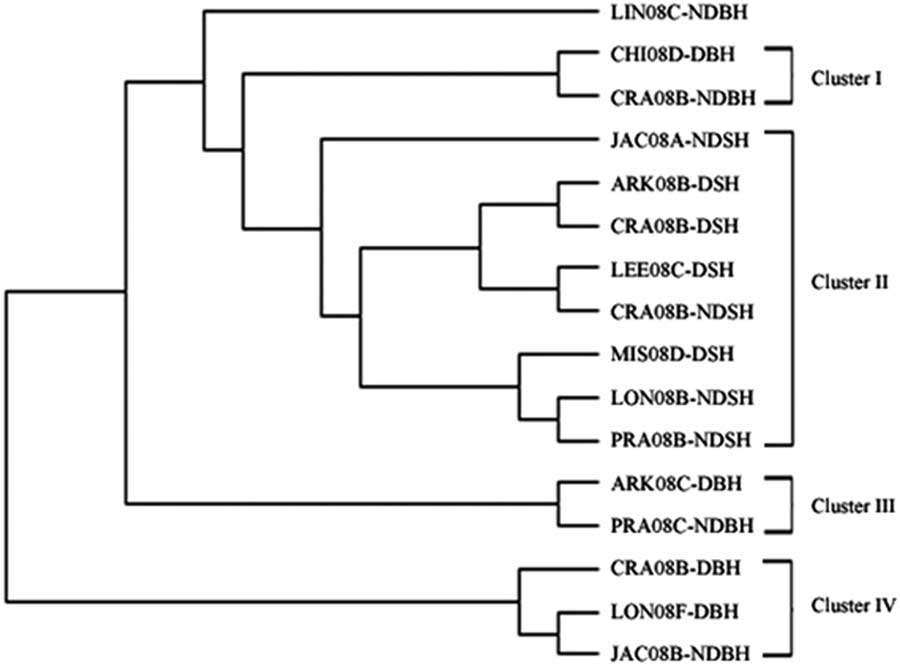
Cluster Analysis
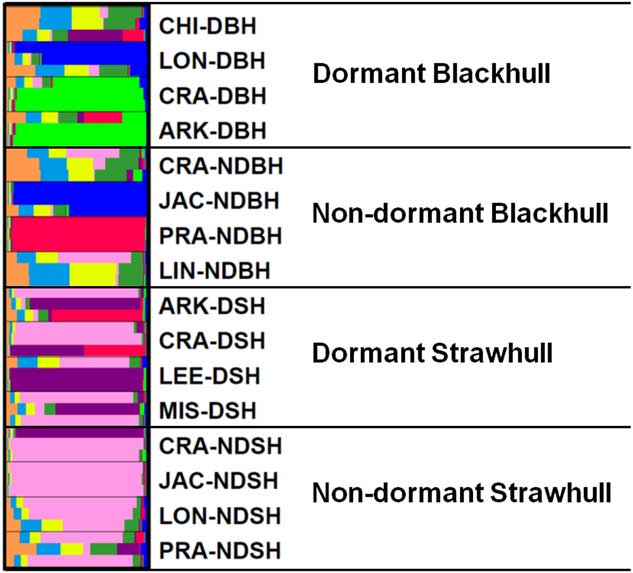
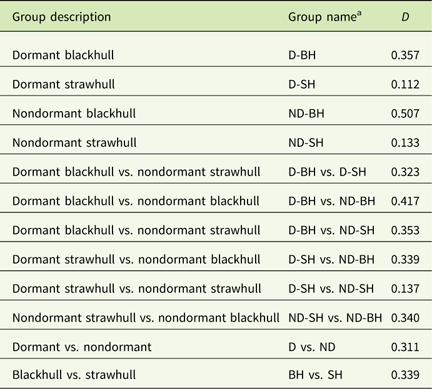
The UPGMA-based dendrogram obtained from these data is shown in Figure 3. Populations were grouped into four clusters consisting of 15 out of 16 populations. The remaining population, LIN08C-NDBH, shared less similarity with other populations and was therefore not included in any cluster. Clusters I, III, and IV, comprised only blackhull ecotype, and included two, two, and three populations, respectively. Cluster II was the largest, composed of only strawhull populations. In this large cluster, there were two subclusters, one comprising mostly dormant populations, and the other comprising mostly nondormant populations. One population, JAC08A-NDSH, did not cluster with any population, as it was most distant from the other strawhull populations. Each of the three clusters, Clusters I, III, and IV, contained a mixture of populations with varying levels of dormancy and belonging to different counties of origin, thus indicating the markers were not tightly influenced by mircroenvironments associated with the field of origin. For example in Cluster IV, two out of the three populations, LON08F-DBH (from Lonoke county; dormant) and JAC08B-NDBH (from Jackson county; nondormant), were closely related to each other and thus clustered together. The genetic distance between the dormant and nondormant strawhull groups appeared to be lower (D=0.137) than between the dormant and nondormant blackhull groups (D=0.417) (Table 6). Genetic diversity was higher within the two blackhull groups (D=0.357 and 0.507, respectively) than within the two strawhull groups (D=0.112 and 0.133, respectively). The population structure graph clearly distinguishes the strawhull populations from the blackhull populations (Figure 4). The genetic structures of blackhull populations are admixed. No differences were observed between dormant and nondormant populations belonging to the same ecotype.

Figure 3 UPGMA (unweighted pair group method with arithmetic mean)-based dendrogram of 16 weedy Oryza sp. populations based on polymorphisms of 25 SSR markers, using Nei’s (Reference Nei1972) genetic distance. Please refer to Table 1 for population codes.

Figure 4 Population structure of 16 weedy Oryza sp. populations based on polymorphisms of 25 SSR markers. Please refer to Table 1 for population codes.
Table 6 Genetic distance (D) (Nei 1972) within and between weedy Oryza sp. groups based on 25 SSR markers.

a Abbreviations: B, blackhull; D, dormant; ND, nondormant; SH, strawhull.
The populations fell into four clusters mainly based on hull color ecotype, indicating that hull color had a bigger influence on genetic clustering than dormancy trait. By extension, this indicates that the markers developed for dormancy trait were mostly related to hull color rather than dormancy. This finding is logical, because the mapping population used to develop the markers was derived from a cross between a nondormant strawhull and a dormant blackhull. Essentially, the cosegragation of markers with dormancy trait in that population could be confounded with segregation of genes controlling hull color. Dormant and nondormant weedy Oryza sp. populations of blackhull ecotype are more distinct than those of the strawhull ecotype. Also, plants of the blackhull ecotype had higher level of genetic variation among themselves than plants of the strawhull ecotype. Similar results reported by Gealy et al. (Reference Gealy, Tai and Sneller2002) indicated that the genetic distance of the blackhull group was higher (D=0.33) than that of the strawhull group (D=0.20). The strawhull and blackhull are genetically diverse groups with a genetic distance of 0.339. Similar findings have been reported in other studies in which the two major ecotypes, blackhull and strawhull, were shown to be genetically distinct from each (Burgos et al. Reference Burgos, Singh, Tseng, Black, Young, Huang, Hyma, Gealy and Caicedo2014; Gealy et al. Reference Gealy, Tai and Sneller2002; Londo and Schaal Reference Londo and Schaal2007; Shivrain et al. Reference Shivrain, Burgos, Scott, Gbur, Estorninos and McClelland2010b). However, the genetic distance values reported in previous studies on weedy Oryza sp. genetic diversity are generally higher than those reported in our study. This is because most of these studies used SSR markers nonspecific to dormancy loci and were distributed across the genome, in contrast to the dormancy-linked loci on just four chromosomes used in this study. This, however, indicates that the dormancy loci used in this study are less polymorphic compared with the genome-wide loci used for genetic diversity studies of weedy Oryza sp.
Weedy Oryza sp. populations used in this study exhibit high genetic diversity with respect to seed dormancy loci. This genetic diversity depends on the ecotype, dormancy level, and county of collection. The blackhull weedy Oryza sp. groups are most dormant and possess a higher level of genetic diversity than the strawhull weedy Oryza sp. groups. Genetic diversity is also higher in the dormant than in the nondormant group. Variation in genetic diversity was also observed among the nine counties, and populations from Chicot County showed the highest diversity. The high genetic variability of seed dormancy among and within weedy Oryza sp. populations presents a challenge for effective weedy Oryza sp. management in Arkansas. Rice producers should not grow rice consecutively for more than a year, especially if dormant weedy Oryza sp. has been detected in the field. This could prevent the dormant weedy Oryza sp. seeds from spreading and also reduce the weedy Oryza sp. soil seedbank. Moreover, the two alleles unique to dormant and nondormant blackhull populations, respectively, can be used in the identification of dormant and nondormant phenotypes among blackhull weedy Oryza sp. populations. These unique alleles can also be used in follow-up studies on molecular mechanisms involved in weedy Oryza sp. seed dormancy. Because of the weak association of some markers used in this study to seed dormancy, there is a need to develop new set of dormancy-linked markers using dormant and nondormant strawhull versus dormant and nondormant blackhull populations.
Acknowledgments
We thank the University of Arkansas County Extension agents for their assistance in sample collection. We thank Leopoldo Estorninos Jr, Reiofeli Salas, Silvia Fogliatto, and Carlos Schaedler for their assistance with the germination assay. This study was funded by the USDA National Research Initiative grant no. 2009-35320- 05036. The authors have no conflict of interest to declare.