The developmental nature of autism spectrum disorder (ASD) likely implies that different neural mechanisms may play a role during the unfolding of the disorder over age. The clearest example hereof is the abnormal overgrowth of the whole brain in ASD at early ages, followed by abnormal decelerated growth during puberty and possible degeneration in adulthood (Courchesne et al. Reference Courchesne, Campbell and Solso2011). A recent meta-analysis reported head circumference to be significantly larger in individuals with ASD compared with controls, with 822/5225 (15.7%) individuals with ASD displaying macrocephaly (Sacco et al. Reference Sacco, Gabriele and Persico2015). Further, structural brain imaging studies found relatively larger differences in brain volumes between individuals with ASD and controls in low functioning than in high functioning individuals with ASD (Sacco et al. Reference Sacco, Gabriele and Persico2015). Finally, the meta-analysis reported a significant interaction between age and total brain volume, resulting in larger head circumference and brain size during early childhood (Sacco et al. Reference Sacco, Gabriele and Persico2015). Age-specific anatomy may also be present for subcortical structures in ASD, since a systematic review and meta-analysis reported a modifying effect of age on amygdala size and of age and IQ on the volume of cerebellar vermal lobules VI–VII in ASD (Stanfield et al. Reference Stanfield, McIntosh, Spencer, Philip, Gaur and Lawrie2008; Sacco et al. Reference Sacco, Gabriele and Persico2015).
Similarly, sex is also a likely moderating factor in relating ASD to neuroanatomical correlates, with ASD being a male predominant disorder (Van Wijngaarden-Cremers et al. Reference Van Wijngaarden-Cremers, van Eeten, Groen, Van Deurzen, Oosterling and Van der Gaag2014). There are well known dissimilar patterns of brain development in healthy boys and girls, with large sex differences during development on the caudate nucleus, amygdala, and hippocampus and girls have faster maturing brains than boys (Giedd et al. Reference Giedd, Raznahan, Mills and Lenroot2012). A meta-analysis found regional sex differences in volume and tissue density of various brain structures, including the amygdala, hippocampus and insula, areas known to be implicated in sex-biased neuropsychiatric conditions (Ruigrok et al. Reference Ruigrok, Salimi-Khorshidi, Lai, Baron-Cohen, Lombardo, Tait and Suckling2014). However, most previous studies on the brain anatomy of ASD included no or only few female participants, making it unknown if male-reported anatomical differences in ASD also pertain to females with ASD.
Yet, despite these age and sex effects on brain anatomy potentially interacting with ASD diagnosis, attempts are still made to design one overarching diagnostic classification algorithm to aid in the diagnosis of ASD. The study by Ecker et al. (Reference Ecker, Suckling, Deoni, Lombardo, Bullmore, Baron-Cohen, Catani, Jezzard, Barnes, Bailey, Williams and Murphy2012) is often cited as supporting the view that such a diagnostic classification algorithm is feasible, with a high level of accuracy when using structural brain imaging measures in advanced machine learning algorithms (Support Vector Machines). Since then, at least 20 papers have been published using magnetic resonance imaging (MRI)-based single subject prediction of ASD (see for extensive review Wolfers et al. Reference Wolfers, Buitelaar, Beckmann, Franke and Marquand2015; Arbabshirani et al. Reference Arbabshirani, Plis, Sui and Calhoun2017). With varying levels of classification accuracy, what stands out is that no overarching diagnostic classification algorithm can be derived that can differentiate all ASD patients from controls with acceptable sensitivity and specificity across studies. Importantly, in studies matching case–control subjects for age and sex, the classification algorithm varies substantially between participant pairs. These data therefore suggest that it is too simplistic to search for one common neurobiological substrate underlying ASD across development and sex. Instead, MRI markers may be used to stratify ASD into biologically more homogeneous subtypes (Marquand et al. Reference Marquand, Rezek, Buitelaar and Beckmann2016).
The current study was designed to advance existing work by examining the main and combined (interactive) effects of age and sex on (sub)cortical gray matter (GM) volumes in subjects with and without ASD. The Autism Brain Imaging Data Exchange (ABIDE) dataset was used for this purpose (Di Martino et al. Reference Di Martino, Yan, Li, Denio, Castellanos, Alaerts, Anderson, Assaf, Bookheimer, Dapretto, Deen, Delmonte, Dinstein, Ertl-Wagner, Fair, Gallagher, Kennedy, Keown, Keysers, Lainhart, Lord, Luna, Menon, Minshew, Monk, Mueller, Müller, Nebel, Nigg, O'Hearn, Pelphrey, Peltier, Rudie, Sunaert, Thioux, Tyszka, Uddin, Verhoeven, Wenderoth, Wiggins, Mostofsky and Milham2014). The dataset includes 539 individuals with ASD and 573 age- and sex-matched controls, with standardized phenotyping and scanning approaches across sites (Di Martino et al. Reference Di Martino, Yan, Li, Denio, Castellanos, Alaerts, Anderson, Assaf, Bookheimer, Dapretto, Deen, Delmonte, Dinstein, Ertl-Wagner, Fair, Gallagher, Kennedy, Keown, Keysers, Lainhart, Lord, Luna, Menon, Minshew, Monk, Mueller, Müller, Nebel, Nigg, O'Hearn, Pelphrey, Peltier, Rudie, Sunaert, Thioux, Tyszka, Uddin, Verhoeven, Wenderoth, Wiggins, Mostofsky and Milham2014). Previous reports using this dataset unfortunately did not explicitly analyze and/or report the combined effects of age and sex on case–control differences (Lai et al. Reference Lai, Lombardo, Suckling, Ruigrok, Chakrabarti, Ecker, Deoni, Craig, Murphy, Bullmore and Baron-Cohen2013; Nielsen et al. Reference Nielsen, Zielinski, Fletcher, Alexander, Lange, Bigler, Lainhart and Anderson2013; Blackmon et al. Reference Blackmon, Ben-Avi, Wang, Pardoe, Di Martino, Halgren, Devinsky, Thesen and Kuzniecky2015; Cerliani et al. Reference Cerliani, Mennes, Thomas, Di Martino, Thioux and Keysers2015; Chen et al. Reference Chen, Keown, Jahedi, Nair, Pflieger, Bailey and Müller2015a , Reference Chen, Kelly, Castellanos, He, Zuo and Reiss b ; Di & Biswal, Reference Di and Biswal2015; Jiang et al. Reference Jiang, Hou, Yang, Yang and Zuo2015; Kucharsky Hiess et al. Reference Kucharsky Hiess, Alter, Sojoudi, Ardekani, Kuzniecky and Pardoe2015; Schaer et al. Reference Schaer, Kochalka, Padmanabhan, Supekar and Menon2015; Supekar & Menon, Reference Supekar and Menon2015; Valk et al. Reference Valk, Di Martino, Milham and Bernhardt2015; Venkataraman et al. Reference Venkataraman, Duncan, Yang and Pelphrey2015; Haar et al. Reference Haar, Berman, Behrmann and Dinstein2016; Riddle et al. Reference Riddle, Cascio and Woodward2016). In the current study, we performed an analysis of whole brain GM and white matter (WM) volume and subcortical structure volumes in a large subsample of this dataset (N = 859; 6–27 years).
Material and methods
ABIDE dataset
For all analyses, we used the publicly available MRI datasets from the ABIDE program (Di Martino et al. Reference Di Martino, Yan, Li, Denio, Castellanos, Alaerts, Anderson, Assaf, Bookheimer, Dapretto, Deen, Delmonte, Dinstein, Ertl-Wagner, Fair, Gallagher, Kennedy, Keown, Keysers, Lainhart, Lord, Luna, Menon, Minshew, Monk, Mueller, Müller, Nebel, Nigg, O'Hearn, Pelphrey, Peltier, Rudie, Sunaert, Thioux, Tyszka, Uddin, Verhoeven, Wenderoth, Wiggins, Mostofsky and Milham2014). ABIDE shares 1112 structural T1 MRI high-resolution images and phenotypic information on ASD, IQ, age, and sex. In total, the dataset comprises 539 individuals with ASD and 573 age-matched controls (7–64 years) from 17 different sites. Sites verified clinical DSM-IV diagnoses of ASD by combining clinical judgment and ADOS-G/ADI-R, clinical judgment only or ADOS-G/ADI-R only (see online Supplementary Fig. S6 and Di Martino et al. Reference Di Martino, Yan, Li, Denio, Castellanos, Alaerts, Anderson, Assaf, Bookheimer, Dapretto, Deen, Delmonte, Dinstein, Ertl-Wagner, Fair, Gallagher, Kennedy, Keown, Keysers, Lainhart, Lord, Luna, Menon, Minshew, Monk, Mueller, Müller, Nebel, Nigg, O'Hearn, Pelphrey, Peltier, Rudie, Sunaert, Thioux, Tyszka, Uddin, Verhoeven, Wenderoth, Wiggins, Mostofsky and Milham2014). All contributions were based on studies approved by the local Institutional Review Boards, and data were fully anonymized. All data distributed were visually inspected before release (Di Martino et al. Reference Di Martino, Yan, Li, Denio, Castellanos, Alaerts, Anderson, Assaf, Bookheimer, Dapretto, Deen, Delmonte, Dinstein, Ertl-Wagner, Fair, Gallagher, Kennedy, Keown, Keysers, Lainhart, Lord, Luna, Menon, Minshew, Monk, Mueller, Müller, Nebel, Nigg, O'Hearn, Pelphrey, Peltier, Rudie, Sunaert, Thioux, Tyszka, Uddin, Verhoeven, Wenderoth, Wiggins, Mostofsky and Milham2014).
Participants
We assessed the distribution, mean, standard deviation and range of age, sex, full-scale IQ, and number of participants per scanner site to survey group characteristics (see online Supplementary Figs S2–S5). The average age of the complete sample (N = 1112) was 17.05 years (s.d. = 8.04, range = 6.5–64.0). The age distribution was skewed, with 975/1112 (87.7%) being younger than 27.0 years. As the group with age 27.0 or older had a very broad distribution in age range and the regression analyses examining age effects were not robust in this group, the data of this subgroup were excluded from further analyses (see Fig. 1 flow chart). The average FIQ of the complete sample [available in 1084/1112 (97.5%)] was 108.3 (s.d. = 15.0, range = 41–148), showing a normal distribution. Participants with a FIQ <70, >130 or missing were excluded in a second step to approximate a homogeneous sample (n = 76, 7.8%). In a third step, 40/899 (4.4%) subjects were excluded from analyses because the manual visual inspection revealed geometric inaccuracies of segmentation. After applying these selection steps, 859 participants remained (77.2% of original sample), with 401 (46.7%) ASD and 458 (53.3%) control participants that did not differ in handedness (% right handed ASD = 87.3, % right handed controls = 90.0; χ2 = 1.33, p = 0.51), but did differ slightly in age [mean (M) age ASD = 15.1, M age controls = 15.6; F = 4.54, p = 0.03], sex (% males ASD = 87.6, % males controls = 82.6; χ2 = 4.44, p = 0.04), and FIQ (M FIQ ASD = 103.3, M FIQ controls = 110.2; F = 68.2, p < 0.001).
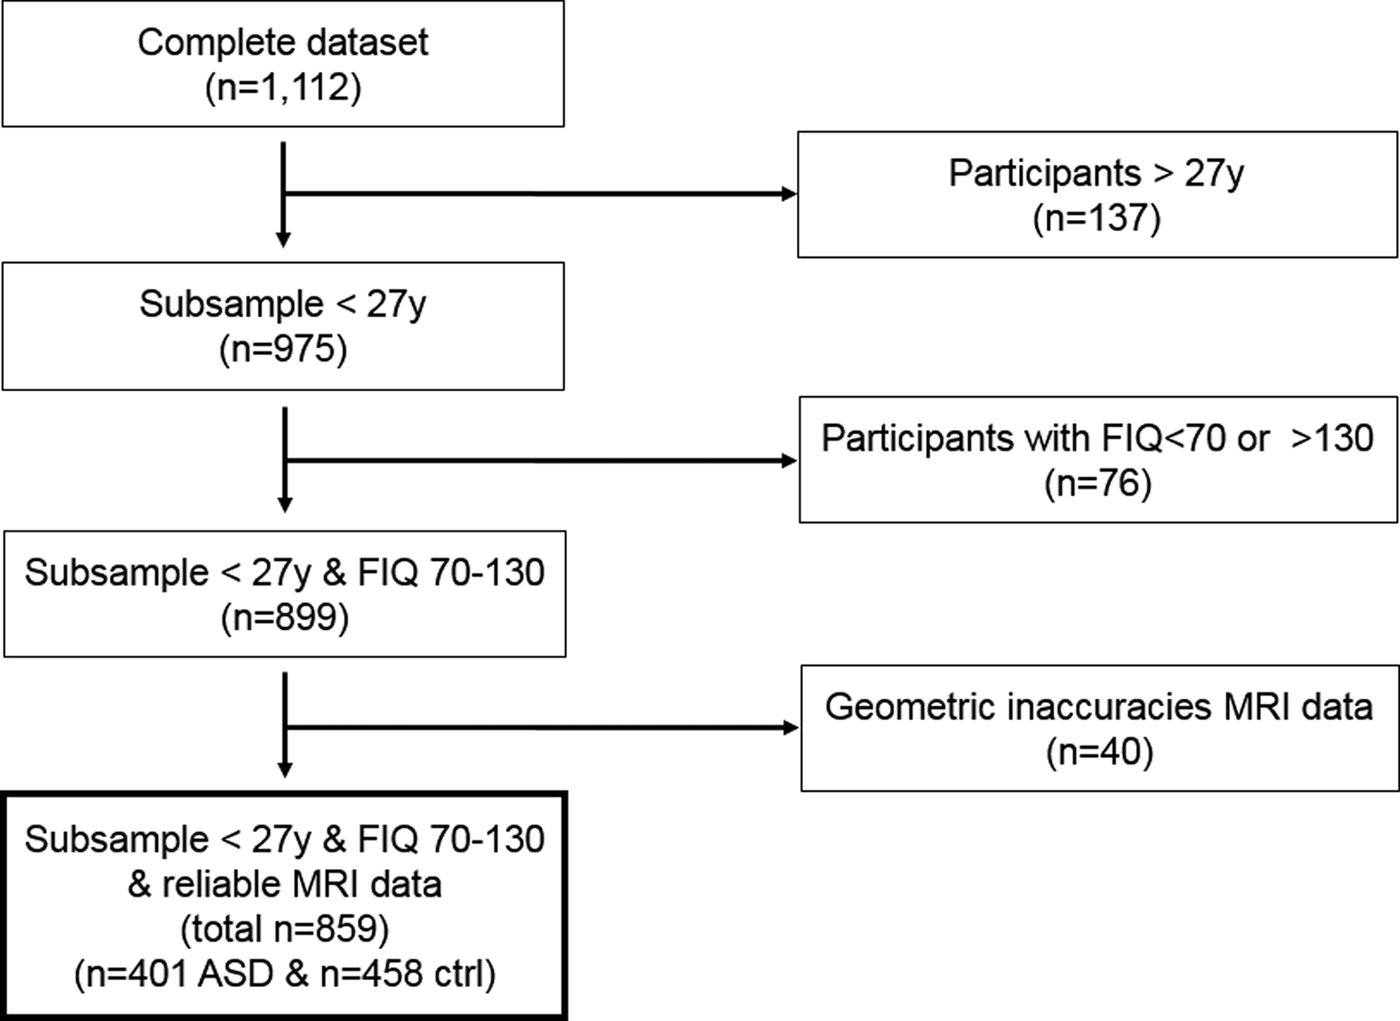
Fig. 1. Flow chart illustrating the number of participants remaining after applying selection criteria.
Structural image preprocessing and volumetric analysis
All images were skull stripped using the 3DSkullStrip algorithm in AFNI (Cox, Reference Cox1996). FIRST (v5.0.0) was used to derive left and right hippocampus, amygdala, thalamus, globus pallidus, nucleus accumbens, caudate nucleus, and putamen volumes (Patenaude et al. Reference Patenaude, Smith, Kennedy and Jenkinson2011). FIRST is part of the FMRIB's Software Library (FSL) and performs both registration and segmentation. Registration entails an affine transformation with 12 degrees of freedom of the T1 structural MRI scan onto the 152MNI standard space. After subcortical registration, a sub-cortical mask is applied to segment the subcortical structures based on shape models and voxel intensities. The first author (WZ) visually inspected all registrations and segmentations, while blinded to diagnostic group. Registration or segmentation was deemed inaccurate (for example, insufficient contrast or poor image quality) in 40/899 subjects, thus yielding 859 segmented scans. FMRIB's Automated Segmentation Tool (FAST) was used to obtain WM and GM volumes (Zhang et al. Reference Zhang, Brady and Smith2001). FAST segments MR images into different tissue types, while also correcting for spatial intensity variations using a hidden Markov random field model and an associated Expectation–Maximization algorithm. The results of FIRST and FAST are robust and reliable and comparable with manual segmentation (Morey et al. Reference Morey, Petty, Xu, Hayes, Wagner, Lewis, LaBar, Styner and McCarthy2009; Zhang et al. Reference Zhang, Brady and Smith2001). FAST is superior to other automated segmentation algorithms with respect to its volume detection accuracy (Eggert et al. Reference Eggert, Sommer, Jansen, Kircher and Konrad2012).
Data analyses
All analyses were carried out in SPSS version 24. Variables were normally distributed. Linear mixed models were used for the analyses with site as a random factor, allowing for the investigation of effects while correcting for non-independency of data collected per scanning site. The following main effects were examined: diagnosis (ASD, control), age (linear, quadratic), sex (male, female) and left-and-right hemisphere (as within subjects’ measure; i.e. the left and right volume) on the brain volumetric measures (i.e. total GM, total WM, hippocampus, amygdala, thalamus, pallidus, nucleus accumbens, caudate nucleus, putamen). Age (linear and quadratic) was demeaned (i.e. centered) to reduce potential multicollinearity. All two, three and four-way interactions (diagnosis by sex by age/age2 by right–left hemisphere) were also implemented in the initial model. The model was simplified by eliminating the non-significant interaction effects, starting with the highest order effects. Main effects were never dropped from the model. All volumetric analyses were carried out with and without covarying for total brain volume (the sum of total GM volume and total WM volume) and FIQ to examine effects of these potential confounders. In order not to miss out on potentially important effects, a lenient alpha of 0.05 was considered significant. Cohen's d was used to indicate the effect size. We considered d = 0.2–0.5 as a small, d = 0.5–0.8 as a medium, and d > 0.8 as a large effect size (Cohen, Reference Cohen1969). For post hoc analyses and visualization of results, age was stratified into three groups of equal age-range (child, adolescent, adult) yielding 407 participants in the 6–12 years group, 415 in the 13–19 years group and 153 in the 20–27 years group.
Results
Scanner site
Datasets were completely matched for sex, age and diagnosis within each scanner site; there were thus no confounding effects between scanner site and the main variables (sex, diagnosis). Small to moderate sized differences between scanner sites were present regarding age [F (19, 839) = 31.57, p < 0.001, d = 0.39], FIQ [F (19, 832) = 3.38, p < 0.001, d = 0.13], sex (χ2 = 63.21, p < 0.001, d = 0.57) and handedness (χ2 = 88.43, p < 0.001, d = 0.69) of the participants. Of note, diagnosis did not differ between scanner sites such that patients were balanced with age, sex, and IQ-matched controls across sites (see online Supplementary Figs S2–S4).
Main effects
Table 1 shows the data (mean, s.d.) of total GM and WM volume as well as of the right and left volumes of the hippocampus, caudate nucleus, putamen, amygdala, thalamus, globus pallidus, and nucleus accumbens, broken down by group (ASD v. controls). Table 2 summarizes the main results of the mixed linear models. There were no main effects of diagnosis on GM and WM, nor were there main effects of diagnosis on the subcortical structures except for the nucleus accumbens, with smaller nucleus accumbens volume in ASD (Table 2). The ASD main effect on the nucleus accumbens remained significant with total brain volume as covariate [F (1, 843.6) = 5.75, p = 0.017, d = 0.17], but this ASD effect was lost when FIQ was included as a covariate [F (1, 844.5) = 0.78, p = 0.38, d = 0.06].
Table 1. Mean brain volumes (mm3) and standard deviations for ASD cases and controls

Table 2. Summary of linear mixed model results
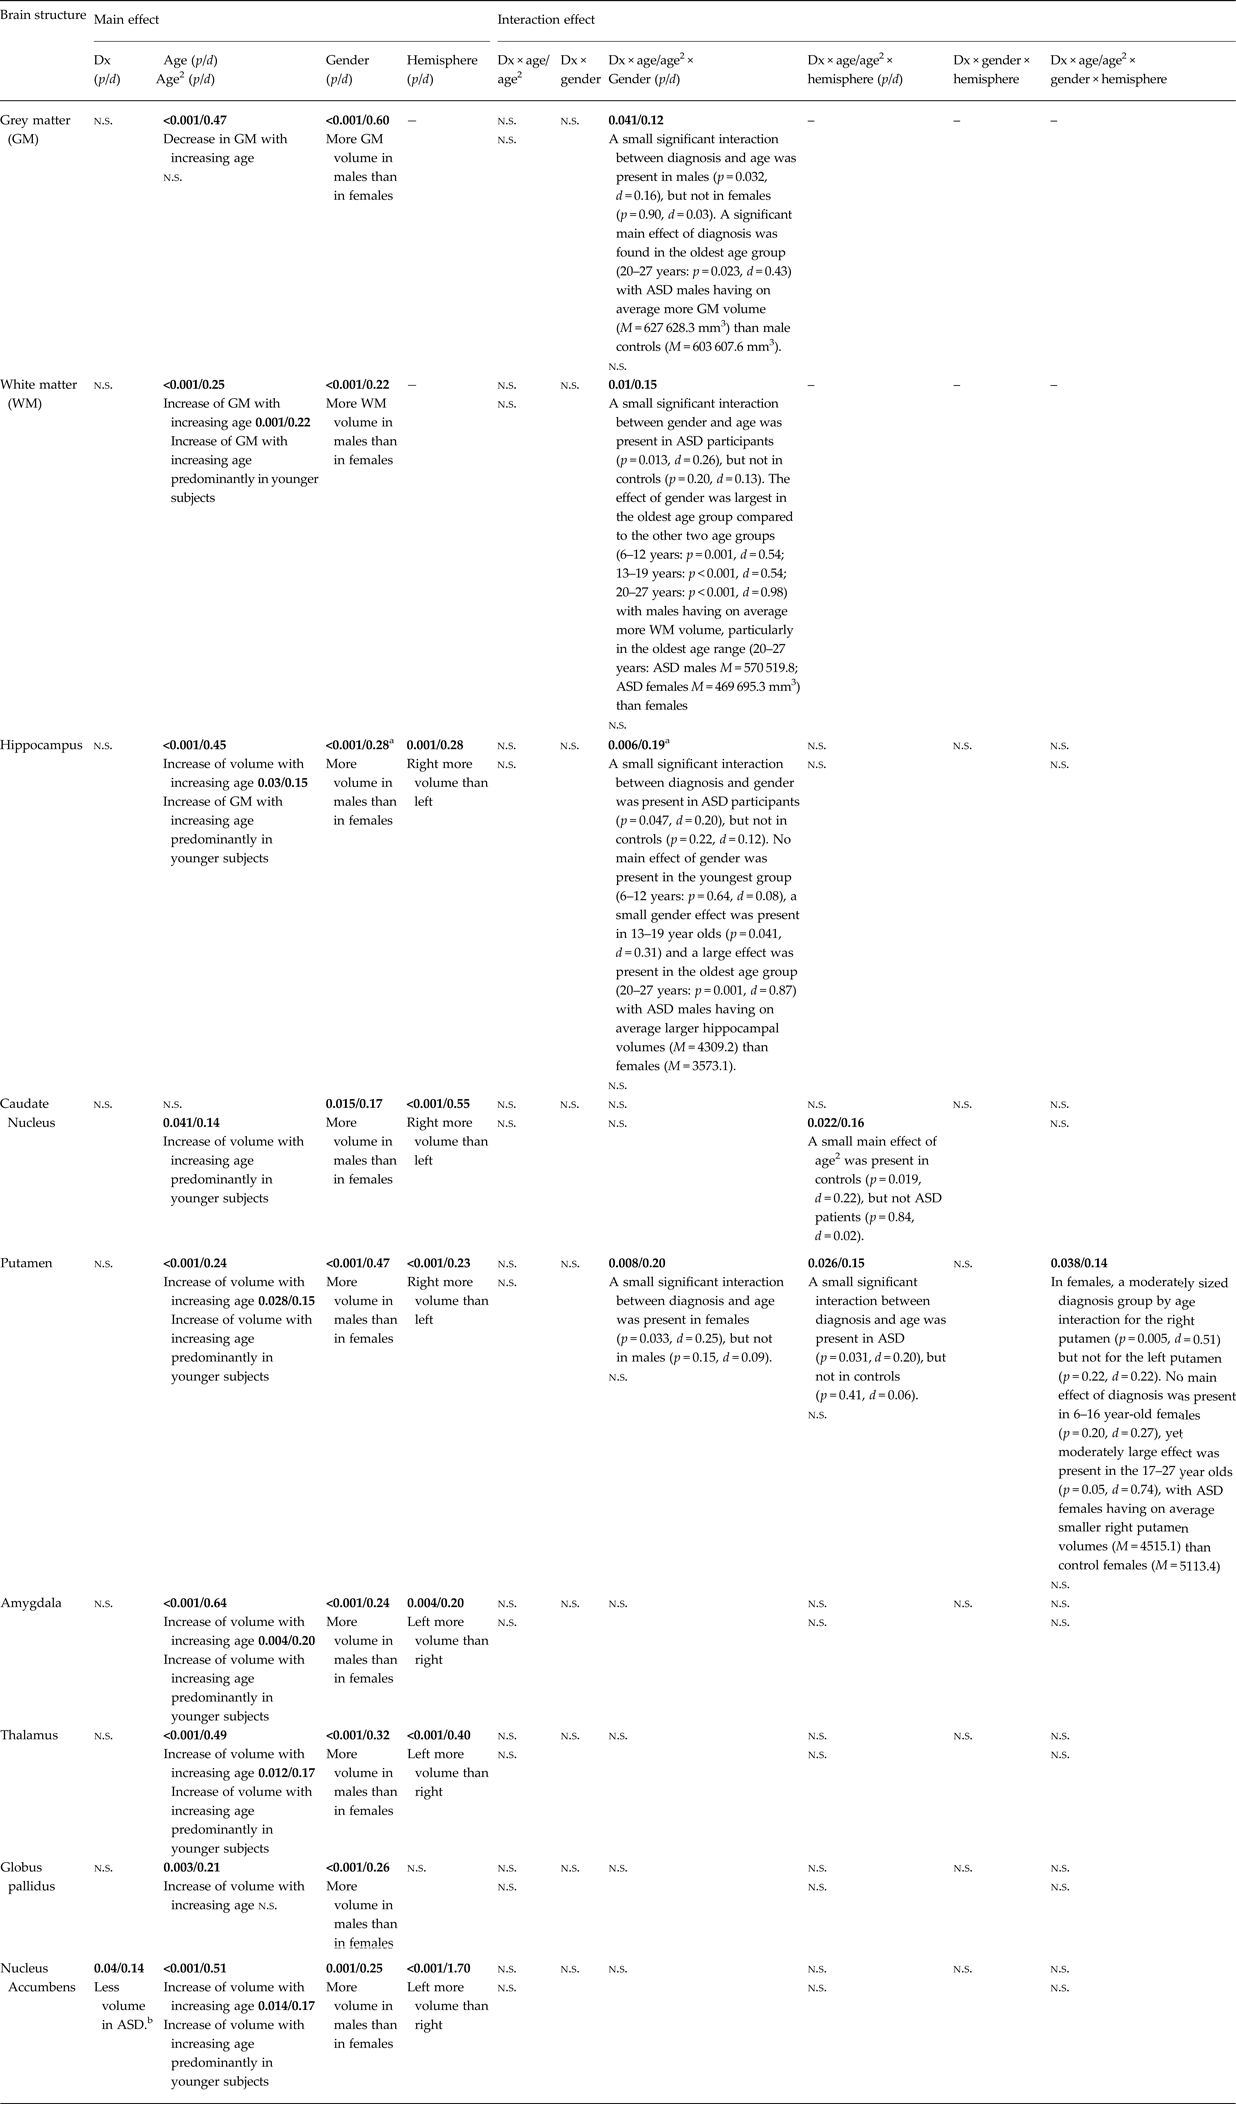
Dx, diagnostic group (ASD or control group); d, Cohen's d; n.s., p-values above 0.05 are not significant.
The exact p-values (and effect size d) are presented in the table (significance in bold).
a Findings became non-significant when covaried for the total brain volume.
b The effect disappeared when covaried for FIQ.
We further detected a significant main effect of age on total GM (decreasing) and WM (increasing) and on all subcortical structures except the caudate nucleus with small to moderate effect sizes. We also found a significant main effect of age2 (quadratic effect of age) on all subcortical structures except globus pallidus, as well as on total WM with small to moderate effect sizes. There was also a significant main effect of sex with males showing greater volumes than females in all structures. The main effect of hemisphere (i.e. a volume difference between the left and right structures) reached significance for all volumes (hippocampus L < R, caudate nucleus L < R, putamen L < R, amygdala R < L, R < L, nucleus accumbens R < L), except for the globus pallidus (see Table 2).
Interaction effects
For total GM, we found a three-way interaction of diagnosis by age by sex (Table 2): the decrease in volume over age was greater in male controls than in males with ASD (Fig. 2). When we stratified the male cohort into three age groups (child: 6–12 years, adolescent: 13–19 years, adult: 20–27 years), we found only a significant main effect of diagnosis in the oldest age group [20–27 years: F (1, 111.5) = 5.29, p = 0.023, d = 0.43], with males with ASD showing larger GM volume (M = 627 628.3 mm3) than male controls (M = 603 607.6 mm3) (see Fig. 2).

Fig. 2. Interaction between diagnosis (ASD v. control), age, and gender in the prediction of grey matter volume. The left panel shows all cases (male controls and male ASD) from age 6 to 27. The two regression lines illustrate that the decrease in GM volume is larger in male controls than in males with autism. The right panel shows all adult male cases (20–27 years; controls and ASD) and thus shows a subset of the cases in the left panel to illustrate that adult males with autism have more GM volume than adult controls.
For total WM, there was also a significant three-way interaction of diagnosis by age by sex (Table 2) with the difference in volume between males and females increasing with age in ASD but not in controls (Fig. 2). When the ASD cohort was stratified into three age groups (6–12 years, 13–19 years, 20–27 years), the effect of sex was largest in the oldest age group compared with the other two age groups [6–12 years: F (1, 161.0) = 11.76, p = 0.001, d = 0.54; 13–19 years: F (1, 170.1) = 12.63, p < 0.001, d = 0.54; 20–27 years: F (1, 55.7) = 13.70, p < 0.001, d = 0.98] with ASD males having on average more WM volume than ASD females, particularly in the oldest age range (20–27 years: ASD males M = 570 519.8; ASD females M = 469 695.3 mm3) (Fig. 3).

Fig. 3. Interaction between diagnosis (ASD v. control), age and gender in the prediction of WM volume. The WM volume is larger men with ASD than women with ASD, but not larger in control men compared with control women. The ASD males have on average more WM volume, particularly in the oldest age range (20–27 years).
For hippocampal volumes, a small three-way interaction of diagnosis by age by sex was present (Table 2). Post hoc analyses revealed that male adolescents and adults with ASD had larger hippocampi than females with ASD [F (1, 62.0) = 11.60, p = 0.001, d = 0.87]. See Fig. 4. Findings remained identical when covaried for FIQ, but became non-significant when covaried for total brain volume.

Fig. 4. Interaction between diagnosis (ASD v. control), age and gender in the prediction of hippocampal volume. Male adolescents and adults with ASD have larger hippocampi than females with ASD.
For caudate volumes, a significant three-way interaction between diagnosis, age2 and left-right hemisphere emerged (Table 2). Post hoc analyses revealed that the right caudate size increases with age in ASD [F (1, 455.1) = 5.53, p = 0.019, d = 0.22], whereas in controls right caudate size did not increase with age [F (1, 400.8) = 0.04, p = 0.84, d = 0.02]. Thus, a quadratic effect of age was found on caudate volume only for participants with ASD but not for controls (Fig. 5). This effect remained significant when covaried for total brain volume and FIQ.

Fig. 5. Interaction between diagnosis (ASD v. control), age2 and hemisphere in the prediction of caudate nucleus volume. A small main effect of age2 was present on right caudate volume in controls, but not ASD patients.
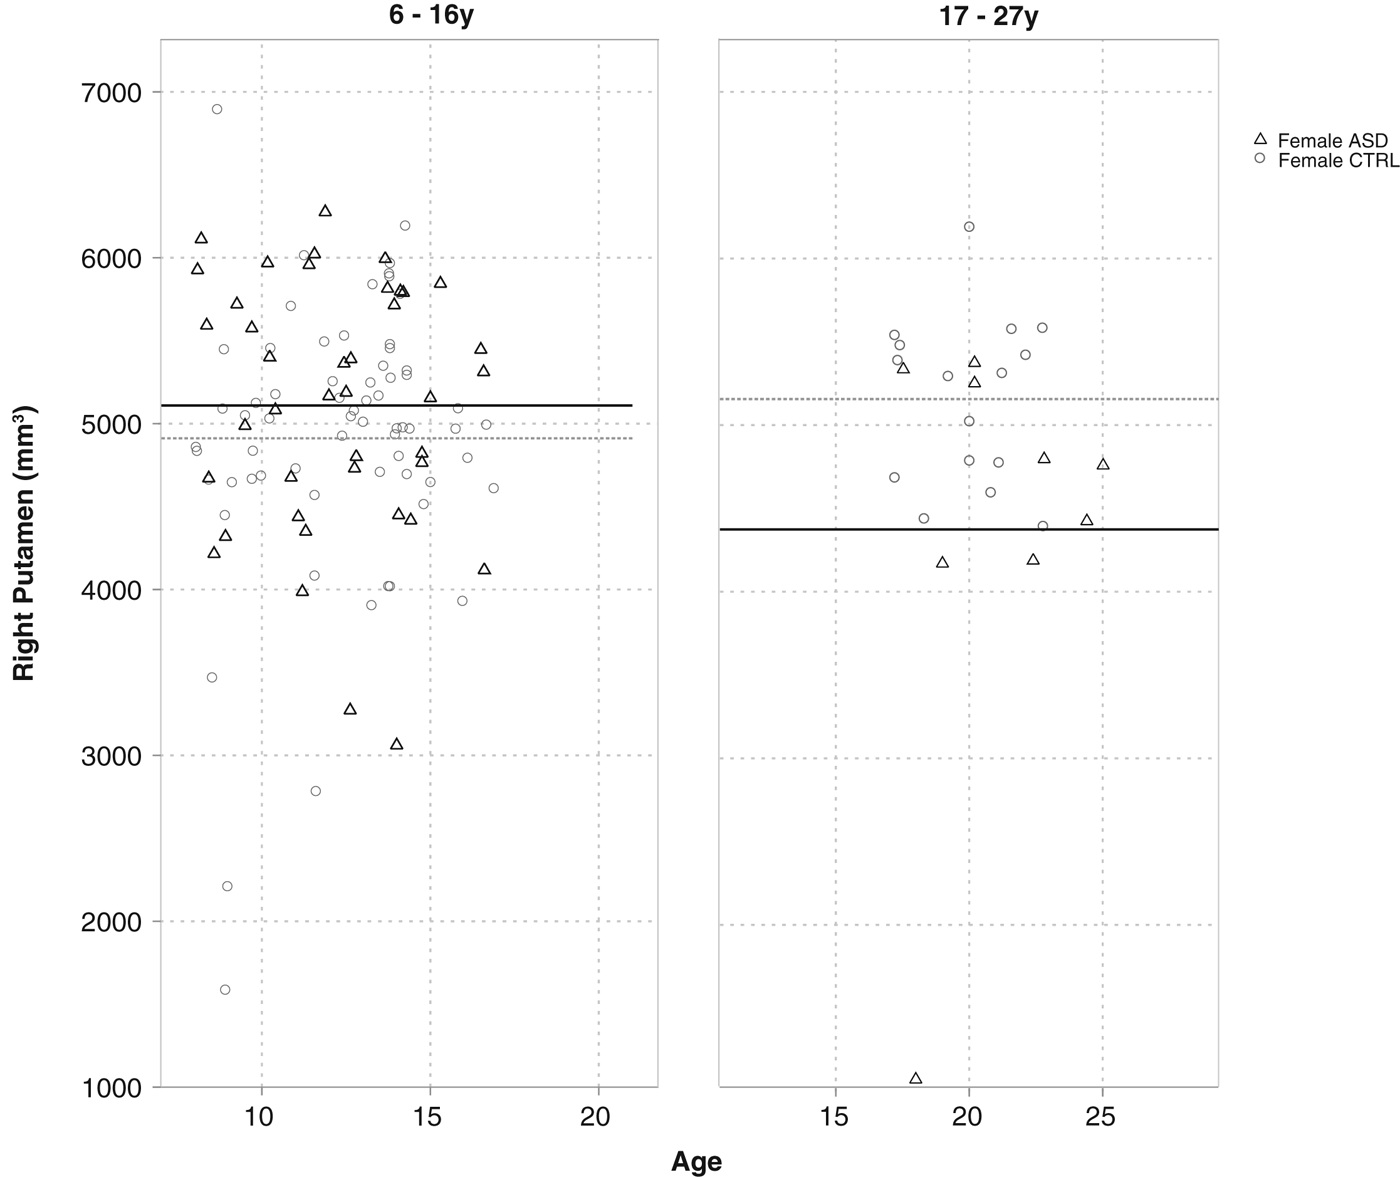
For putamen volumes, a small significant four-way interaction was present between diagnosis, age, sex, and left–right hemisphere (Table 2). Post hoc analyses revealed that only young adult females (17–27 years) with ASD had smaller right putamen volumes (M = 4515.1) than young adult female controls (M = 5113.4) [F (1, 30.3) = 4.12, p = 0.05, d = 0.74] (Fig. 6). Findings remained unchanged when covaried for total brain volume or FIQ.

Fig. 6. Interaction between diagnosis (ASD v. control), age, hemisphere and gender in the prediction of putamen volume. No main effect of diagnosis was present in 6–16-year-old females, yet a moderately large effect was present in the 17–27-year olds, with ASD females having on average smaller right putamen volumes than control females.
Discussion
To facilitate future attempts to use MRI markers for stratification of ASD, this study set out to examine the main and combined effects of age and sex on cortical and subcortical GM volumes in N = 859 subjects (6–27 years, IQ 70–130) with and without ASD from the ABIDE dataset (Di Martino et al. Reference Di Martino, Yan, Li, Denio, Castellanos, Alaerts, Anderson, Assaf, Bookheimer, Dapretto, Deen, Delmonte, Dinstein, Ertl-Wagner, Fair, Gallagher, Kennedy, Keown, Keysers, Lainhart, Lord, Luna, Menon, Minshew, Monk, Mueller, Müller, Nebel, Nigg, O'Hearn, Pelphrey, Peltier, Rudie, Sunaert, Thioux, Tyszka, Uddin, Verhoeven, Wenderoth, Wiggins, Mostofsky and Milham2014). Despite a relatively lenient alpha level, we found virtually no main effects of ASD on any of the volumes. This is in striking contrast with the positive findings from previous studies (McAlonan et al. Reference McAlonan, Cheung, Cheung, Suckling, Lam, Tai, Yip, Murphy and Chua2005; Waiter et al. Reference Waiter, Williams, Murray, Gilchrist, Perrett and Whiten2005; Hadjikhani et al. Reference Hadjikhani, Joseph, Synder and Tager-Flusberg2006; Hyde et al. Reference Hyde, Samson, Evans and Mottron2010; Toal et al. Reference Toal, Daly, Page, Deeley, Hallahan, Bloemen, Cutter, Brammer, Curran, Robertson, Murphy, Murphy and Murphy2010; Via et al. Reference Via, Radua, Cardoner, Happé and Mataix-Cols2011; Ecker et al. Reference Ecker, Suckling, Deoni, Lombardo, Bullmore, Baron-Cohen, Catani, Jezzard, Barnes, Bailey, Williams and Murphy2012; Greimel et al. Reference Greimel, Nehrkorn, Schulte-Ruther, Fink, Nickl-Jockschat, Herpertz-Dahlmann, Konard and Eickhoff2012) and even with several meta-analyses (Duerden et al. Reference Duerden, Mak-Fan, Taylor and Roberts2012; Nickl-Jockschat et al. Reference Nickl-Jockschat, Habel, Michel, Manning, Laird, Fox, Schneider and Eickhoff2012; Yang et al. Reference Yang, Beam, Pelphrey, Abdullahi and Jou2016a , Reference Yang, Si, Gong, Qiu, Jia, Zhou, Zhao, Hu, Wu and Zhu b ). Only one small main effect of ASD diagnosis was found on the nucleus accumbens volume (being smaller in ASD compared with controls) that appeared related to full scale IQ (FSIQ) differences between the groups, since it became non-significant after correcting for FSIQ. In contrast, several diagnosis-by-age-by-sex effects were found. Male adults with ASD had more GM and WM than controls, whereas no differences for GM and WM were found for male children and adolescents with ASD, and for females with ASD. Similarly, adolescent and adult men with ASD had larger hippocampal volumes than controls, but there were no differences in male children with ASD and females with ASD. Caudate nucleus volume increased with age in controls but not in ASD, and female adolescents and adults with ASD had smaller right putamen volume than female controls, while there were no differences in men with ASD. The current findings strongly underline the sex-specific and neurodevelopmental nature of ASD (Chen et al. Reference Chen, Keown, Jahedi, Nair, Pflieger, Bailey and Müller2015a , Reference Chen, Kelly, Castellanos, He, Zuo and Reiss b ; Lai et al. Reference Lai, Baron-Cohen and Buxbaum2015a , Reference Lai, Lombardo, Auyeung, Chakrabarti and Baron-Cohen b ; Wolfers et al. Reference Wolfers, Buitelaar, Beckmann, Franke and Marquand2015), and suggest that MRI-based stratification of ASD will need to take account of age and sex and their interactive effects as well as should use substantially larger datasets than have been currently used for such attempts.
Potential explanations for these age and sex moderating effects in neuroanatomy correlates of ASD may be age- and sex-specific abnormalities in gene expression. The expression of neuropathologic markers such as brain protein, or synaptic, minicolumn or neuron count in the brain may vary throughout development in ASD (Courchesne et al. Reference Courchesne, Campbell and Solso2011; Ramsey et al. Reference Ramsey, Guest, Broek, Glennon, Rommelse, Franke, Rahmoune, Buitelaar and Bahn2013). Ramsey et al. (Reference Ramsey, Guest, Broek, Glennon, Rommelse, Franke, Rahmoune, Buitelaar and Bahn2013), for example, performed a multiplex immunoassay profiling analysis and found age-dependent differences in proteins involved in inflammation, growth, and hormonal signaling. The opportunity to intervene behaviorally or pharmaceutically could be age and sex specific as well: hypothetically, abnormal pruning/apoptosis or neuroinflammatory mechanisms thought to underlie neuropathological processes in ASD (Huh et al. Reference Huh, Boulanger, Du, Riquelme, Brotz and Shatz2000; Schultz & Klin, Reference Schultz and Klin2002; Frith, Reference Frith, Bock and Goode2003; Vargas et al. Reference Vargas, Nascimbene, Krishnan, Zimmerman and Pardo2005; Theoharides et al. Reference Theoharides, Kempuraj and Redwood2009) may be addressed during a specific window of opportunity.
With respect to several potentially meaningful interaction effects, two prominent sex-specific findings in the current study were that adult males with ASD showed larger GM and WM volume than controls, while females with ASD did not. Since total GM and WM volume differences may well reflect the consequences of large-scale neurobiological mechanisms, such a disparity suggests that there may be different etiological mechanisms at play in males and females with ASD as proposed by the extreme male brain theory. Thus, in men, larger brains in ASD may perhaps arise from differences in sensitivity to prenatal androgens (Baron-Cohen et al. Reference Baron-Cohen, Knickmeyer and Belmonte2005; Lai et al. Reference Lai, Lombardo, Suckling, Ruigrok, Chakrabarti, Ecker, Deoni, Craig, Murphy, Bullmore and Baron-Cohen2013), while in women with ASD, another mechanism may lead to the onset of ASD (Lai et al. Reference Lai, Baron-Cohen and Buxbaum2015a , Reference Lai, Lombardo, Auyeung, Chakrabarti and Baron-Cohen b ).
An additional finding of interest was that the absolute hippocampus size differed between male (but not female) adolescents/adults with ASD and controls, whereas absolute amygdala, thalamus, and globus pallidus size did not. Abnormal hippocampal volume may contribute to the etiology of ASD since the hippocampus plays an important role in emotion perception (Phillips et al. Reference Phillips, Drevets, Rauch and Lane2003a , Reference Phillips, Drevets, Rauch and Lane b ). That is, the hippocampus contributes to contextually appropriate behavior as it can regulate affective behavior elicited by emotionally salient stimuli through its inhibitory connections with the amygdala. Abnormalities of the hippocampus may thus result in impaired affective behavior and emotional regulation of ASD (Groen et al. Reference Groen, Teluij, Buitelaar and Tendolkar2010). The current findings suggest that abnormal hippocampal growth may contribute to the etiology of ASD only in a specific developmental period in males but not in females, underlining age and sex specificity.
Strengths of the current study include the large sample size, uniform segmentation approach and stratified statistical analysis that corrected for center influences. Limitations are that despite the pooling of data across sites, females were underrepresented. Furthermore, no children below the age of 6 were included, limiting any examination of the developing brain before the onset of the full disorder. The current study may therefore reflect the end result or late developmental consequences of the pathology of ASD rather than the etiological changes taking place during the onset of ASD pathology. Another limitation of the current study may be the use of the automated FIRST algorithm (Patenaude et al. Reference Patenaude, Smith, Kennedy and Jenkinson2011) since some researchers consider the expert hand segmentation as the gold standard for subcortical segmentation (Zhang et al. Reference Zhang, Brady and Smith2001). However, FIRST results are robust, reliable and comparable with manual segmentation (Morey et al. Reference Morey, Petty, Xu, Hayes, Wagner, Lewis, LaBar, Styner and McCarthy2009) and the use of this method cannot explain the absence of main effects of ASD diagnosis and presence of diagnosis by age-by-sex interaction effects.
In conclusion, despite the large sample size, we found virtually no main effects of ASD diagnosis yet several significant two- and three-way interaction effects of diagnosis by age-by-sex were found. This indicates that ‘the’ neuroanatomy of ASD does not exist. Rather, the findings underline that MRI correlates of the disorder are highly age and sex dependent. This implies that any future attempts to develop MRI diagnostic classification algorithms and MRI-based stratification of ASD into biologically more homogenous subtypes need to take into account age, sex, and their interaction, and require substantially larger datasets than have been currently used for such attempts.
Supplementary material
The supplementary material for this article can be found at https://doi.org/10.1017/S003329171700201X
Acknowledgements
The study was supported by Hersenstichting Fellowship (F2010(1)-13) to WG. JB is supported by the Innovative Medicines Initiative Joint Undertaking under grant agreement number 115300, resources of which are composed of financial contributions from the European Union's Seventh Framework Programme (FP7/2007–2013) and the European Federation of Pharmaceutical Industries and Associations (EFPIA) companies.