INTRODUCTION
Soil respiration is a critical process of ecosystem and critical zone metabolism (Richter and Billings Reference Richter and Billings2015) and is key to estimating carbon exchange between the soil and atmosphere. It is therefore a critical factor in regulation of the global carbon cycle (Bloom et al. Reference Bloom, Exbrayat, van der Velde, Feng and Williams2016). The CO2 flux from soil can account for more than 2/3 of total ecosystem respiration (Kuzyakov Reference Kyzyakov2006). We are challenged to understand the processes involved in soil respiration, examine how these processes respond to environmental changes, and learn their spatial and temporal variability (Yiqi and Zhou Reference Luo and Zhou2006). In many studies CO2 flux from the soil to the atmosphere is estimated by eddy covariance techniques or with chamber methods with measures of bulk concentrations and isotope composition. The other way to investigate soil respiration was incubation laboratory studies with the labeled 13C and 14C materials. However these studies have shown the temporal variation and are highly dependent on soil moisture and biological activity (Kuzyakov and Larionova Reference Kuzyakov and Larionova2005; Studer et al. 2014). There are very few studies that estimate within the soil profile, the stable carbon and oxygen isotopes of CO2 along with its radiocarbon concentrations and the stable 18O of free O2. The objective of this study was to evaluate depth-dependent effects of land uses on differences of isotopic composition of CO2 and O2 of soil air at depths from 0 to 5 m.
Soil respiration has two main sources: decomposition of soil organic matter (SOM) by microorganisms or heterotrophic respiration and autotrophic respiration from live plant roots and associated microbes. Land use and its history through its influence on vegetation and the different depths of root penetration affect the relations between autotropic and heterotrophic respiration (Ding et al. Reference Dung, Shen, Wang, Yi, Ding, Fu, Liu and Zhou2010).
There are numerous approaches to partitioning CO2 efflux from soils (Kuzyakov and Larionova Reference Kuzyakov and Larionova2005) and each has limitations and a method able to partition soil respiration in situ remains elusive. It has always been a problem to separate and measure each of components of soil respiration.
The most common method of measuring soil respiration is a chamber over the soil and the determination of the change of CO2 concentration in the chamber headspace over time. Eddy covariance methods can estimate net ecosystem carbon exchange, which is the difference between photosynthesis and respiration by the entire ecosystem, however, this technique does not typically allow the separation of soil respiration from aboveground respiration.
According to Hall and Silver (Reference Hall and Silver2013) humid tropical forests have the fastest rates of organic matter decomposition globally, which often coincide with fluctuating oxygen availability in surface soils. Microbial iron reduction generates reduced iron [Fe(II)] under anaerobic conditions, which oxidizes to Fe(III) under subsequent aerobic conditions. They demonstrate that Fe (II) oxidation stimulates organic matter decomposition via two mechanisms: (i) organic matter oxidation, likely driven by reactive oxygen species; and (ii) increased dissolved organic carbon availability, likely driven by acidification. The similar processes occur in the wet subtropical forest of Calhoun CZO, only with the less rates.
The presence of large 14C gradients in soil makes it a sensitive tool for detecting changes in respiration sources. Deep soil horizons generally contain an abundance of organic matter that is depleted in 14C due to their older age, while near surface horizons reflect litter additions containing “bomb carbon,” a legacy of atmospheric nuclear test in the early 1960s (Gaudinski et al. Reference Gaudinski, Trumbore, Davidson and Zheng2000; Phillips et al. Reference Phillips, McFarlane, Risk and Desai2013).
Nuclear testing in atmosphere produced a huge amount of 14C which increased the concentration of this isotope in the atmosphere by almost two-fold compared to the level before the tests began (Figure 1). Since the maximum peak in 1962–1964, the concentration of 14C in atmosphere has rapidly decreased due to the ban on atmospheric testing and the incorporation of 14C in CO2 into the world’s biomass and organic matter including that in soils. As a result, we have a human-made global marker, which can be applied for the study of SOM turnover rates examining the sources and dynamics of soil respiration (Amundson et al. Reference Amundson, Stern, Baiseden and Wang1998; De Camargo et al. Reference De Camargo, Trumbore, Martinelli, Davidson, Nepstad and Victoria1999; Richter et al. Reference Richter, Markewitz, Trumbore and Wells1999; Koarashi et al. Reference Koarashi, Hockaday, Masiello and Trumbore2012).
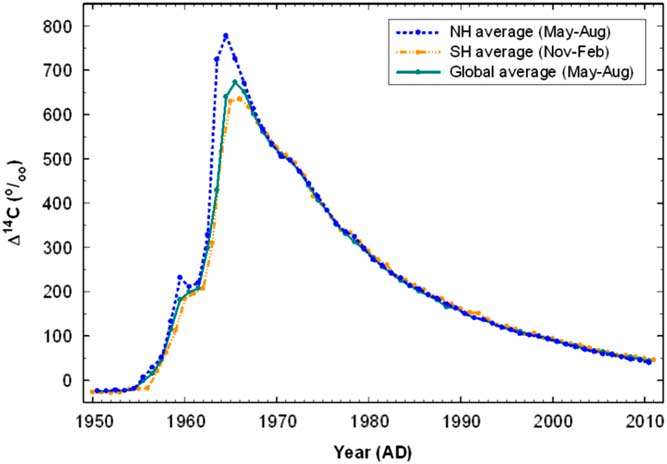
Figure 1 Compiled summer hemispheric and global 14C curves (Hua et al. Reference Hua, Barbetti and Rakowski2013).
Several researchers (Dörr and Münnich Reference Dorr and Minnich1986; Gaudinski et al. Reference Gaudinski, Trumbore, Davidson and Zheng2000; Koarashi et al. Reference Koarashi, Iida, Moriizumi and Agano2004; Hahn et al. Reference Hahn, Hogberg and Buchhmann2006) have used closed chamber techniques and AMS radiocarbon analysis to determine that a significant portion of soil respiration is derived from the decomposition of soil organic matter (SOM) enriched in14C from atmospheric nuclear tests, but with a notable lag from years to a few decades between atmospheric 14C addition and re-emission from soil. They also observed pronounced seasonal variations in 14C concentration of soil CO2. Root and microbial respiration have different 14C abundance, with root-derived CO2 more closely associated with values of the recent atmosphere. This distinction has been employed to partition soil respiration into heterotrophic (Rh) and autotrophic (Ra) components (Czimczik et al. Reference Czimczik, Trumbore, Carbone and Winston2006; Schuur and Trumbore Reference Shuur and Trumbore2006; Hick Pries et al. Reference Hicks Pries, Shuur and Crummer2013). The degree to which 14C reflects recently fixed C versus the C that was fixed in the past provides a potentially important tool for partitioning the sources of soil respiration—autotrophic plant respiration and/or heterotrophic microbial respiration.
MATERIALS AND METHODS
Research Site and Field Sampling
Soil studies were conducted in the U.S. Forest Service Calhoun Experimental Forest and Enoree District of the Sumter National Forest, South Carolina, USA. From the early 1800s to the middle of the 20th century, agricultural use for cotton, corn, hay, and pasture, reduced organic carbon in the upper 30 cm of Calhoun mineral soils by about 40% of the carbon present at this depth before cultivation (Richter et al. Reference Richter, Markewitz, Trumbore and Wells1999). Starting from the 1950s, a long-term Calhoun field experiment quantifies the recovery of soil carbon under reforestation following more than a century of cultivation (Mobley et al. Reference Mobley, Lajtha, Kramer, Bacon, Heine and Richter2015).
Three ecosystems were selected for study: a reference plot of hardwood, a cultivated plot and a secondary forest plot. The reference hardwood (mainly Quercus spp) stands are mainly of oak and hickory and are taken to be never cultivated and minimally affected by human use. The cultivated plots were periodically cultivated starting in the late 18th and early 19th centuries then have been in continuous cultivation for growing cotton prior to the 1930s but for the last 50–60 yr for growing corn, wheat, legume, sorghum, and sunflowers. Fertilizers and lime became part of cultivation practices starting in the late 19th century. Cultivation transitioned from horse and mule to tractors by the mid-20th century. Secondary forests are dominated by loblolly pine (Pinus taeda) and range from 60 to 80 yr in age. They were comparable in their cultivation history to the continuously cultivated sites prior to the first third of the 20th century. Soils in the cultivated fields and old-field pine stands are variously eroded by farming.
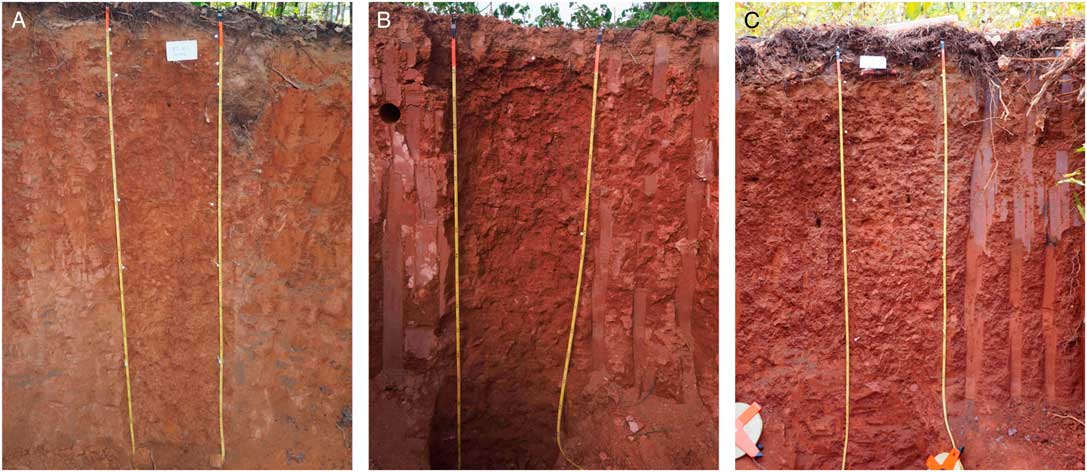
The soils sampled were all Ultisols with a humid subtropical climate and annual rainfall of about 1100 mm and annual temperature 15°C. Textures are sandy loams in surficial A and E horizons, and clays in Bt horizons that are largely of kaolinite clay mineralogy (Figure 2). In dormant seasons, as moisture storage refills, occasionally water can perch in the upper 1.5 m. A permanent water table is>5 m.

Figure 2 The profiles of the studied soils (approximately 2-m depth). A: hardwood site; B: cultivated site; C: pine site.
Field Sampling
Three replicates of each of the three ecosystems were sampled. Five-meter-deep holes were excavated with a 10-cm diameter hand auger. PVC soil-gas reservoirs (with 750 mL volume) were installed at 0.5 m, 1.5 m, 3 m, and 5 m (and 8.5 m for one of the pine sites) depths with two lines of gas-impermeable tubing running to the soil surface. The auger holes were then refilled and tightly repacked with soil material from appropriate horizons. After about one year, in the summer of 2016, the soil gas was sampled for this study and analyzed in the field for CO2 and O2 concentrations with gas samples collected in Tedlar bags for isotopic analysis in the laboratory. Generally, 0.5 m depth samples collect gas from the upper Bt horizons, 1.5 m samples from the middle to lower Bt and BC, or upper CB horizons, and 3 and 5 m deep samples from C horizons that is sandy loam, all derived perched water. A permanent water table is>5 m.
We have also collected at the same time a few different plant materials to estimate the atmospheric concentration of 14C in the region.
For the field measurements of the O2 concentration an Apogee MO200 oxygen meter was used with uncertainty according to Apogee ±0.1% vol. For the measurements of CO2 concentration a Vaisala GMM221 CO2 probe meter was used with uncertainty according to Viasala ±0.05% vol. and real observed uncertainty 0.15% vol.
Laboratory Analysis
The gas samples were analyzed in the Center for Applied Isotope Studies, University of Georgia, for Δ14C, δ13C and δ18O in soil carbon dioxide.
The carbon dioxide was cryogenically separated from soil gas and divided in two parts: about 10% of CO2 was collected for the stable isotope (δ13C and δ18O) analysis using dual inlet mass spectrometer MAT 253 and the remaining 90% of the gas were converted into graphite on iron catalyst by reaction with hydrogen at 580°C for 2.5 hr. The graphite targets were measured for Δ14C using AMS system Pelletron 0.5 mV 1.5DH-1 manufactured by National Electrostatic Corporation. Detailed description of sample preparation and measurements are given in Cherkinsky et al. (Reference Cherkinsky, Culp, Dvoracek and Noakes2010).
The isotope signatures were calculated using the general equation 1 of ratio between the CO2 in soil, 13Cs/12Cs, and V-PDB standard, 13Cstd/12Cstd, and presented in ‰ with the typical uncertainty less than 0.1‰.
 $$\delta {}_{{}}^{{13}} C{\equals}\left( {{{{{{}_{{}}^{{13}} C_{s} } \over {{}_{{}}^{{12}} C_{s} }}{\minus}{\rm }{{{}_{{}}^{{13}} C_{{std}} } \over {{}_{{}}^{{12}} C_{{std}} }}} \over {{{{}_{{}}^{{13}} C_{{std}} } \over {{}_{{}}^{{12}} C_{{std}} }}}}{\rm }} \right){\times}{\rm }1000$$
The radiocarbon concentration (Δ14C) is also presented in ‰ using the value of fraction modern (F14C) of the sample (Stuiver and Polach Reference Stuiver and Polach1977; Reimer et al. Reference Reimer, Brown and Reimer2004; Egan et al. Reference Egan, Nickerson, Phillips and Risk2014):
 $$Δ ^{{14}} {\rm C}{\equals}\left( {{\rm F}^{{14}} {\rm C}-1} \right){\times}1000$$
We have calculated F14C using 14C/13C ratio rather than using 14C/12C, so this ratio is more stable and less dependent on the stable isotope currents and transmission of the AMS system (Cherkinsky et al. Reference Cherkinsky, Culp, Dvoracek and Noakes2010) The F14C for this ratio could be described by the following formula (Reimer et al. Reference Reimer, Brown and Reimer2004):
 $${\rm F}^{{{\rm 14}}} {\rm C{\equals}}\left( {{\rm R}_{{\rm s}} {\rm \,/\,0}{\rm .95 R}_{{{\rm ox}}} } \right){\rm {\times}}\left( {{\rm 0}{\rm .975\,/\,0}{\rm .981}} \right)^{{\rm 2}} {\rm {\times}}\left( {{\rm 1{\plus}δ}^{{{\rm 13}}} {\rm C}_{{{\rm ox}}} {\rm \,/\,1000}} \right){\rm \,/\,}\left( {{\rm 1{\plus} δ }^{{{\rm 13}}} {\rm C}_{{\rm s}} {\rm \,/\,1000}} \right)$$
Where Rs is the 14C/13C isotope ratio for the sample and Rox is the 14C/13C isotope ratio for the OXI standard (National Bureau of Standards NBS RM 49).
The oxygen was analyzed at the Duke University Environmental Stable Isotope Lab for δ18O in O2. Measurements of sample δ8O–O2 were performed on gases contained at roughly atmospheric pressure in 11mL Labco (Lampeter, Wales, UK) Exetainer vials, using a ThermoFinnigan (Bremen, Germany) GasBench II equipped with CombiPal autosampler and feeding by continuous flow to a ThermoFinnigan Delta+XL IRMS, tuned to O2 isotopic linearity. Helium carrier flow rate during analyses was approximately 0.5 mL/min. Each sample analysis consisted of 8 injections from the GasBench 100 mL sample loop, with raw mean values and standard deviation reported for each set of sample injections. All sample and standard raw values were determined versus ultra high purity (UHP) O2 reference gas pulses, with reference gas arbitrarily set to =0‰ SMOW. The standard deviation of 16 consecutive reference gas pulses prior to sample analyses was 0.031‰ SMOW. Raw mean sample delta values were then normalized to two O2 gas standards with known values: Messer 3 with δ18O = +12.5‰ SMOW and LGGE 2 with δ18O=–38.0‰ SMOW. Standard known values are accurate to approximately ±0.2‰ (Dr. J.D. Karr, Duke University, personal communication.). Samples required approximately 10-fold dilution before analyses, accomplished by injecting 1 mL of sample gas by gas-tight syringe into Exetainers were previously flushed for 20 min each at approximately 30 mL/min with UHP helium.
RESULTS AND DISCUSSION
Soil gas oxygen and carbon dioxide concentrations and their isotopic composition are presented in Table 1 as statistical averages of three soils in each of three ecosystems of the hardwood forests, cultivated fields, and pine forests, except for the 8.5 m depth in a pine site where we have but a single soil. Each single measurement has a standard deviation 0.1–0.2‰ for stable carbon and oxygen isotopes and 2–3‰ for radiocarbon (∆14C). The detailed data for each core are presented in the supplemental table.
Table 1 The concentration of CO2, O2, and isotopic composition of the soil gases. All values are the weighted averages of three plot replications, except the depth 8.5 m marked with *, where there was only a single measurement in one soil. #Isotopic composition of free oxygen in soil gas was measured only in the single cores for each land use without replicates. The standard deviation for these measurements is about 0.2‰.

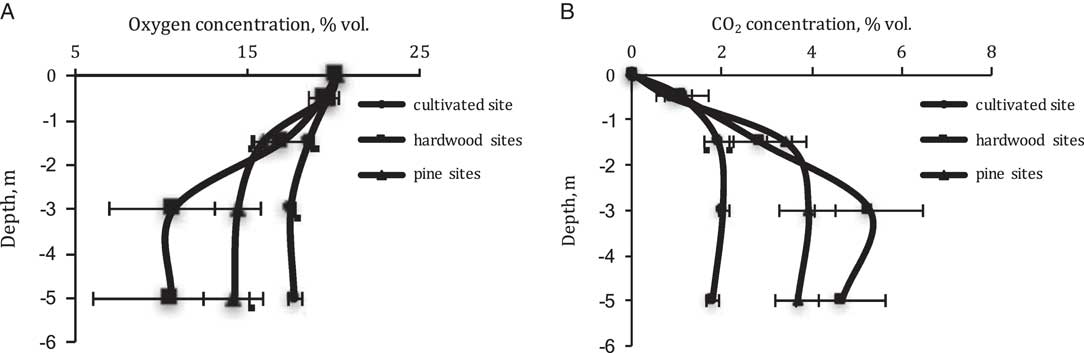
The concentration of CO2 increases greatly with depth in soils of all three land uses, but especially under forests where it appears to reach a maximum concentration at 3 m depth with a decrease of 10–15% vol. at 5 m depth compared to concentrations at 3 m. However, the ranges of CO2 concentrations are markedly different in the different land uses. In the case of cultivated soils the concentration varies from only 1.1% vol.to maximum 2.0% vol., whereas under pines CO2 increases from 0.9% to 4.0%vol. and under hardwoods, CO2 ranges from 1.1% to 5.3% vol. (Figure 3A).

Figure 3 Concentration of (A) oxygen and (B) carbon dioxide in Ultisol profiles with the different land use.
The concentration of oxygen in soil gas has a generally reciprocal distribution compared with CO2 (Figure 3B). Relatively small changes are observed in the cultivated Ultisol from 19.8% to 17.6% vol., at 0.5 and 5 m, but relatively large changes are observed under hardwood from 19.5% to 10.7% vol. at the two depths. Soil oxygen under pines has an intermediate concentration. In the cultivated soils, the penetration of crop roots by corn, wheat, sunflower, legume, and sorghum is significantly shallower than in the soils under forest where roots are observed at depths greater than 5 m. Billings et al. (Reference Billings, Hirmas, Sullivan, Lehmeier, Bagchi, Min, Brecheisen, Hauser, Stair, Flournoy and Richter2018) has estimated that the densities of roots is higher at depth under these hardwood forests than under these pines.
The δ13C of CO2 with cultivated soils averaged –17.8‰, which we attribute to a legacy of organic matter from C4 crops such as corn and sorghum. Depth effects are also apparent across all three land uses: in the cultivated sites δ13C decreases from –17.8‰ at 0.5 m to –20.9‰ at 5 m; and under pines from –22.3‰ to –24.7‰ and hardwoods from –21.5 to –24.5‰. Interestingly, despite this depth dependence of δ13C in CO2, the δ18O in CO2 changes little with depth in any land use (Figure 4A).
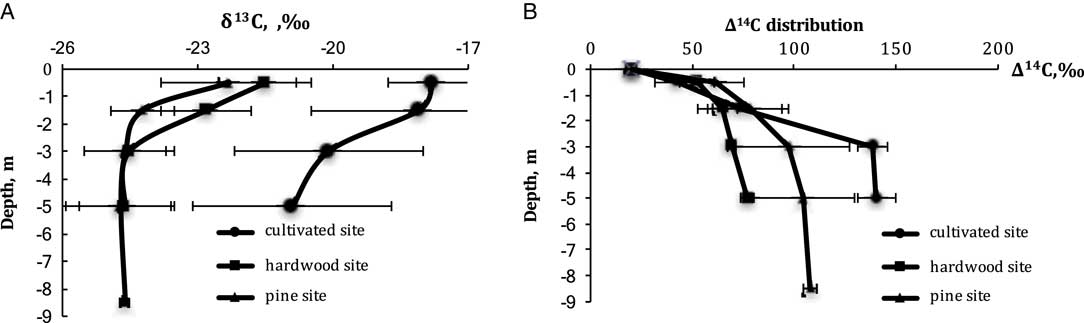
Figure 4 Distribution of (A) δ13C and (B) ∆14C in soil CO2 in the Ultisol profiles with the different land uses.
The δ18O of soil O2 was hardly altered under cultivated crops, averaging between 3.5 and 4.1, but was greatly enriched at depth under forests with elevated CO2 due to strong discrimination of 18O–O2 by root respiration (Angert et al Reference Angert, Luz and Yakir2001; Angert and Luz Reference Angert and Luz2001). It is very interesting that the resulting 18O from CO2 in soil air is so consistent (27–29‰) with depth following this respiration process across depths and land uses.
In hardwood soils, the δ18O isotopic data from soil O2 ranged from 4.3 to 18.5‰ from 0.5 m to 5 m indicating strong enrichment of δ18O relative to free air atmospheric O2. The δ18O of O2 in the atmosphere depends on latitude and varies from about 0 to 5‰ (Luz and Barkan Reference Luz and Barkan2011; Francey and Tans Reference Francey and Tans1987). We attribute this enrichment with depth to aerobic root and microbial respiration that strongly fractionates soil O2 increasing the soil atmosphere in δ18O by 10–26‰ under the three hardwood forests.
The radiocarbon analyses in soil CO2 profile demonstrated strong depth-dependent increases in the 14C of CO2 with Δ14C increasing from 40 to 60‰ at 0.5 m to about 80–140‰ at 5 m depth. The atmospheric value measured in crop plant biomass growing in 2016 averaged 19.7±1.8‰, based on measurements of sunflower, legume and sorghum samples. Land-use effects were pronounced as well, but mainly at 3 and 5-m depths. In fact, the three ecosystems were remarkably similar in their ∆14C in soil CO2 in the upper 1.5 m and remarkably different at 3 and 5 m. The hardwood forests had by far the lowest ∆14C in CO2 at depth, ranging from 69 to 77‰. The Δ14C in cultivated soil changes from 42±11‰ at the 0.5 m depth to 140±9‰ at 5 m depth. We attribute this wide range of 14C concentration in CO2 to the relatively shallow root penetration of agricultural vegetation, which was mostly limited to a depth of about 0.5 m (Figure 5B). Pines are intermediate in ∆14C of CO2, whereas the ∆14C in CO2 hardwood forests indicates that these ecosystems are cycling their soil CO2 most rapidly.
The forest soils in both hardwood and pine sites in the upper half meter have similar 14C composition in the range even 1 standard deviation (they vary from 42‰ in cultivated soil to 61‰ in pine site, whereas one standard deviation ranges from 8 to 14‰ for the upper 0.5 m). However, the hardwood soil has the lowest Δ14C values compared to cultivated and pine soils. This value increases with depth from 52 to 77‰. In the pine soil, it increases from 61 to 108‰. These data are quite different from Trumbore’s data (Reference Trumbore2000) for the tropical and temperate forest soil CO2, which appear to demonstrate no changes in Δ14C values with depth.
Being a chronosequence experimental design, we attribute these results to be a function of root penetration and respiration in the soil, whereby reference hardwood forests have the deepest and most extensive rooting networks across depths in these soil profiles (Billings et al. Reference Billings, Hirmas, Sullivan, Lehmeier, Bagchi, Min, Brecheisen, Hauser, Stair, Flournoy and Richter2018). Thus, the CO2 in the hardwood soils is most enriched with contemporary atmospheric CO2 as we observe the smallest differences with current atmospheric Δ14C values (about 20‰). The excess of 14C concentration allows us to estimate, based on the bomb curve atmospheric 14C concentration, the turnover rate from a few years in the top 1.5 m to 1–2 decades at depths 3–5 m. Once converted to agriculture, these roots were destroyed and most of the A horizon was eroded. The annual crop plant roots in the cultivated ecosystems are highly concentrated at 0.5 m in the soil profile. Repeated plowing of agricultural fields in the past reduced soil permeability and re-expansion and downward propagation of roots of secondary pine forests have not matched what they are in reference hardwoods, despite the many decades of pine regeneration. Thus, the rooting in old-field pine forests is deeper than cultivated fields as these secondary pine forests have regrown for nearly a century, but remain not as extensive at depths below 2 m compared to the never cultivated hardwood forests. The 14C concentration in the top 1.5 m of pine sites is slightly higher than in hardwood soil and turnaround time even for this top layer is about 20–30 yr, the turnaround time in the underlying 3–5 m layer increases to about 30–40 yr. The cultivated site has the lowest CO2 concentrations especially in the 3–5 m soil layers and the highest 14C concentrations, which correspond to turnaround rates about 50 yr. These estimated turnover times assume of course that Δ14C of the CO2 in root respiration matches the contemporary atmosphere. Particularly in old and deep forest roots, if root respiration is somewhat higher than 20‰ (the approximate current value), the turnover rate of CO2 at 3 and 5 m will be overestimated (Wang et al. Reference Wang, Hu, Ming, Oenema, Schaefer, Dong, Zhang and Li2014).
CONCLUSIONS
For the first time, the variations of CO2, O2, δ13C, 14C, and δ18O of soil CO2 and free oxygen have been estimated in situ in deep soil profiles under contrasting land uses down to 5 and 8.5 m. These data can tell us much about biogeochemical dynamics of the gas phase of subsurface environments.
While the isotopic composition of oxygen in CO2 is relatively constant and does not change with depth or land use, the free oxygen in soil gas has a markedly different behavior but this depends on land use. In the case of the cultivated soils, with very low root density below 0.5 m and with little decreases of oxygen concentration with depth, we observe little change in O2 and δ18O values with depth, which are also close to atmospheric values. The soil O2 in the forest soils, however, is significantly depleted in O2 and strongly fractionated as measured by large enrichments in in δ18O: under pines at 3 m, as O2 diminished to 14.5%, δ18O increased to 9.9‰, under the hardwoods, however, as O2 diminished to 10.5%, δ18O increased to 18.5‰. We attribute these remarkable patterns to the strong fractionation of O2 during respiration, combined with a relatively low respiration rate at these deep depths, and a relatively long residence time of the remaining O2 that remains in the deep soil air.
The stable carbon isotopic composition in all profiles had similar patterns to their depth-dependent changes: CO2 becomes slightly lighter with the depth. We attribute differences in land use to be largely due to the cycling of SOM derived from C4 plants.
Based on the Δ14C in soil CO2, the turnover rate of CO2 slows with depth although the turnover rates are much higher at depth under forest than under cultivated crops. In cultivated soils, Δ14C in soil CO2 reach 140‰ at 5 m, which corresponds to minimal turnover rate about 30 yr. The forest sites have generally similar depth-dependent patterns in Δ14C of CO2, with turnover rates calculated to be about 15 yr based on Δ14C in 5-m-deep soil CO2. This calculation depends entirely on the assumption that deep root respiration produces a Δ14C of the contemporary atmosphere, an assumption that certainly needs testing.
Such remarkable gas dynamics lead us to emphasize the great need for studies of deep rooting volumes of the soil and the rates at which ecosystems evolve in their belowground dynamics. Our results suggest that not only will changes in land use be most pronounced at considerable depths, but that regeneration rates of forest root systems following forest clearing may be considerably more sluggish than is suggested by aboveground regeneration.
ACKNOWLEDGMENTS
This work was supported by the National Science Foundation under the Calhoun Critical Zone Observatory effort (project EAR1331846).
Supplementary materials
To view supplementary material for this article, please visit https://doi.org/10.1017/RDC.2018.99