Researchers who conduct survey experiments often encounter respondents who do not pay sufficient attention to questions and experimental vignettes. This problem is especially acute in the increasingly common online setting (Berinsky, Margolis, and Sances Reference Berinsky, Margolis and Sances2014). Experimental noncompliance is not a new problem, and methods for addressing it are well known. However, we find that current practices for analyzing survey experiments rarely include these methods. Accordingly, we encourage the use of two simple strategies for identifying noncompliant survey respondents. These strategies can be used with established methods for estimating treatment effects under noncompliance.
The State of the Literature
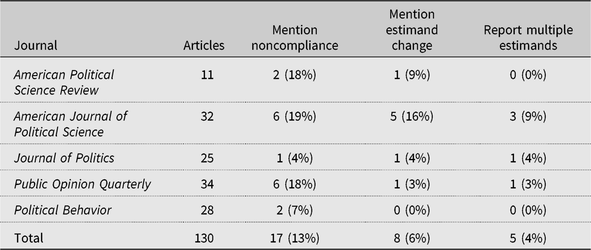
We conducted a meta-analysis of all articles reporting survey experiments published from 2006–2016 in five major political science journals. We coded whether each article mentions noncompliance, discusses the fact that noncompliance changes the causal estimand, or reports multiple estimands due to noncompliance. We summarize the results in Table 1 (see the Appendix in the Supplementary Material for further details).
The results indicate that most articles published in these major journals ignore the possibility of noncompliance in survey experiments. Additionally, some of those that discuss the issue respond to it by subsetting the data or dropping noncompliant respondents. These ad-hoc practices are problematic because they usually amount to conditioning on a post-treatment variable (see the Appendix in the Supplementary Material). In those cases, subsetting will alter the causal estimand and introduce bias into the estimate.
Table 1 Noncompliance in Political Science Survey Experiments, 2006–2016

Note: Cell entries summarize our coding of articles reporting survey experiments published from 2006 to 2016. See the Appendix in the Supplementary Material for complete details of the coding procedure.
The common approach of ignoring noncompliance typically yields an estimate of the intent-to-treat effect (ITT). However, in practice, some researchers who report the ITT seem to believe that they have identified the average treatment effect (ATE). This practice can be problematic if noncompliance is present; estimating the ITT but interpreting it as the ATE is inconsistent with the goal of conceptual precision in causal analysis. Of course, a researcher conducting a survey experiment may actually be interested in treatment effectiveness, which is the substantive interpretation of the ITT. However, we contend that in such a case, the researcher should provide justification for the choice to focus on the ITT. Additionally, even if estimates of the two quantities are signed similarly, the researcher should care about accurately estimating the magnitude of a treatment effect.
Recommendations
We propose two straightforward methods for measuring noncompliance in survey experiments. These are somewhat simple measures and are certainly not the only possibilities. However, they are useful because they are easy to implement and effective at separating compliers from noncompliers. After employing one or both of them to measure noncompliance, a typical approach is to estimate the causal effect among compliers. Researchers often employ instrumental variables analysis to estimate the complier average causal effect (CACE) in such a case (see Angrist, Imbens, and Rubin Reference Angrist, Imbens and Rubin1996).
Our first suggested method for measuring compliance is to record screen time for the display of experimental vignettes. As with other “latency measures,” the analyst can determine some minimum acceptable time at which to code a respondent as compliant. Prior research on reading speed may help with this decision (see Rayner Reference Rayner1998). However, as a best practice, we recommend the use of pilot studies on small convenience samples to learn more about the time it takes for respondents to read and internalize vignettes in the specific experiment in question. In the Appendix, we provide a detailed demonstration of this approach with a replication of a survey experiment in Harden (Reference Harden2016).
Second, researchers can repurpose manipulation checks to determine whether a respondent read and thought about the treatment. A manipulation check involves one question or a series of questions designed to evaluate whether respondents can display comprehension of the vignette content. Such questions are typically used to assess internal validity of the experimental manipulation, but they can also be designed to measure compliance. We also recommend the use of pilot studies with this approach. Testing manipulation checks can help researchers with decisions such as whether to use a single question or a battery of several questions as well as the number of correct answers a respondent must provide to qualify as a complier.
Both of these strategies require the researcher to make some seemingly arbitrary decisions, such as the latency cut-off time or the number of correct answers in a manipulation check. While pilot testing can help with this issue, it likely will not remove it completely. Accordingly, we also recommend that researchers describe and justify their chosen strategy for measuring compliance in pre-analysis plans (see Monogan Reference Monogan2013). Publicly committing to a particular strategy before collecting data holds the researcher accountable and minimizes the risk of adjusting the definition of compliance after looking at results.
The Bottom Line
Noncompliance is likely present in many survey experiments, particularly given the popularity of recruiting respondents from online pools. This is an old problem in a new form, but one that poses real threats to securing causal inferences and drawing meaningful substantive conclusions. In the Appendix, we present replications of 51 treatment effect estimates from survey experiments in six published studies. We find that moving from the ITT to the CACE corresponds with a median increase of 28% in the magnitude of the effects. In sum, we urge scholars to pay attention to indicators of noncompliance in this familiar setting and to properly account for it when the problem is present.
Supplementary materials
To view supplementary material for this article, please visit https://doi.org/10.1017/XPS.2019.13
Author ORCIDs
Anand E. Sokhey 0000-0002-3403-0967, Jeffrey J. Harden 0000-0001-5337-7918


