

Introduction
International trade expanded in the long nineteenth century (that is, up to the First World War). The reasons for this growth are clear, although the relative importance of rising incomes, technological progress, falling costs of maritime and overland transport, and a general trend towards free trade are debated.Footnote 1 Moreover, a highly stable international monetary system, which was based on the gold standard and gradually included more countries, also favoured the integration of the international goods markets.Footnote 2 This upsurge in trade, together with mass transoceanic migrations of workers and movement of capital, were the essential components of the first globalizing wave.Footnote 3
Agricultural commodities and food products were a key component of the increase in international trade, accounting for approximately half of all trade.Footnote 4 Inter-industrial trade (that is, between manufactures and primary goods) is fundamental to the explanation of international exchanges of goods, and the increasing integration of markets had a significant impact on agriculture.Footnote 5 The agricultural depression, widespread at the end of the nineteenth century, was thus a direct outcome of intensifying competition in European markets. This competition involved continental farmers and those from other countries, mainly the Americas and the eastern fringes of Europe, where huge tracts of new land were being brought into cultivation.Footnote 6
The agricultural trade trend between 1900 and 1913 prolonged the growth witnessed in the nineteenth century, but fell sharply during the First World War. It then recovered and expanded rapidly until the crash of 1929, when it initially dipped and then stagnated. Overall, between 1903 and 1938, agricultural trade grew at an annual growth rate of 1.4%, considerably less than the rate of 3.7% achieved in the second half of the nineteenth century.Footnote 7
Given this background, the aim here is to analyse the dynamics of international trade in cereals in the first third of the twentieth century, and the causes of the significant fall in this trade that took place after 1929, including associated price levels. We are interested in explaining how the protectionist turn of the 1930s and the great contraction of trade in cereals, and especially wheat, were mainly caused by self-sufficiency policies developed by European importers, in addition to general policies arising from the Depression. To this end we will study the evolution of the trade in cereals over this period, while also comparing it with the general trade of food and agricultural products. In addition, we will examine the structure of this trade. For wheat, maize, and rice we will examine the operation of their respective markets, giving special attention to the import and export flows between consumers and producers.
In order to achieve our goal, we have made an intensive effort to build a solid database to quantify cereal trade in that period. Our main source is the statistical yearbooks published by the International Institute of Agriculture (IIA) based in Rome. For the years 1900–38 the IIA offers quantitative information on the trade undertaken for sixty-two products. Among them are the main cereals. It has therefore been possible to construct an annual index of the volume of the cereals trade, although this annual series does not permit its disaggregation by continents. Such disaggregation is possible using the five-yearly averages published by the IIA for the years 1909–13, 1924–28, and 1928–32. For the years 1932–36 the authors have been able to formulate another average, based on annual data published by the IIA. The averages of the quantities exchanged have been multiplied by their prices in the year 1925, obtained principally from the same source, to aggregate trade in all cereals.
The period analysed is extremely important. On the one hand, it encompasses the final decades of the first wave of globalization, which the expansion of free trade had boosted. On the other hand, it also includes the years after 1929, in which the collapse of this globalization took place. However, from the mid 1920s growing tensions can be seen in regard to agricultural products as a result of excess supply in some products. These problems led to increased public intervention in agriculture, which was reflected in strong restrictions on free trade, and also in the beginning of government intervention in agricultural product markets. Both types of intervention had long-term effects after the Second World War. Consequently, the 1930s can be considered as a period that not only marks the definitive end of the first globalization, but also saw the emergence of highly interventionist public policies in agriculture.Footnote 8 The case of trade in wheat, which experienced intense difficulties in the 1930s, and where multiple attempts to seek cooperative solutions through international agreements failed completely, is paradigmatic. If wheat is the product that historians use to show the progress of the process of international economic integration in the nineteenth century, in the 1930s it also exemplifies the collapse of the first wave of globalization. The article first analyses international cereal trade as a whole, then examines its principal products, maize, rice, and especially wheat, to which we shall dedicate a large part of this study.
International trade in cereals: the nineteenth century background
From the onset of the first wave of globalization, cereals, particularly wheat, were key products in international trade. Progress in market integration in the nineteenth century has been estimated using specific prices of wheat, which was a product strongly representative of international trade.Footnote 9 Throughout this period, the global cereal market underwent an integration process in which the dispersion of prices was significantly reduced, and the speed at which they converged when there were shocks accelerated.Footnote 10 Around 1870 the European market for wheat therefore achieved a high and unprecedented level of integration. Intercontinental integration also took place, especially in the so-called Atlantic economy.
The trade in cereals similarly expanded markedly, especially after the 1840s. European demand, and especially that of Britain, was decisive in this growth, because of the increase in population and per capita income. There was also an increase in supply, due to both biological innovations and the beginning of the mechanization process in agriculture with the diffusion of reapers and harvesters. Finally, the integration of the markets was another driving factor in this trade, as trade costs were reduced owing to cheaper transportation and trade liberalization.
After the Napoleonic wars, the trade in cereals grew in Europe, although the levels reached were modest. The definitive abolition of the Corn Laws in Great Britain in 1846 was a key factor in the expansion of the grain trade.Footnote 11 The increase in British demand did not initially imply an invasion of the country by foreign cereals, nor a substantial drop in the price of wheat on the islands.Footnote 12 However, it induced an increase in production in other countries, first in Europe and later in other continents. As a result, trade grew very rapidly until the late 1870s, multiplying more than ten times between 1846 and 1880 (Figure 1).

Figure 1 World trade in cereals (tons), 1815–1903. Exporters (X) included: Sweden, Denmark, United Kingdom, Russia, Romania, France, Austria-Hungary, Spain, India (only wheat and rice), USA (wheat and rice) Canada (wheat), Argentina (wheat and maize), Siam (rice), French Cochin China (rice). Importers (M) included: Sweden, Denmark, United Kingdom, France, Spain, Austria-Hungary, Norway, Italy, Germany, USA (rice), China (rice). Sources: Brian R. Mitchell, British historical statistics, Cambridge: Cambridge University Press, 1988; Brian R. Mitchell, International historical statistics, Europe, 1750–1988, New York: Stockton Press, 1992; Brian R. Mitchell, International historical statistics, the Americas, 1750–1988, New York: Stockton Press, 1993; Peter A. Coclanis, ‘Distant thunder: the creation of a world market in rice and the transformations it wrought’, American Historical Review, 98, 4, 1993, pp. 1050–78; A. J. H. Latham and Larry Neal, ‘The international market in rice and wheat, 1868–1914’, Economic History Review, 36, 2, 1983, pp. 260–80; Estadísticas del comercio exterior de España, Madrid: Direccion General de Aduanas, 1849–1900; Bogdan Murgescu, România şi Europa: acumularea decalajelor economice (1500–2010) (Romania and Europe: accumulation of economic gaps (1500–2010), Bucharest: POLIROM, 2010; Historical statistics of Sweden, part 3: foreign trade 1732–1970, Stockholm: National Central Bureau of Statistics, 1972.
Wheat was the most important cereal in this trade. British demand had a fundamental role, because of a tremendous increase in imports. These began in small and irregular quantities, but after 1860 some 3 million tons of cereals were imported annually, even though 65% of the wheat consumed in the country was still domestically produced.Footnote 13 At the end of the 1870s, cereal imports to Great Britain normally exceeded 6 million tons. Germany also became a relevant importer, with import figures close to 3 million tons in the 1870s. In the other continental countries, imports were much more irregular and tended to complement the oscillations of domestic production, although France was also importing 2 million tons at the end of the 1870s.
Throughout the second half of the nineteenth century, Russia was the world’s leading exporter of cereals, representing between one-third and one-half of total exchanges. From the beginning of the 1860s, wheat arrivals from the United States to the European continent were already regular and significant, although much less important than Russian exports. In those years, driven by external demand, new exporters from eastern Europe also gained importance, especially Romania.Footnote 14
The great advance in the integration of the cereal market generated a serious crisis at the end of the century, due particularly to the competition for European farmers with the increasing arrival of wheat and other cereals from the east (the Russian empire) and from the west (above all the United States) at prices lower than their production costs. The immediate effect was a significant fall in prices, especially in wheat, the bankruptcy of many producers in the continent, and an intense demand for protection from abroad.
The maintenance of free trade policies, in countries such as Great Britain, the Low Countries, and Denmark, was the exception rather than the rule. As a consequence, in Great Britain national production represented only one-quarter of consumption.Footnote 15 Denmark took advantage of the new international prices to reorient its agriculture and move from being an exporter of cereals to importing them as inputs for its nascent export agriculture of butter and pork.Footnote 16 The large continental countries, such as Germany, France, Italy, and Spain, imposed protectionist barriers, which gave a certain margin to their farmers in competition with foreign production, on the condition that they modernize their farms, introducing innovations such as chemical fertilizers or machinery.Footnote 17
The protectionist policies put a stop to the expansion of exchanges, which only began to grow again during the final years of the century. At this time, new exporters emerged on the scene, with Argentine exports of wheat and maize, and Canadian wheat exports being particularly noteworthy. The new increase in trade is mainly explained by the continuing rise of British imports, with cereals amounting to 10 million tons. However, the imports of the large continental countries fell significantly in the case of France, and temporarily in Germany, where the quantities of the 1890s far exceeded the pre-crisis imports.Footnote 18
These protectionist restrictions were combined with population increases and a continuous rise in per capita income, which meant that some countries continued to substitute cereals such as rye with wheat, as this was preferred when the population had higher incomes. Wheat production increased appreciably from the crisis at the end of the century (56% between 1885–89 and 1909–14), more than doubling among the largest exporters, while among the European net importers (the large continental countries) it increased slightly (17%).Footnote 19
The tremendous increase that took place in the grain trade, mainly between the Old and New Worlds, would not have been possible without the building, in parallel, of powerful commercial networks that put exporters and importers in contact. In the beginning, this role was fulfilled by merchants from the producing areas of eastern Europe and its nearby regions. Thus, in the city of Odessa – one of the main export centres of wheat in the second half of the nineteenth century – it was mainly Greek merchants who organized and supplied the trade route with Great Britain. Initially this was carried out under very difficult conditions owing to the uncertainty, and often ignorance, of prices and demand conditions in the country of destination. Thereafter, the increased scale of the business and the enormous speculative opportunities that arose led to the emergence of specialized traders, who operated simultaneously in several countries.
The large grain-trading houses that would dominate this trade in the second half of the twentieth century have their origins precisely in that period. Many of these grain merchants – from the lands that stretch from Antwerp, through the Rhine basin, to Switzerland – began their operations replacing the former Greek intermediaries. New technologies, such as the telegraph and more efficient transport systems, such as railways or steamships, facilitated the operations of these merchants. Their businesses soon had a global scope, organizing their purchase networks in places as far away as Russia, Argentina, Canada, or Australia, and selling simultaneously in various European markets. From 1883, the Liverpool Corn Trade Association authorized futures trading, reducing the risk of adverse price fluctuations. In addition, during the last decades of the nineteenth century, powerful trading companies emerged from the United States. These companies tried to vertically integrate the business with substantial innovations in grain handling, from purchase, storage (for which it was necessary to build a large network of grain elevators), and transformation into flour (with the establishment of factories with modern machinery) to sale and commercialization (which also implied a close relationship with the railway companies).
The Bunge, from Buenos Aires, the Louis-Dreyfus and the Fribourg, from Paris, and the Cargill, from the United States, were key in the integration of the grain market. As Dan Morgan pointed out years ago, ‘exchanges were connected by the new high-speed international communications equipment; the grain trade was the first great international business to make full use of this new technology and of all the modern logistical systems that reduced the size of the planet in the twentieth century’.Footnote 20 The intensity of business growth, the huge speculative opportunities, and the fact that the grain trade was still a cash-and-carry business, generated a market in which plenty of grain merchants operated in a fairly competitive environment.
Until the early decades of the nineteenth century, the United States was the principal exporter of rice, although Asia also played a significant role in the world rice trade.Footnote 21 Subsequently, Southeast Asian countries moved to the head of exporters.Footnote 22 The cause of the decline of the United States in favour of other producing regions is to be found in the US, as much as in events in the rest of the world. First, the land suitable for this type of crop was limited and the fertility of areas already under cultivation was declining. Second, other more profitable crops, such as cotton and tobacco, competed for available capital and land. Third, the decline of rice production was exacerbated by the Civil War and the consequent loss of harvests, as well as the abolition of slave labour. Finally, American rice had to face increasing competition from other zones, among them Italy, Brazil, Bengal, and Java, and, shortly afterwards, Burma, Siam (Thailand), and Indochina. Both land and labour were much cheaper than in the North American continent or in Europe, and often the labour power of the economic unit was poorly remunerated. Much fertile land, unused and suitable for the cultivation of rice, was readily available. Furthermore, in contrast to cotton or tobacco, Asian productivity in rice growing was not lower than in other regions of the globe. Although Siam was not colonized, the military and economic control exercised by the Europeans elsewhere determined a large part of the productive and commercial decisions, facilitating the capital necessary for the commercialization of rice. Finally, improvements in transoceanic transport, the opening of the Suez Canal, and the development of Australia and California made transportation costs cheaper in Asia.Footnote 23
The response of some Western producers to the considerable international supply from Southeast Asia was the establishment of tariffs to protect national production. Thus, in the nineteenth century, the United States, Brazil, and Italy, for example, raised their tariffs on rice imports. But from the 1850s, progress was made in the integration of the inter-Asian rice market, with a significant increase in its trade.
The evolution of world trade in cereals, 1900–38
In the first third of the twentieth century cereals represented a very important, although declining, share of the international trade in agricultural products, ranging from 20.6% in 1909–13 to 14.7% in 1934–38 (Table 1). This importance reflects the role of cereals as a principal source of energy in human food consumption. By 1928, cereals provided more than 50% of the calories in the diet of the majority of countries, except in the United States where they accounted for approximately 30%. The cereals trade displayed a clear rising tendency until 1914, falling significantly during the war years (Figure 2). The pre-war level was not regained until 1927. This was the maximum achieved by cereals in the entire period, in contrast to agricultural products as a whole, where the volume of exchanges continued to increase until 1929. From then on the volume of total agricultural trade decreased without again reaching the same level of exchange, although it recovered considerably after 1933–34. By contrast, the cereals trade showed no sign of recovery following its decrease after the crash of 1929.
Table 1 International imports of agricultural and food products and cereals (thousand US$, at 1925 prices)

Source: Authors’ elaboration based on IIA, Annuaire international de statistique agricole, Rome: International Institute of Agriculture, 1909–39.

Figure 2 International imports of cereals and agricultural and food products (thousand US$, at 1925 prices). Source: Authors’ elaboration, based on IIA, Annuaire international.
The fall in international exchanges of goods in the wake of the crisis of 1929 was principally due to the depth of the Depression, the dismemberment of the traditional channels of trade, the expansion of protectionism, and the increase in the importance of bilateral agreements as a way of settling trade movements.Footnote 24 The shortage of payment methods also had repercussions for the decrease in international exchanges, and explains in part the proliferation of bilateral agreements.Footnote 25 A greater consumption of national cereals and an increased usage of natural pastures to feed livestock, in place of imported cereals, were also important.
To explain the loss of importance of cereals within total agricultural trade, it is necessary to bear in mind the increasing number and volume of agricultural products participating in international exchanges. Furthermore, following the First World War, and in particular after 1932, the depressive effect exercised by protectionist policies implemented in the principal cereal-importing countries was extremely influential. Another relevant factor was the slow growth in the demand for cereal products, because demographic growth in Europe slowed from the 1920s. In addition, we can observe a tendency towards greater variety in the diet of the industrialized countries as per capita income rose; as revenue improved, the demand for cereals fell and that for fruit and meat increased. The demand for cereals had negative income elasticity.
Within cereals as a whole, wheat was without a doubt the most important, followed by rice, maize, and barley (Table 2). The relative weight of wheat began to fall in the mid 1920s, while the relative importance of rice and maize continued to increase. Another factor of note was the marked decline in the post-war barley trade because of the sharp fall in Russian exports, which accounted for more than 67% of worldwide exports in 1909–13. A weakening demand for rye was due to the preference for wheat rather than rye bread in most wheat-consuming countries. Finally, oats lost importance as a consequence of the mechanization of agriculture, as tractors replaced horses in agricultural labour.Footnote 26 This trend was reinforced by the decreasing dependence on horses for transportation.
Table 2 Relative weight of trade of cereals (percentages). Wheat flour and rye flour are included in their respective products

Source: Authors’ elaboration, based on IIA, Annuaire International.
If we examine the evolution of trade in the distinct cereals in absolute terms, it was rice that showed the greatest increase, tripling its exchanges from the beginning of the century until the end of the 1930s (Table 3). At the opposite extreme were oats. In general, the volume of exchanges of all cereals increased until the First World War. During the war, there was a fall in the exchanges of all cereals, particularly in the case of barley, rye, and oats. This sharp fall of these three crops was probably due to the geographical localization of exchanges. In both cases, three significant importers, Germany, Austria, and Belgium, ceased purchasing (at least through official channels), presumably as a result of the Allied blockade.Footnote 27 The rice trade experienced the lowest fall in trade volume as a result of the war (a mere 12%), while the cereal most affected was barley, with a fall of 80.3% in international trade. Cereals as a whole experienced a fall of 35% as a result of the war. Following the conflict, wheat, rye, barley, and oats reached their maximum level of exchanges in the period 1925–29. International exchanges of these cereals then fell until the end of the period. By contrast, maize and rice reached their maximum volume of trade in 1935–38.
Table 3 Evolution of trade of cereals (index numbers, 100 = 1903–07). Wheat flour and rye flour are included in their respective products

Source: Authors’ elaboration, based on IIA, Annuaire International.
The degree of trading in specific cereals did not reach 20% of production (Table 4). However, in some countries that were more oriented to foreign markets, such as Canada, Argentina, and Australia, the percentage of wheat production traded exceeded on average 50% of production. Wheat was the most traded cereal, although this diminished in the late 1930s, owing to the difficulties in importing. There was a significant fall in barley following the war, as Russian exports practically disappeared. Only the trade in maize increased throughout the period before the Second World War.
Table 4 Percentage of internationally traded grain production

a Average production 1909–12.
b No data for the Soviet Union in 1938.
c No data for the Soviet Union in 1936–1938.
d No data for the Soviet Union in 1936–1938.
e No data for China.
Source: Authors’ elaboration, based on IAA, Annuaire International.
The geography of international trade in cereals
Europe was the geographical area par excellence in the import of cereals. Prior to the war, European imports accounted for over 80% of the total world production. This percentage fell over time, and by 1934–38 was only 63% (Table 5). This loss of relative importance was mostly due to the aforementioned protectionist policies, declining population growth, the diversification of European diets, and the increasing importance of other geographical areas as significant importers of cereals. A major development was the increasing importance of Asian societies as consumers of cereals, owing to the expanding Asian rice trade, in addition to increased consumption of other types of cereals as the result of population and income growth.
Table 5 Regional composition of imports of cereals (world imports in thousand US$, at 1925 prices)

Source: Authors’ elaboration, based on IIA, Annuaire International.
The origin of exports was much more diversified (Table 6). Prior to the First World War, Europe was not only the principal importing region but also supplied nearly 50% of exports. However, this situation changed after the war. Europe was overtaken by the Americas and Asia, primarily because the Soviet Union was no longer among the leaders of exporting countries in the international grain trade. Countries in South America and Asia gradually established themselves as the most important exporters of cereals, thanks to their specialization in the most dynamic cereals: maize and rice.
Table 6 Regional composition of exports of cereals (world exports in thousand US$, at 1925 prices)

Source: Authors’ elaboration, based on International Institute of Agriculture, Annuaire International.
The evolution of world trade in wheat
From 1900, exchanges of wheat increased until the First World War, descended sharply during the conflict, and recovered from 1918 onwards. The annual rate of growth from 1903 until 1913 was 3.2%. Following the conflict, this growth stood at 5.9% from 1918 until 1931 but −5.6% between 1931 and 1938 (Figure 3). Until the First World War, trade in wheat was characterized by the stability of demand emanating from the European free trade countries, while that proceeding from the protectionist countries was highly irregular. The war and the decline of European production, as well as the end of Russian exports, stimulated a greater growth of production in the Americas and Australia, which increased their production very significantly (by 46%) between 1914 and 1925, while in the rest of the world rates of increase were generally negative. Exports from those countries also increased significantly.

Figure 3 International trade in wheat and other cereals (thousand US$, at 1925 prices). Wheat flour is included. Source: Authors’ elaboration, based on IIA, Annuaire International.
In the 1920s the market began to display unequivocal signs of saturation, and during the 1930s worldwide exports of wheat and flour decreased. This fall was approximately 65 million quintals between 1928–32 and 1934–38.Footnote 28 The principal explanation is to be found in the increasing self-sufficiency of the principal wheat consumers and the increase in protectionist measures. From 1929 onwards, the traditionally protectionist countries increased their tariffs on wheat imports, and, in 1932, adopted additional measures to reinforce their protectionist policies.Footnote 29 In some continental European countries, the intervention in the wheat market reached very high levels. In Italy, ultra-protectionist policies regarding wheat began as early as 1925 with the launching of the bataglia del grano (battle for wheat), which aimed to increase domestic production in order to eliminate imports. By 1931, Italy was self-sufficient in wheat.Footnote 30 In Nazi Germany, an Erzeugungsschlacht (battle for production) was similarly launched in 1925. The impact of the measures taken significantly increased food production between 1927 and 1936 and, in the case of wheat, self-sufficiency was finally achieved.Footnote 31 In France, tariff protection for wheat increased substantially at the beginning of 1929. After the October crash, the tariff was again raised to a level that was three times the price of wheat in Chicago. New measures followed that required the almost exclusive use of domestic wheat to make flour. From 1933, the import of wheat was banned, with some exceptions.Footnote 32 The highest degree of intervention was reached in 1936 following the creation of the Office National Interprofessionnel du Blé (National Wheat Office) by the Popular Front government, with the objective of regulating the operation of the wheat market, including the fixing of prices.Footnote 33 In Spain, self-sufficiency in wheat was established policy from 1923. In addition to a strong tariff increase introduced in 1922, wheat imports were banned, except when the price exceeded a certain limit.Footnote 34 In 1932, even Great Britain abandoned its free trade policy and adopted some form of protective measures and imperial preferences.Footnote 35
The IIA estimated that the demand for wheat in the principal importers fell from an average of 250 million quintals in 1926–27 to 1931–32 to approximately 150 million quintals in 1937–38. In the first third of the twentieth century, the global growth in the wheat trade was due to an increase in non-European imports that contrasts with the stagnation of European imports until 1929 and their subsequent decline, showing a decrease of 33% between 1924–28 and 1934–38.
World exporters and importers of wheat
At the start of the twentieth century, European exports accounted for almost 50% of the world’s total trade in wheat and flour. Nonetheless, the First World War had a decisive impact. The destruction of European harvests and the subsequent increase in the European demand for food encouraged other countries to increase production. Once the war had ended, the decline of exports from Russia and the Danube countries resulted in the concentration of such exports in the United States and the settler countries (Canada, Argentina, and Australia), which represented an extremely high proportion, ranging from 50% to 80%. Trade, which until 1914 was largely intra-European (50% of exchanges), became mainly intercontinental.
The withdrawal of Russia (20.5% of world exports in 1909–13) and of the countries situated in the Danube basin (Hungary, Romania, Yugoslavia, and Bulgaria) (14.6%) was largely the consequence of profound socioeconomic changes (Table 7). Following the war, and due in part to the agrarian reforms that most put in place, these countries decreased their exports, which generally came from large properties. As a result of reforms these holdings were divided among small farmers, so that per capita income increased.Footnote 36 This increased income signified in some cases a greater domestic consumption of wheat in rural areas, and, in others, a diversion towards other types of crops in response to changes in relative prices or in demand.Footnote 37 The result in both cases was a fall in the wheat surpluses available for export. Furthermore, the European political map changed as the result of the peace agreements, dislocating the pre-war economic relationships.
Table 7 Wheat production by the leading exporters. Wheat flour is included. Danube countries include Hungary, Romania, Bulgaria, and Serbia or Yugoslavia. Changes in borders have not been taken into account

Source: Authors’ elaboration, based on IIA, Annuaire International.
In Russia, the combination of war and revolution meant that exports were non-existent or insignificant, although by 1930 production exceeded 27 million quintals. According to the experts of the Imperial Economic Committee, the absence of Russian wheat exports between 1920 and 1930 was due not so much to poor harvests (although in fact there were bad harvests in 1922, 1923, and 1924) or the division of large estates (from where the majority of wheat destined for export during the pre-war years came) among small peasants and their subsequent collectivization. Rather, the absence of Russian exports was attributed partly to a greater internal consumption of wheat, as a result of both demographic increase and a rise in per capita consumption, and partly to the resistance of small farmers to produce a surplus for export, given the scanty rewards offered by the state.Footnote 38
Imports of wheat and wheat flour were clearly dominated by the European continent. Europe imported between 70% and 90% of all wheat traded (Table 8). However, Europe’s importance declined as the period advanced, while the relative weight of the remaining continents increased as importers of wheat. The growth of Asian imports of wheat is notable, rising from 5,328,740 quintals in 1909–13 to 18,279,200 quintals in 1934–38, an increase of 243%. This was probably due to the growth of personal income (especially in Japan), which led to greater demand for wheat suitable for bread and as a substitute for other cereals, as well as to the marked rise in the Japanese population. As in India, rice and wheat became substitute foods, their demand depending on their relative prices.Footnote 39 Thus, rapid population growth in China made it necessary to increase wheat imports, which rose from only approximately 4% of the Asian total before 1928 to 51.2% in 1928–32 and 40.9% in 1934–38. Meanwhile, after the war India moved from being an important exporter of wheat to being a net importer. The principal reasons for this were the fall in its average production of wheat between 1924–28 and 1928–32 and the lack of incentives to export, owing to the rapid growth of population and the low international prices of wheat from the late 1920s.
Table 8 World imports of wheat and flour (thousands of quintals)

Source: Authors’ elaboration, based on IIA, Annuaire international.
The working of the international wheat market
At the end of the 1920s tensions began to appear in the international wheat market. The volume of trade continued to increase until it reached a maximum in 1929, although in the European continent it had already begun to decline. This problematic situation was clearly reflected in wheat prices, which displayed a slight decreasing trend from 1925 onwards. From 1929 prices fell drastically (Figure 4). Even more interesting is the comparison of wheat prices with those in the rest of the economy. If we compare them with a wholesale price index for Great Britain, we can estimate their evolution in real terms. Figure 4 shows that, until approximately 1921, wheat prices evolved in tandem with those in the rest of the economy, meaning that the purchasing power of wheat producers did not change significantly. From then on, two periods can be identified – the first between 1922 and 1924 and the second from 1928 until 1930 – during which time the price of wheat fell by more than the wholesale price index. Between 1926 and 1934, wheat prices deflated by the wholesale price index fell by approximately 43%. At the time this continuous decline in prices from the mid 1920s until the mid 1930s was categorized as ‘the wheat problem’.
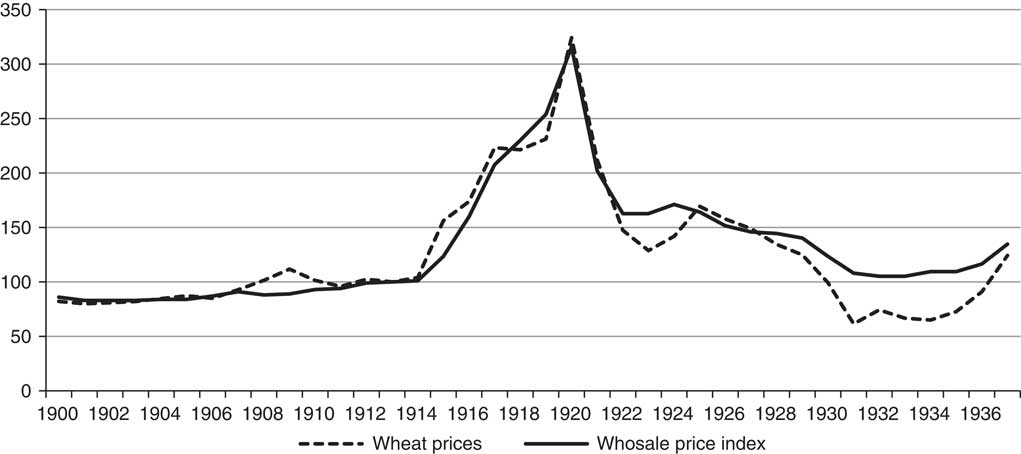
Figure 4 Evolution of wheat prices and the wholesale price index in Britain (100 = 1913). Sources: Wheat: C.I.F. unit values from The Annual Statement of the Trade of the UK with foreign countries and British possessions. Wholesale price index: B. Mitchell (ed.), International historical statistics, Europe 1759–1993, Basingstoke: Palgrave Macmillan, 1998, p. 739.
The problematic situation of the wheat market was also reflected in a progressive increase in unsold wheat stocks. The same occurred with other agricultural products. From mid 1925 onwards, the progressive accumulation of stocks of the principal foodstuffs caused a fall in international prices.Footnote 40 Paul Hevesy stated that the stocks accumulated in these years were unsaleable, since not even the wheat which was offered to merely cover transport costs found any purchasers.Footnote 41 The simple fact of accumulating stocks also accounted for price instability. Agents in the market were concerned because of uncertainty about both the exact quantity accumulated and the moment at which new stock would be placed on the market. Another consequence of accumulated stocks was that the adjustments in the cultivated land area, which a free market situation would have demanded, did not occur.Footnote 42
The problem of the increasing accumulation of stocks was exacerbated following the great wheat harvest of 1928.Footnote 43 The margins between available wheat supplies and total utilization (including all the uses of wheat), plus the normal reserves, continued to grow, and were reflected in an increase of stock.Footnote 44 From around 1922 the trend of decreasing wheat prices thus corresponded with a significant increase in stocks. Meanwhile, production continued to grow, reaching a maximum in 1929 (Table 9). The problem of wheat was a problem of imbalance between supply and demand, which led to an excessive supply of wheat at the international level that in turn depressed prices. This problem only developed after the First World War, since in the pre-war period the rhythm of increases in the supply and demand for wheat was approximately the same, so that the market situation was one of equilibrium. Paul de Hevesy has pinpointed the years between 1926 and 1934 as the period when the problem of overproduction was most severe.Footnote 45
Table 9 Growth of world wheat production (100 = 1909–13)

Source: Authors’ elaboration, based on IAA, Annuaire International.
The most important factor in the determination of the international price for wheat was the supply available in the market.Footnote 46 This depended not only on the most recent harvests but also on the stock accumulated from previous years and the forecasts made regarding the quality of the following harvest. Apart from these factors, the deteriorating international economic situation during the 1930s depressed wheat prices and limited the growth of international demand. By contrast, demand was fairly stable, with population growth causing only slow modification, which did not affect the annual variations in international prices. Nevertheless, in the long term, demand factors can be important in the determination of the trend in international prices. In general, annual price movements represented changes in the supply–demand relationship. Here the most important factors were expectations regarding the following harvest, the quantity of accumulated stocks, the prices of other cereals, and the prices of other foodstuffs (such as meat and potatoes).
In summary, it can be stated that the first principal cause of the ‘wheat problem’ was the implementation of protectionist measures in the second half of the 1920s and their strengthening from 1932 onwards in the largest importers (Germany, France, and Italy), which stimulated the national production of wheat in order to achieve self-sufficiency. A second factor was the implementation of this type of policy in Great Britain, the Netherlands, and Denmark, which until then had espoused free trade. In the third place, in the years 1930–31 Russia emerged as an important exporter for the first time since the First World War.Footnote 47 Finally, and most importantly, there was an increasing disequilibrium between worldwide wheat supply and demand, due principally to the increase in global production for export. At the same time, consumption remained stagnant or fell in the large consumer countries, mostly as a consequence of the afore-mentioned protectionist and self-sufficiency policies. The worldwide production of wheat increased greatly throughout the first third of the twentieth century because of the increase in yields per hectare (intensive growth) and the rise in the number of hectares sown with wheat (extensive growth).
The continuous growth in the worldwide production of wheat was possible owing to technological innovation that permitted greater production of wheat. These advances included research into new varieties of seeds that were adapted to different soils and climatology, the increasing use of fertilizers, and the mechanization of agriculture.Footnote 48 In some countries, notably Australia, Canada, and the United States, technical advances were aimed at increasing production per worker. The introduction of capital-intensive and labour-saving technology in these countries reflected their factor endowment: labour was scarce and land was fertile, virgin, and abundant. Consequently, labour costs were greater and land costs lower than in Europe. By contrast, in Europe, which was much more densely populated, technical advances were directed at increasing yields per hectare.Footnote 49
The marked increase in the production of wheat in countries outside Europe was linked principally to the expansion of the frontier, with the cultivation of huge tracts of land.Footnote 50 Once investment had been made in the ploughing of virgin lands for the cultivation of wheat and the introduction of modern machinery, in response to the increase in demand or prices, it was very difficult to reduce the number of hectares as a consequence of poor market conditions. The initial costs faced by farmers were high and inflexible with regard to the variation in wheat prices, so that most were reluctant to reduce the number of hectares cultivated because of the expenses already incurred. Instead, they hoped to recover their losses when the market situation improved. In addition, agricultural activity in general included the entire family, and thus the costs associated with lessening production were much greater than if only one member of the family was involved. The common reaction to a fall in prices, which reduced agricultural income and increased indebtedness, was to increase production, since farmers attempted to maintain gross income and reduce general expenditure. A reduction in prices therefore coexisted with increases in production. In Europe, the return of the Soviet Union to the group of exporters at the end of the 1920s, although in quantities far lower than the pre-war figures, doubtless led to greater market saturation.
In the increase of production a decisive role was also played by the protectionist policies applied by the principal importing countries, which encouraged expansion of the number of cultivated hectares by maintaining high prices, especially from 1929 (Table 10). Hevesy states that, between 1924 and 1931, wheat prices in Liverpool fell by 52%, while in France, Germany, and Italy they rose by 39%, 60%, and 2% respectively.Footnote 51 In these three countries the number of hectares dedicated to wheat rose between 1919–24 and 1929–34. The increase was approximately 46% in Germany, 6.4%, in Italy and 3.3% in France, and the figures continued to rise in Germany and Italy until the end of the 1930s.
Table 10 Import duties on wheat, 1926–36 (gold francs per quintal). The gold franc is the pre-devaluation Swiss franc. After devaluation (26 September 1936), however, original prices have been converted into $US and multiplied by 3.061, which can be considered as the rate of exchange between the dollar and the former gold franc

a Imports against payment of the given import duty were subject to special conditions.
b All imports under special control (quota, licence system, monopoly, etc.).
Source: Hevesy, World wheat planning, p. 762.
Between 1880 and 1929 protectionist policies had been based on simple customs tariffs, but from the latter year until 1934 supplementary measures were utilized to reinforce protection. These measures established obligatory percentages for the quantity of national wheat which the flour produced in a certain country had to have. Moreover, it was usual to establish quotas on the importation of cereals from abroad. Finally, until the start of the Second World War, the state in these countries was in complete control of foreign trade and the wheat market. Even countries which had traditionally been free traders, such as the United Kingdom, eventually joined the protectionist camp.
Indirectly, the Great Depression played a significant role in maintaining low wheat prices. In the view of Joseph Davis, the worsening of the international economic situation negatively affected trade exchanges, restricting foreign credit (which on other occasions had facilitated the increase of imports) and increasing restrictions on trade.Footnote 52 Consequently, the poor economic situation in various countries reduced the demand for wheat in European countries. In many cases, increasing protectionism and the lack of confidence in political relations led to agricultural policies of self-sufficiency, which resulted in an increase in the hectares cultivated. In addition, new seeds and technical advances facilitated the extension of cultivation to lands of poorer quality.Footnote 53 On the demand side, in the principal consumer countries the increase in per capita income contributed to a decline in the consumption of cereals.
Numerous studies undertaken at the time showed that in the developed countries demand elasticity with regard to income was systematically negative in the 1920s and 1930s. In the short term, price elasticities were close to zero. In the case of the United States, Henry Schultz estimated that in the years 1921–34 each increase of 1% in per capita income generated a fall in consumption of 0.2%. For the period of 1896–1913, the elasticity of demand was similar, at −0.15. Very similar values were obtained by Holbrook Working for the same years. For Great Britain, and based on family budget surveys, Stone calculated that bread demand elasticities were negative in the years 1937–39.Footnote 54 Consequently, despite demand increasing with demographic growth, the fact that consumption per capita tended to fall resulted in a very slow growth of worldwide demand. Thus, according to the calculations of Malenbaum, per capita consumption fell significantly in overseas exporting countries and very slightly for European importers.Footnote 55 In addition, in 1931 the IIA calculated that there was a slight decrease in per capita consumption in Europe, but that this decline was considerably higher in the United States. Added to the slow population growth, this meant very small increases in consumption in absolute terms between the years prior to the First World War and 1930.Footnote 56 The crisis of 1929 was not the cause of consumption per capita of wheat in 1929–34 being lower than that of 1924–29. Instead, falling income in the industrialized countries meant little change in a diet still basically composed of cereals towards a much more diversified one.
In short, the ‘wheat problem’ was a result of the growth of worldwide supply that exceeded demand. The origin of this disequilibrium between supply and demand was to be found in increased production by overseas countries. This was encouraged by the extraordinary demand for wheat in the countries directly involved in the First World War, during the years of conflict and during the post-war epoch, until their harvests recovered. Once European production had stabilized, worldwide supply outstripped the needs of consumption, meaning that international prices tended to fall. It is from that moment that government activity in both the exporting countries and the principal importers accentuated the problem of oversupply. As we have seen, in all cases (with the exception of Great Britain until 1932) governments implemented agricultural and trade policies that protected wheat farmers from the prevailing low international prices. In many cases, rather than falling, wheat production continued to rise. The slow growth of demand, a consequence of the improvement of per capita income in the most developed countries, contributed to creating an unfavourable environment.
This complex situation in the international grain market had important consequences on the intermediaries that operated in it. On the one hand, the great European grain traders were able to enter the North American market by purchasing grain elevators and other facilities (downstream integration). On the other, American companies continued to prosper with their integrated business model. In addition, the downward trend in prices and the slowdown in the increase in demand in the 1920s reduced speculative opportunities. As a response to this environment, the intermediaries increased their business volume, which implied greater capital needs. The Depression of the 1930s, with greater public intervention in the market and even lower prices, caused many intermediaries to go bankrupt. Only those companies with marginal advantages in moving grain were able to increase their profits. The consequence was a substantial reduction in competition and the emergence of an oligopoly of giant companies. The problems of the Depression ‘speeded the trend toward concentration, consolidation, specialization, and industrialization’.Footnote 57
International attempts to solve the problem of wheat: the failure of the London Conference
Those countries in which wheat represented an important percentage of the total value of exports were particularly affected by low prices. In the period between 1926 and 1930, the percentage that wheat and wheat flour represented in total exports was 31% for Canada, 27% for Argentina, 17% for Australia, and 8% for the Soviet Union, but only 5% for the United States.Footnote 58 However, all these countries had reduced their dependence on wheat around the mid 1930s. Thus, between 1932 and 1936, these percentages were 22.5% for Canada, 17.3% for Argentina, 14.8% for Australia, 6.7% for the Soviet Union, and 1.2% for the United States.Footnote 59 As a result, the economies of Canada, Argentina, and Australia were more vulnerable to the fall in wheat prices than those of the United States or the Soviet Union. This probably explains the different behaviour of the first three countries on the one hand and that of the United States on the other. When international wheat prices were very low, the United States was capable of reducing its volume of exports, accumulating stocks, or establishing export quotas, while the other three large overseas exporters further increased their exports in an attempt to recover part of the export revenue which they had lost because of low prices.
In the international sphere, there were various attempts to solve the problems of falling wheat prices through numerous international conferences. Specifically, in the years 1930–31, sixteen international conferences were held with this objective. Conferences of specific countries that shared common private interests, and those that included all countries involved, may have clarified the problem and proposed solutions, but any implementation was unsuccessful. Among the distinct solutions proposed, that of creating a system of quotas among the exporting countries and establishing a cartel for the international marketing of wheat generated the greatest support. This proposal was taken to the London Conference, held from 18 to 23 May 1931 with the goal of giving concrete form to a law to be ratified by the principal exporting countries.
Before the opening of the conference, the exporting European countries met to propose the signing of an agreement between importing and exporting countries to give preferential treatment to exports of wheat from Europe, without applying the clause of most favoured nation to the remaining exporting countries. Some European importers, such as Germany and Czechoslovakia, supported the proposal, since they saw such an agreement as a solution to exchange manufactures for wheat. Others, however, opposed the idea, especially Great Britain, which already had agreements with the Commonwealth countries. Nor would the League of Nations give its support, since one of its missions was to reduce restrictions on international trade. Not surprisingly, Europe’s exporting countries also disagreed, since they did not consider themselves responsible for the overproduction of wheat. By the end of the 1920s their production was lower than before the First World War, and they viewed the issue as a problem of low prices and not one of imbalance between supply and demand. Furthermore, they believed they had a ‘historic right’ to preference for their exports to other European countries against those from non-European countries, and consequently to be awarded a quota in the importing countries equal to the quantity of exports in the pre-war period.Footnote 60 They therefore saw no obligation to reduce wheat production, and in some cases even considered an increase. Nevertheless, these European exporters believed that, without the collaboration of all the exporting countries, it would be impossible to raise international wheat prices. Consequently, the idea of an intra-European system of preferences was abandoned and the creation of a system of quotas in the international sphere was proposed.
The London Conference hosted the eleven most important exporting countries, with the intention of reaching an agreement regarding the quotas that would be assigned to each country and other matters, such as projected subsidies for the accumulation of stocks, and the means of sanctioning those countries that did not respect the agreement. The eleven countries participating in this conference were Argentina, Australia, Bulgaria, Canada, Hungary, India, Poland, the Soviet Union, Rumania, Yugoslavia, and the United States. With the exception of the Soviet Union, the European countries were naturally supportive, but even Argentina, Australia, and Canada accepted the measure ‘in principle’. In Taylor’s view, Argentina and Australia agreed because they thought that prices would be better maintained if only part of their production, and not all, was traded on the free market.Footnote 61 Canada’s representatives believed that it could obtain satisfactory quotas because Canadian wheat was of good quality and was necessary in mixtures that produced the best wheat for bread. Despite admitting that the land area dedicated to wheat had increased since 1914, without taking into account their needs for internal consumption, these three countries were all opposed to reducing the land under production. They alleged that the expansion of production had resulted from agricultural movement into new lands, that that their production was highly mechanized and very cost effective. In addition, it was important to maintain revenue from wheat exports. In their view, it was countries with high production costs that should reduce their cultivated land area. The United States, whose minor dependence on wheat exports permitted a more objective analysis, was the only country which from the start opposed the quota system. Its representatives argued that the problem concerned overproduction and not low prices, and that the only solution was to reduce total supply through reducing the number of hectares cultivated. Given this lack of agreement, the London Conference closed without reaching any resolution to ‘the wheat problem’.
International trade in maize
Although the worldwide production of wheat and maize was quite similar, the volume of international trade in maize was only 40% that of wheat, primarily because in the United States, the principal producer, the bulk harvest was consumed internally, with 80% going to cattle feed. The volume of international trade in maize increased from 1900 to 1938 by 44.3%, equivalent to an annual growth rate of 1.5%. During the First World War, however, exchanges fell by more than 50 percentage points, proportionately more than for cereals as a whole. Nonetheless, following the war, trade in maize evolved more dynamically than overall cereal trade, even increasing during the Great Depression (see Table 3). Since maize was principally used for animal feed, the worldwide demand depended on its relative price in comparison to other products which were used to feed livestock. This was undoubtedly encouraged because of the decreasing price relative to other cereals and livestock feed.Footnote 62
With regard to imports, Europe was by far the largest purchasing region (Table 11). The relative importance of European imports of maize increased uninterruptedly until the early 1930s, from 91.9% of total worldwide imports prior to the war to 94.8% in the years 1928–32. From 1935 onwards, European imports were equivalent to 85.3% of the worldwide total, while the imports of North and Central America rose from 3.9% of the worldwide total in 1928–32 to 11.4% at the end of the 1930s. The fall in European importance after 1932 was probably due to increased protectionist measures and the expansion of maize production by some 28 million quintals. Here the principal importing country was the United Kingdom (including Ireland); its imports constituted between 22% and 38% of the European total that included Germany, the Netherlands, Belgium, and France. The prohibition by countries such as Great Britain of the import of live animals boosted the export of Argentinian maize to feed the domestic herds. Following Great Britain and Ireland, Germany, the Netherlands, Belgium, and France were the most significant importers.
Table 11 Regional distribution of maize imports (thousands of quintals and percentages)

Source: Authors’ elaboration, based on IAA, Annuaire International.
At the head of maize-exporting regions was South America (Table 12). Prior to the First World War, this region shared leadership with Europe, since it constituted 40.7% of worldwide exports and Europe 40%, although the countries of North and Central America were also important exporters, with 15.3% of the world total. Following the war, South America affirmed its leadership of the maize-exporting regions, while the relative importance of Europe and North and Central America fell. This was due in part to the increase in the land area cultivated with maize in Argentina from 1925 onwards and to the rise in production. Furthermore, the internal consumption of maize in Argentina was very small, owing to the low population density, and abundant natural pastures for the feeding of livestock.Footnote 63 Thus, in the period 1924–28 and during the greater part of the 1930s, over 80% of the maize traded internationally came from Argentina and the countries of the Danube basin. According to data from the IIA, Argentinean exports of maize constituted 40.6% of total worldwide exports in 1909–13, 63.5% in 1924–28, 68.4 % in 1928–32, and 64.2% in 1934–38.
Table 12 Regional distribution of maize exports (thousands of quintals and percentages)

Source: Authors’ elaboration, based on IAA, Annuaire International.
The international trade in rice
In the first third of the twentieth century the international trade in rice evolved much more dynamically than exchanges of wheat and of cereals in general. In contrast to other cereals (except maize), this trend continued until 1938, primarily because of the lessening importance of Europe as a rice importer. Although rice exchanges fell during the First World War, they recovered during the 1930s because it was possible to find markets to replace Europe.
Before the First World War, there was already a complex international network of trade in rice and an integrated international market in rice. British India (including Burma) became the continent’s largest rice exporter, followed by Siam and Indochina. There was a certain regional specialization, with Burma generally exporting to the Malay Peninsula and regions to the west of it, and Indochina and Siam, supplying the regions east of that peninsula. Burma was also ‘a natural reservoir for the entire rice-consuming regions of the world in time of scarcity’.Footnote 64
Most exports were directed to other Asian regions, China and Japan being important importing countries.Footnote 65 Between 54.6% and 70% of worldwide imports of rice were destined for the Asian continent (Table 13). The importance of Asia as an importing region increased throughout the period, followed by Europe. However, until the early 1930s there was a progressive fall in European imports of rice, because of European production of rice as well as tariff restrictions. During the 1930s, the increase in French imports from its colonies in Asia stabilized the figures for Europe. The French were attempting to compensate for the falling demand in the principal Asian import markets, because this had severely affected French-controlled Vietnam.
Table 13 Regional distribution of rice imports (thousands of quintals and percentages)

Source: Authors’ elaboration, based on IAA, Annuaire International.
Until the end of the nineteenth century Japan was a net exporter of rice, but from then on it became an increasing net importer. In 1918 Japan initiated a policy of ‘imperial self-sufficiency’, drawing on domestic production and its two colonies, Korea and Taiwan, for rice imports. This policy involved promoting production with support policies, both in Japan itself and in the colonies, raising tariff protection for rice and accepting duty-free imports from these colonies.Footnote 66 The results were rapid, and by 1935 Japanese production had increased by approximately 12 million quintals, while at the same time imports from Korea and Taiwan increased in net terms by around 14 million quintals.Footnote 67 Nevertheless, before 1928, Japan still needed to import large amounts of rice from outside its empire, principally from Siam, Vietnam, and Burma, and to some extent from the United States.Footnote 68 Before the First World War, imports from Japan’s colonies were approximately one-third of total imports, but by 1922–27 they were already 97%.Footnote 69 By about 1930 Japan was capable of supplying its population though the combination of national production and imports from its own colonies. Other imports of rice were effectively banned, while tariff protection also increased sharply. This policy had some adverse welfare consequences, especially for poorer consumers within the empire.Footnote 70 The principal rice exporters thus lost access to the Japanese market owing to the high tariffs (approximately 40%), but also because from about 1925 the market for rice fell in three other significant importers: China, Indonesia, and the Philippines.
The fall in Chinese imports was the most important (Table 14). Between 1921 and 1935, these amounted to 6.5–13.5 million quintals annually, but between 1936 and 1939 they fell to an average of 3–4 million quintals. This was partly due to China’s need to balance its payments, and partly to policies of self-sufficiency in food. Burma was the exporting country least affected by the falling demand in some Asian countries, since it was able to continue exporting to India, Ceylon (Sri Lanka), Malaya (Malaysia), and Europe. However, Siam and Vietnam suffered greater consequences as demand decreased from the East Asian countries that were their traditional markets, and they could only export to Malaya and non-Asian markets, principally Europe. However, Siam also exported to Cuba, while Vietnam, as part of the French empire, enjoyed the preference of the metropolitan and West African market.Footnote 71
Table 14 Principal importers of rice (thousands of quintals)

a Average 1931–32.
Source: Authors’ elaboration, based on IIA, Annuaire International.
The principal importers of rice in the 1930s were Japan, Malaya, Ceylon, India, and France. The first and last of these countries had preferential agreements with their respective colonies, meaning that only in Malaya, Ceylon, and India were markets of importance open to the remaining exporters. The expansion of the imports of these countries was due as much to population growth as to the specialization of domestic industries, which meant a fall in the relative importance of the domestic production of rice. The increase of their imports, plus the growth of the non-Asian countries, compensated for the fall in exports to Japan, China, Indonesia, and the Philippines in the 1930s.
As in the case of imports, the importance of the Asian continent as the origin of rice exports is striking, since it produced between 85.7% and 90.1% of world exports (Table 15). The international rice trade was thus located almost exclusively in Asia and, as purchasing power in the Asian countries increased, so did the volume of rice exchanges. Five countries exported 95% of the rice which originated from Monsoon Asia: Burma, Vietnam, Siam, Korea, and Taiwan. Italy and the United States were the only non-Asian rice exporters of importance, although Germany and France refined considerable quantities of Asian rice, which was then re-exported. Burma was without a doubt the principal exporter of rice at the end of the 1930s, exporting an average of 30 million quintals annually. Asian dominance in rice exports was due as much to the geographical localization of exchanges as to the comparative advantage with regard to production costs. The cultivation of rice was labour-intensive and much cheaper in Asia than in the rest of the rice-producing continents, so that its exports were much more competitive in the international markets. By contrast, the importance of Europe as a rice-exporting region fell throughout the first third of the twentieth century, reducing the annual rate of growth of European exports between 1909–13 and 1934–39 to −2.6% (Table 16).
Table 15 Regional distribution of rice exports (thousands of quintals and percentages)

Source: Authors’ elaboration, based on IAA, Annuaire International.
Table 16 Principal exporters of rice (thousands of quintals)

a Average 1931–33.
Source: Authors’ elaboration, based on IAA, Annuaire International.
Conclusion
The relative importance of the worldwide trade in cereals over total agricultural and food trade tended to diminish from the beginning of the twentieth century until the 1930s. Until the onset of the Depression, this relative decline was due in part to the intensification of international economic relationships, which meant that more products and countries participated in world trade. In addition, rising incomes in the more industrialized countries led to a diversification of their diets, and the consumption of a greater proportion of products of higher income elasticity, such as meat, dairy products, oils, or fruit and fresh vegetables. However, key factors in the fall of the grain trade after 1929 were policies of protectionism and self-sufficiency in the production of cereals, and especially wheat, which were in force in many European countries after the mid 1920s.
Wheat production developed from the mid nineteenth century onwards, its international trade increasing in a market which became profoundly integrated. Europe was the principal importing and exporting region prior to the First World War, but the rise of overseas exporters ended its dominant position in the market, and brought the sharp fall of intra-European trade. The wheat market also faced enormous tensions from approximately 1928 onwards, which the crisis of 1929 and the protectionist policies adopted complicated even further. Excess supply in the market, as a consequence of the strong growth in production beyond Europe and stagnant demand, affected international wheat prices and trade. Obstacles to trade in the 1930s, protectionism in Europe, and the policies of self-sufficiency followed by countries such as France, Germany, Italy, and Spain accentuated the problem, but further efforts to reach international agreements with the objective of stabilizing the market were unsuccessful. In consequence, prices fell significantly in the 1930s, especially affecting farmers in the main exporting countries. By contrast, the international trade in maize and rice, initially less significant in the cereals trade, became more dynamic in the 1920s and 1930s, because of their use as animal feed in Europe in the case of maize, and the extension of intra-Asian trade in the case of rice.
Gema Aparicio in an independent researcher. She holds an MA in economic history from the London School of Economics and a PhD in economics from the University of Zaragoza. Her research interests lies in international trade in agricultural products between 1900 and 1938.
Vicente Pinilla is Professor of Economic History at the University of Zaragoza. His research interests lies in international trade in agricultural products, long-term agricultural changes, environmental history, and migration. He is the editor, with Kym Anderson, of Wine globalization: a new comparative history (Cambridge University Press, 2018).


