Introduction
Lichens often accumulate large quantities of so-called lichen substances, secondary metabolites produced by the fungal partner with a number of adaptive functions (Lawrey Reference Lawrey1986). Lichen substances are deposited outside the fungal cells as crystals (Honegger Reference Honegger1991) and so far more than 800 compounds have been identified (Huneck Reference Huneck2001). The ecophysiological role of lichen substances has frequently been investigated by the comparison of pristine/intact thalli with others artificially deprived of lichen substances. The most effective technique for the removal of lichen substances was originally proposed by Solhaug & Gauslaa (Reference Solhaug and Gauslaa1996) and consists of washing dry thalli (residual water content <3%) in pure acetone several times for a period of minutes to hours. Most lichens can survive this treatment without apparent damage and, if reintroduced to their original habitat, can recover normal growth, also resynthesizing their pools of lichen substances (Solhaug & Gauslaa Reference Solhaug and Gauslaa2004). By using the protocol of Solhaug & Gauslaa (Reference Solhaug and Gauslaa2001), it was possible to demonstrate that some lichen substances (1) function as screens for ultraviolet (UV) and blue light (Solhaug & Gauslaa Reference Solhaug and Gauslaa1996; Solhaug et al. Reference Solhaug, Gauslaa, Nybakken and Bilger2003), (2) deter various lichenivorous insects, gastropods and mammals (Gauslaa Reference Gauslaa2005; Pöykkö et al. Reference Pöykkö, Hyvärinen and Bačkor2005; Asplund & Gauslaa, Reference Asplund and Gauslaa2008; Nybakken et al. Reference Nybakken, Helmersen, Gauslaa and Selås2010), and in some cases (3) act as antibiotics and antimycotics (Ingólfsdóttir et al. Reference Ingólfsdóttir, Chung, Skúlason, Gissurarson and Vilhelmsdóttir1998; Lawrey Reference Lawrey1986, Reference Lawrey2009).
Solvents less polar than acetone are less efficient at extracting lichen substances, whereas more polar solvents are detrimental to the photosynthetic apparatus (Solhaug & Gauslaa Reference Solhaug and Gauslaa2001). Depending on the species and the extraction time, acetone can also affect chlorophyll a fluorescence (Chl a F) emission levels and derived parameters (Solhaug & Gauslaa Reference Solhaug and Gauslaa2001), suggesting that the treatment might have some negative effects on the photosynthetic apparatus. This was tested on lichens with different photobiont species: lichens associated with Trebouxia are the most tolerant whereas those with Nostoc, Coccomyxa and Dictyochloropsis are the most susceptible. For this reason, Trebouxia-hosting lichens were suggested as the best model species to study the biological role of lichen substances (Solhaug & Gauslaa Reference Solhaug and Gauslaa2001). Even the most tolerant species, however, lose viability after more than 250 hours of extraction. This means that there is an accumulation of damage over time which becomes lethal after a certain threshold. The cellular components affected by this process remain unknown. According to Asplund et al. (Reference Asplund, Bokhorst and Wardle2013) and Asplund & Wardle (Reference Asplund and Wardle2013), pure acetone does not cross the cytoplasmic membranes when the cells are completely dehydrated. However, acetone is a strong dehydrating agent which could further remove the small amount of water still remaining in air- or silica-dried thalli. Our hypothesis is that acetone might cause damage to the membrane phospholipid bilayer. Considering the frequent application of acetone washings for the in vivo study of the role of lichen substances, we investigate here whether or not this technique has a negative effect on the membranes of three foliose lichens commonly used in ecophysiological and biomonitoring studies.
Materials and Methods
Lichen collection and pretreatment
Thalli of Flavoparmelia caperata (L.) Hale and Parmotrema perlatum (Huds.) M. Choisy were collected from ash (Fraxinus ornus L.) and sessile oak (Quercus petraea (Matt.) Liebl.) respectively, in the Classical Karst (Trieste, NE Italy) and thalli of Xanthoria parietina (L.) Th. Fr. were collected from sycamore (Acer pseudoplatanus L.) in the Friulian plain (Latisana, NE Italy). Thalli from the northern exposed tree bark were detached using a sharp blade, placed in open Petri dishes and immediately transported to the laboratory where they were left to dry at room temperature for 24 h. Thereafter, the lichen material was carefully cleaned of debris and bryophytes, placed in a desiccator with silica gel for two days and then sealed in vacuum bags and stored at −20°C. When needed, lichens were thawed for 24 h in a desiccator filled with silica gel to avoid rewetting from condensation. The experimental samples consisted of lichen lobes of c. 2 cm diameter and a mass of 50 mg dry weight (DW), excised from the margins of the thalli, randomly selected and kept over silica until use.
Experimental design
Two experiments were performed on the three lichen species to verify the effect of acetone washings on photosystem II efficiency using Chl a F measurements (experiment A), and on membrane integrity by measuring potassium (K+) leakage (experiment B). Samples of F. caperata from B were also characterized for their photosynthetic pigment content and the peroxidation level of their membrane lipids.
Experiment A
Two sets of silica-dried samples (n=6) for each species were used: one set (AW) was subjected to sequential acetone washings to remove the lichen substances, then kept overnight together with the second, non-washed set (NW) in a running fume-hood to ensure the complete evaporation of acetone. Thereafter, both sets were rehydrated in distilled water (dH2O) for 3 minutes, patted with absorbent paper to remove excess water and incubated for 48 h at 20°C under dim light (20 µmol photons m−2 s−1) with a photoperiod of 14/10 h of light/dark. Samples were kept moist by watering in the morning and evening with dH2O for 3 minutes. Measurements of Chl a F were taken on both sets immediately after the initial rehydration (NW-, AW-Pre) and after a 48 h recovery (NW-, AW-Rec).
Experiment B
Initially, samples were rehydrated for 48 h by equilibration above dH2O (c. 98% relative humidity (RH)) inside sealed transparent glass jars, at 20°C under dim light (20 µmol photons m−2 s−1) with a photoperiod of 14/10 h of light/dark. Thereafter, samples were subjected to three ×3 min sequential washings in distilled water to remove the particulate matter from the external surfaces. Samples were then patted with absorbent paper, air dried for 24 h on the laboratory bench and then kept for a further 48 h above silica in a desiccator (c. 5% RH). Silica-dried samples were subjected to sequential acetone washings followed by evaporation of the acetone as described for experiment A. Finally, the samples were rehydrated for 48 h in the same manner as the initial rehydration and then air dried for 24 h on the laboratory bench with a further 48 h above silica gel in a desiccator. Three independent sets of samples (n=7) per species were taken for the K+ leakage measurements after (1) the initial rehydration period (non-washed, NW), (2) the night long dehydration following the acetone treatment (acetone-washed, AW), and (3) the final rehydration-dehydration cycle (REC). For comparison with experiment A, Chl a F measurements were taken on NW and REC samples. Samples for the assessment of K+ leakage were kept over silica until analysis whereas those of F. caperata for lipid peroxidation and photosynthetic pigment analyses were frozen in liquid nitrogen, freeze-dried and stored at −80°C until needed.
Acetone washing
Acetone washings were performed according to Solhaug & Gauslaa (Reference Solhaug and Gauslaa2001), with slight modifications, at 25–30°C and 45% RH. Silica-dried samples were covered with 4 ml of pure acetone (purity≥99·5%; Sigma-Aldrich, St. Louis, MO, USA) in glass test tubes, kept in the dark on a shaking desk for 4 min. The acetone was then discarded and replaced with fresh solvent. Acetone used in this procedure was kept in sealed bottles with a maximum shelf-life of 4 days to avoid the combined detrimental effect on the lichens of acetone and contaminant water. To verify the presence of the extracted lichen substances in the solvent, a drop of KOH solution was added to a sample of the discarded acetone every three washings and the colour shift due to the presence of lichen substances was visually evaluated. After 13 washings, it was not possible to observe any change in colour. For this reason, the presence of lichen substances was evaluated spectrophotometrically with a Jenway 7315 spectrophotometer (Bibby Scientific, Stone, UK) in all the acetone samples using a 1 ml aliquot derived from AW samples (n=3) with readings at 200–800 nm. The presence of residual lichen substances was further investigated in AW F. caperata samples (n=3) by TLC. Dry, chopped material (30 mg) was mixed with 0·5 ml of pure acetone for 10 minutes, and a parallel set of samples was also disrupted in the acetone with a General Purpose Mixer (VWR, USA). The TLC analysis was then conducted according to Culberson (Reference Culberson1972) with the three solvent systems A, B and C.
Chlorophyll a fluorescence
Chl a F measurements were carried out on samples which had been dark-adapted for 30 min using a Hansatech Handy PEA chlorophyll fluorimeter (Hansatech Instruments Ltd, King’s Lynn, UK). The standard clip was positioned on the upper surface of marginal parts of the lobes because these portions have considerably higher Chl a F emissions than the central ones (Tretiach et al. Reference Tretiach, Piccotto and Baruffo2007). A saturating red light pulse of 1500 μmol photons m−2 s−1 for 1 s was applied to obtain the Kautsky induction and thus F m (transient maximum Chl a F level). F 0 (minimal Chl a F level), which is needed to calculate F v (variable Chl a F level, i.e. F m−F 0) and thus F v/F m (maximum quantum efficiency of PSII photochemistry), was calculated a posteriori by an algorithm that determines a line of best fit through the data points recorded immediately after the start of illumination.
Potassium leakage
To measure K+ leakage, samples were placed in test tubes together with 25 ml of dH2O and placed on a shaking desk for 60 min. Samples were then removed from the tubes and the water stored at 4°C for the analyses. Tubes with dH2O only were used as blanks. Potassium content was determined by Inductively Coupled Plasma-Atomic Emission Spectrometry (ICP-AES) using a Spectroflame Modula E optical plasma interface (OPI) instrument (SPECTRO, Kleve, Germany). Potassium concentration was calculated on the basis of a calibration curve obtained by dilution (range: 0–10 mg l−1) of a Spectrascan® potassium standard solution for ICP-AES analyses (Teknolab A/S, Drøbak, Norway). The limit of detection (LOD) at the operative wavelength of 766·491 nm was 0·02 mg l−1. The precision of the measurements as relative standard deviation (RSD%) for the analysis was always less than 5%. The lichen samples used for this analysis were oven-dried at 80°C for 24 h to obtain the respective DW needed to calculate their water content.
Malondialdehyde (MDA) assay
Lipid peroxidation of F. caperata samples was determined by the thiobarbituric acid reactive substances (TBARS) assay, according to Heath & Packer (Reference Heath and Packer1968). Malondialdehyde (MDA) is formed through auto-oxidation and enzymatic degradation of polyunsaturated fatty acids in membranes and reacts with two molecules of thiobarbituric acid (TCA) via an acid-catalyzed nucleophilic addition forming an orange compound with a maximum absorbance at 532 nm. Lyophilized samples (200 mg) were ground in liquid nitrogen, homogenized in a mortar using 1·5 ml of 0·1% TCA and centrifuged at 12000g for 20 min at room temperature. The supernatant was collected and 0·5 ml were mixed with 1 ml of 20% TCA with 0·5% thiobarbituric acid (TBA). The mixture was heated at 95°C for 25 min, quickly cooled in an ice bath and centrifuged at 15000g for 10 min at room temperature. The supernatant was removed and used to determine MDA concentration. Absorbance readings were taken at 532 nm using a UV-vis spectrophotometer (model 6505, Jenway, Stone, UK) and corrected for nonspecific turbidity by subtracting the absorbance at 600 nm. To correct the data for possible interference with MDA-sugar complexes, also absorbing at 532 nm, an aliquot of the extract was incubated without TBA and the absorbance at 532 nm was subtracted from the value of the TBA-treated sample. The amount of MDA was calculated by using a molar extinction coefficient of 155 mM−1 cm−1 and the results expressed as µmol g−1 (DW).
Photosynthetic pigment analysis
Photosynthetic pigments of F. caperata samples were determined by HPLC (P680 HPLC Pump, UVD170U UV-Vis detector, Dionex, Weiterstadt, Germany) according to a modified version of Pfeifhofer et al. (Reference Pfeifhofer, Willfurth, Zorn and Kranner2002). Samples of 50 mg of lyophilized material were homogenized in 1 ml of 100% dimethyl sulfoxide adding 0·1% of N,N-diisopropylethylamine, 1% of polyvinylpolypyrrolidone and 25 mg CaCO3. The mixture was incubated overnight at room temperature in the dark. Thereafter, samples were centrifuged at 15000×g for 10 min at room temperature and the supernatant was filtered through 0·2 μm Minisart SRT 15 aseptic filters (Sartorious, Göttingen, Germany) and immediately analyzed at 30°C with a reverse-phase Dionex column (Acclaim 120, C18, 5 μm particle size, 4·6 mm internal diameter×150 mm length). The pigments were eluted at a flow rate of 1 ml min−1 using 100% solvent A (acetonitrile/methanol, 75/25, v/v) for the first 14 min to determine xanthophylls and lutein, followed by a 3 min linear gradient to 100% solvent B (methanol/ethylacetate, 68/32, v/v), and 15 min with 100% solvent B for the elution of chlorophyll a, b and β-carotene. The pigments were detected at 445 nm. Authentic standards (from Sigma, Milan, Italy) were used to quantify the pigment content of each sample.
Statistical analysis
All calculations were performed with Microsoft Excel 2003 SP3 (Microsoft Co., Redmond, WA, USA) and STATISTICA 8.0 (StatSoft Inc., Tulsa, OK, USA). The non-parametric Mann-Whitney U and Wilcoxson paired tests were used to determine differences between Chl a F measurements in experiments A and B as suggested by Lazár & Nauš (Reference Lazár and Nauš1998) and Baruffo & Tretiach (Reference Baruffo and Tretiach2007). A Shapiro-Wilk test was used to check the normality of distribution for K+ leakage, lipid peroxidation and photosynthetic pigment measurements. A one-way ANOVA was performed to verify differences amongst the NW, AW, and AW-REC sets of samples within the same species, followed by a Fisher’s post-hoc test for direct comparisons between groups.
Results
Acetone washing
The absorbance spectra of the acetone from the first washing have absorbance peaks in the range 320–380 nm for F. caperata and P. perlatum, and between 400–500 nm for X. parietina (Fig. 1A–C). These peaks were not detected after the 13th washing of P. perlatum and X. parietina (Fig. 1B & C) but a small peak was still detectable for F. caperata (Fig. 1A). The TLC analyses confirmed the presence of usnic acid in one out of three samples of F. caperata that were disrupted in acetone (data not shown).
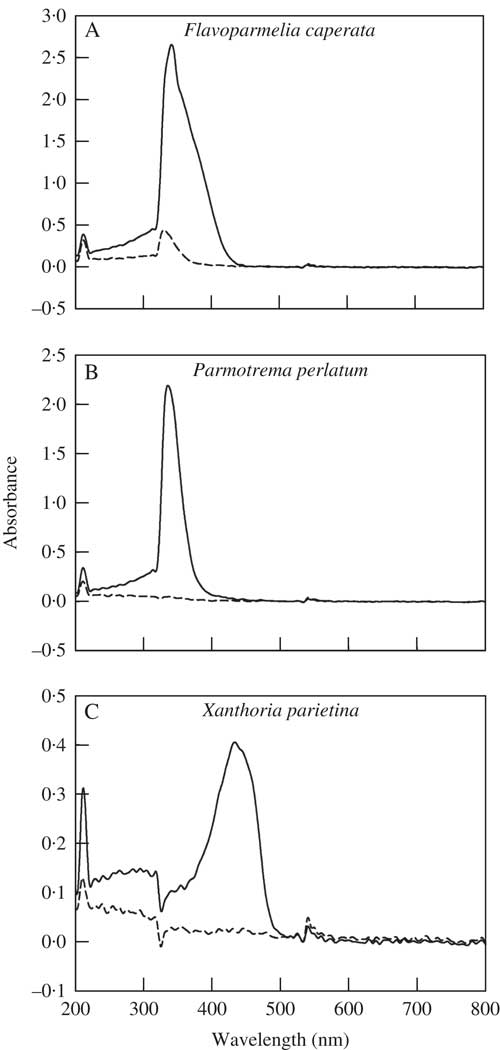
Fig. 1 Absorbance spectra of the acetone samples taken from 1st (solid line) and 13th (dashed line) washings of the lichens Flavoparmelia caperata, Parmotrema perlatum and Xanthoria parietina. Each absorption spectrum is the mean response of three replicate samples.
Chlorophyll a fluorescence
F v/F m of the non-washed (NW) samples of F. caperata, P. perlatum and X. parietina were 0·635±0·033, 0·679±0·034 and 0·688±0·051, respectively (Fig. 2). These values increased significantly in all the species after 48 h of rehydration at suboptimal conditions (Fig. 2), indicating that the thalli were healthy throughout the experiment. The acetone-washed (AW) samples had a significantly lower F v /F m only in F. caperata, with a decrease of 20% (P=0·008) as compared to non-washed (NW) samples (Fig. 2). After 48 h of recovery (Rec), F v/F m increased in all species (Fig. 2), but in F. caperata a small (c. 5%) difference between AW and NW samples still remained (P=0·002).
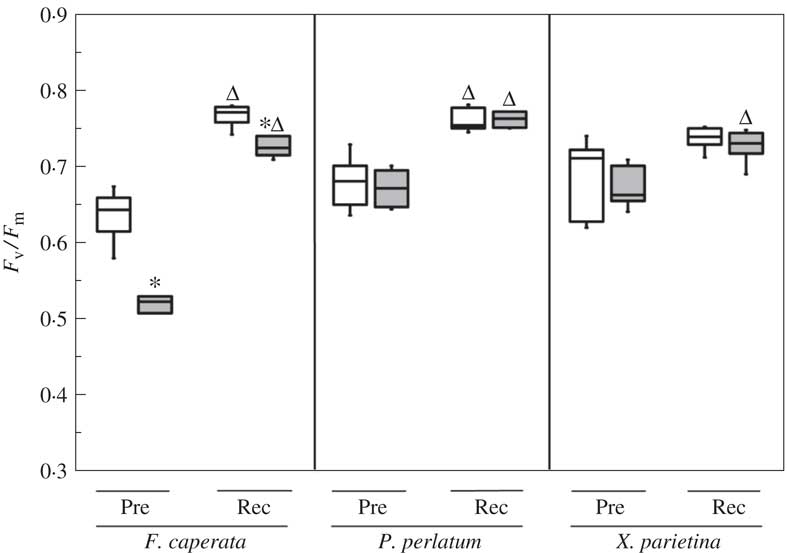
Fig. 2 Maximum quantum yield of PSII (F v/F m) of Flavoparmelia caperata, Parmotrema perlatum and Xanthoria parietina in non-washed (NW; open boxes) and acetone-washed (AW; grey boxes) samples before (Pre) and after a recovery period of 48 h (Rec). Boxplots show median, 25th and 75th percentiles together with outliers. *=significant differences between NW and AW samples; Δ=significant differences between NW or AW and the corresponding Rec samples; P<0·05, n=6 (Mann Whitney U and Wilcoxon test for pairwise comparisons).
In the Chl a F measurements conducted in experiment B, F v/F m values of NW samples were comparable to those measured in the NW-REC samples from experiment A, confirming that the samples were healthy (see Supplementary Material Fig. S1, available online). The acetone-washed samples of F. caperata had lower F v/F m values (−9%, P=0·002) than the non-washed samples, whereas no differences were observed between the two sets of samples of P. perlatum and X. parietina.
Potassium leakage
Potassium leakage in NW samples ranged from 0·228±0·049 mgg−1 DW in F. caperata to 0·397±0·172 in X. parietina (Fig. 3). In AW samples, K+ leakage was 3·9–6·6 times higher (Fig. 3). After 48 h of recovery, K+ leakage in F. caperata remained stable, whereas it decreased to 4·6 times the NW value in X. parietina, and to the NW value in P. perlatum (Fig. 3, P<0·001).
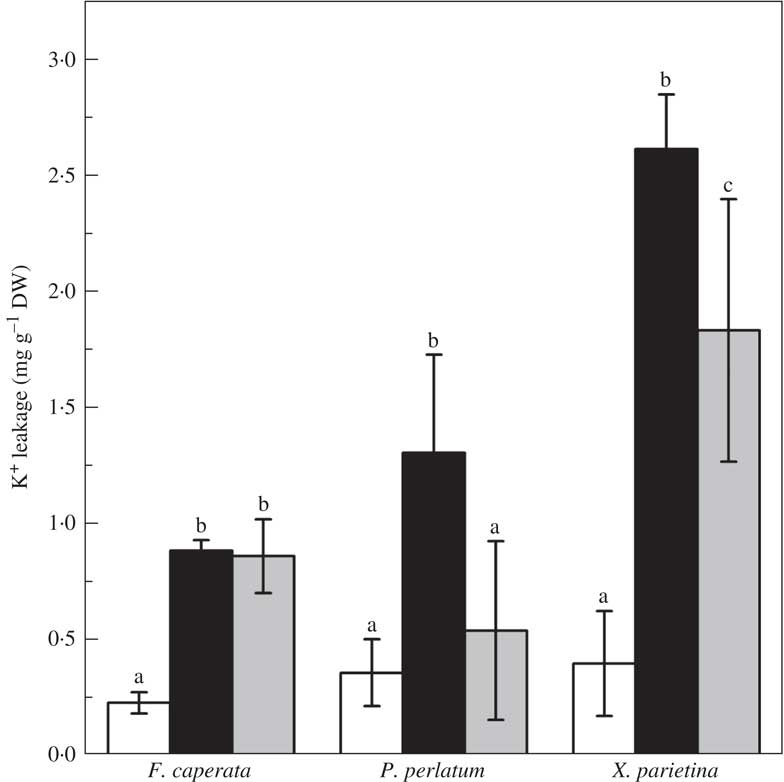
Fig. 3 Potassium (K+) leakage from Flavoparmelia caperata Parmotrema perlatum and Xanthoria parietina in non-washed (NW; open bars), acetone-washed (AW, black bars), and in acetone-washed samples after a recovery period of 48 h (AW-REC; grey bars). Values are mean±1SD. Within each species, bars assigned the same letter are not significantly different at P<0·05, n=7 (one-way ANOVA, Fisher’s post-hoc test).
Lipid peroxidation and photosynthetic pigments in F. caperata
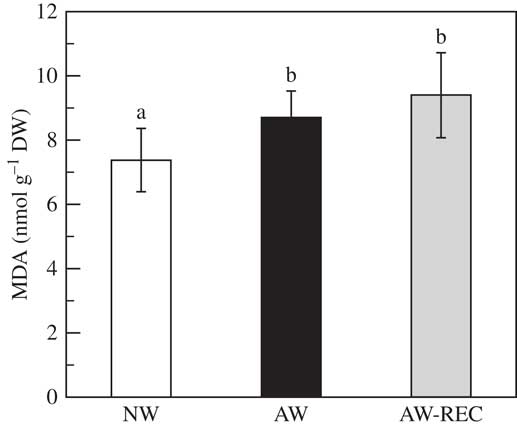
Malondialdehyde content (Fig. 4) significantly increased by 17% in AW samples compared to NW (P<0·001). This increase was maintained after 48 h of recovery.

Fig. 4 Malondialdehyde content (MDA) in Flavoparmelia caperata samples before acetone washing (NW open bars), after acetone washing (AW black bars) and after a recovery period of 48 h at 20 µmol photons m−2 s−1, photoperiod 14/10 h of light/dark and 98% relative humidity subsequent to the acetone washings (AW-REC grey bars). Values are mean±1SD. Bars assigned the same letter are not significantly different at the P<0·05, n=7 (one-way ANOVA, Fisher’s post-hoc test).
The concentration of photosynthetic pigments and carotenoids (Table 1) was relatively constant throughout the experiment with the exception of neoxanthin which slightly increased in AW samples (P<0·01), remaining stable after 48 h of recovery.
Table 1 Concentration of photosynthetic pigments and carotenoids (nmol g−1 DW) in Flavoparmelia caperata in non-washed (NW), acetone-washed (AW) and acetone-washed samples after a recovery period of 48 h (AW-REC, see Materials and Methods section). Values are mean±1SD (n=6). In each column, different letters indicate significant differences (one-way ANOVA, Fisher’s post-hoc test) for P<0·05
Chla=Chlorophyll a; Chlb=Chlorophyll b; β-car=β-carotene; A=Antheraxanthin; L=Lutein; N=Neoxanthin; V=Violaxanthin; Z=Zeaxanthin.
Discussion
In the last 20 years, many studies on the ecophysiological role of lichen substances relied on the acetone washing technique applied to dry lichens (Solhaug & Gauslaa Reference Solhaug and Gauslaa2001). So far, the effects of acetone have been tested by measuring Chl a F emission and oxygen evolution (Solhaug & Gauslaa Reference Solhaug and Gauslaa1996, Reference Solhaug and Gauslaa2001), CO2 gas exchange (Lange et al. Reference Lange, Green, Reichenberger, Hesbacher and Proksch1997) and growth rates (Asplund & Gauslaa Reference Asplund and Gauslaa2008; Larsson et al. Reference Larsson, Večeřová, Cempírková, Solhaug and Gauslaa2009). In all cases, it was shown that acetone had little or no effect on these processes.
For histochemical applications and/or biochemical assays, it is important to know the physiological status of the whole thallus including the mycobiont. For example, membrane integrity is of paramount importance when applying intracellular dyes or probes for the staining of target molecules or in experiments involving biochemical analyses (enzymatic activities, metabolite determination and quantification, etc.). In both cases, a more permeable membrane could introduce an unpredictable bias due to leakage of the target molecules and/or metabolites of interest.
Here, acetone washings affected the PSII activity only in F. caperata, which was not able to fully recover even after 48h in suboptimal conditions. Species-specific susceptibility to acetone measured by Chl a F has been reported, especially among groups of species with different photobionts (Solhaug & Gauslaa Reference Solhaug and Gauslaa2001). In the current investigation we used lichen species which host members of the genus Trebouxia, the most acetone-resistant photobiont tested so far (Solhaug & Gauslaa Reference Solhaug and Gauslaa2001). What is certain is that the PSII impairment observed in F. caperata after just 52min of submersion in acetone is a poor performance in comparison to, for example, X. parietina, which in the worst case resisted more than 10h without apparent damage (Solhaug & Gauslaa Reference Solhaug and Gauslaa2001).
Lichens, depending on the water availability of the microhabitat they colonize, lose different quantities of K+ into the extracellular space (Buck & Brown Reference Buck and Brown1979). Accordingly, some release of extracellular K+ was observed in all NW samples, which was consistent among the three species. The same has been observed in mosses and specific indices of desiccation tolerance/sensitivity have been developed which relate to K+ leakage (Brown & Buck Reference Brown and Buck1979; Buck & Brown Reference Buck and Brown1979). However, the K+ leaked from the acetone-washed (AW) samples is only partly due to desiccation, because there were further increases in K+ leakage after the acetone washings (e.g. 6·6 times the NW value in X. parietina) which did not recover in F. caperata and only partially recovered in X. parietina. Increased membrane permeability is an effect fully compatible with the chemical properties of acetone that make it a useful solvent for several applications in immunochemistry and microscopy. For instance, it is used in preparing samples for immunocytochemical analyses to make membranes permeable to antibodies (Jamur & Oliver Reference Jamur and Oliver2010). However, in this case the treatment with acetone is applied to hydrated samples (e.g. with PBS, phosphate buffer saline), thus the effect on membrane permeablility depends on the presence of water. In contrast, the samples here had a maximum water content of 3·2±0·7% during the acetone washings. Minor rehydration from condensation due to cooling by acetone evaporating is unlikely given the conditions during the experiments (i.e. the dew point was 10–15°C lower than the laboratory temperature). The extreme dehydration caused by repeated acetone washings could increase membrane folding, which in the most severe cases promotes the fusion of folded membranes by the interaction of polar heads (Gasulla et al. Reference Gasulla, vom Dorp, Dombrink, Zahringer, Gisch, Dörmann and Bartels2013, Reference Gasulla, Barreno, Parages, Cámara, Jiménez, Dörmann and Bartels2016). In the dehydrated state the lichen is also more prone to suffer from oxidative processes (Kranner et al. Reference Kranner, Cram, Zorn, Yoshimura, Stabentheiner and Pfeifhofer2005, Reference Kranner, Beckett, Hochman and Nash2008). Acetone increased peroxidation of membrane lipids in F. caperata after the washings, and this peroxidation was maintained throughout the recovery period. However, it must be pointed out that the damage did not affect the concentration of photosynthetic and accessory pigments, indicating that the treatment was not detrimental to the photobiont population. This result agrees well with the findings of Larsson et al. (Reference Larsson, Večeřová, Cempírková, Solhaug and Gauslaa2009). They found that growth rates (GR) of acetone-rinsed and control thalli were broadly similar suggesting minimal long-term detrimental effects of acetone washing. However, GR has the drawback of requiring a relatively long time to obtain reliable measurements, perhaps many weeks of almost continuous active metabolic activity (Bidussi et al. Reference Bidussi, Gauslaa and Solhaug2013). This longer time span means that it is possible that subtle damage, such as that reported in this work, might be repaired by the organism and thus be overlooked.
Taken together, the results of Chl a F measurements and K+ leakage show that F. caperata was most affected by acetone washings. Flavoparmelia caperata accumulates relatively high concentrations of up to 6% of DW of atranorin, caperatic, protocetraric and usnic acids (Louwhoff Reference Louwhoff2009). Thirteen acetone washings were not able to completely remove usnic acid. The absorbance spectra of the acetone used for the washings, together with the results of the TLC analysis, demonstrate that very small quantities of usnic acid were still present in some AW samples. It is possible that during acetone washing usnic acid might have entered the cells, becoming toxic upon rehydration. The detrimental effects of exogenous usnic acid on Trebouxia growth rates (Bačkor et al. Reference Bačkor, Hudàk, Repčák, Ziegler and Bačkorova1998; Bud’ova et al. Reference Bud’ova, Bačkor, Bačkorová and Zidzik2006) and Chl a F (Bačkor et al. Reference Bačkor, Klemová, Bačkorová and Ivanova2010) have been established.
These results help to confirm that acetone washings for the removal of lichen substances are not detrimental to the viability of lichens with Trebouxia as main photobiont. However, they have also shown that acetone washing affects membrane integrity and, depending on the species, may take more than 48 h for recovery in suboptimal conditions. In view of this finding, we suggest verifying in advance (1) the effect of acetone washings on membrane integrity, especially when an intact membrane is a fundamental requirement, and (2) the time needed by the target species to fully recover membrane integrity.
The study was funded by the Italian Ministry of Education, University and Research under the PRIN 2010-11 project “TreeCity – Planning the green city in the global change era: urban tree functions and suitability for predicted future climates” (GL: national resp., MT: local resp.). The activity of FCC was partly funded by a DIANET post-doc outgoing fellowship grant. We thank Drs Danijela Kodnik, Elva Cecconi, Lorenzo Fortuna and Teresa Craighero for practical help in the laboratory. FCC thanks Prof. Ilse Kranner for access to laboratory facilities.
Supplementary Material
For supplementary material accompanying this paper visit https://doi.org/10.1017/S0024282917000263