Introduction
A key requirement in studying evolutionary history is to have reliable chronologies of macroevolutionary processes such as the evolution of new clades (monophyletic groups) and traits (character states). Reliable chronologies enable us to study whether and how organismal traits and forms coevolve and whether and how macroevolutionary processes affect and are affected by environmental changes. Acquiring reliable chronologies and correctly interpreting them requires reliable dating methods and good understanding of what component of the macroevolutionary process is dated. Modern biostratigraphic, radiometric, and molecular techniques allow us to accurately date genes, proteins, fossils, and strata. Nevertheless, the paleontological and molecular records can provide considerably different chronologies (Fig. 1), with dates obtained from fossils tending to be younger than dates obtained from molecular techniques (e.g., Rodriguez-Trelles et al. Reference Rodriguez-Trelles, Tarrio and Ayala2002; Marjanovic and Laurin Reference Marjanovic and Laurin2007; Quental and Marshall Reference Quental and Marshall2010; Erwin et al. Reference Erwin, Laflamme, Tweedt, Sperling, Pisani and Peterson2011; Herendeen et al. Reference Herendeen, Friis, Pedersen and Crane2017). This difference stems from some principal and technical differences between paleontological dating and molecular dating (see following section), which means that scholars from the two schools do not always date the same components of the macroevolutionary process (Fig. 2).

Figure 1. Complex macroevolutionary processes may be viewed differently by paleontologists and phylogeneticists, neither of whom is able to see the full true picture. In this example, paleobiological reality (A) consists of two major clades. One includes sibling extant (1) and extinct (2) clades. The second diverged early into two clades (3 and 4) that cannot be distinguished morphologically (i.e., are paleontologically cryptic) but are genetically separate (e.g., have distinctly different organellar DNA sequences), with clade 4 more recently acquiring apomorphies and shifted into a distinctive clade 5. A paleontologist with a full fossil record (B) will not be able to distinguish 4 as a clade separate from 3, and will conclude that clade 5 recently diverged from clade 3. A molecular phylogeneticist with access to extant species only (C) will construct a phylogenetic tree consisting of clades 1, 3, and 5, but will suggest that clades 3 and 5 separated a long time ago. Bold lines denote available fossils (B) and molecular data (C).
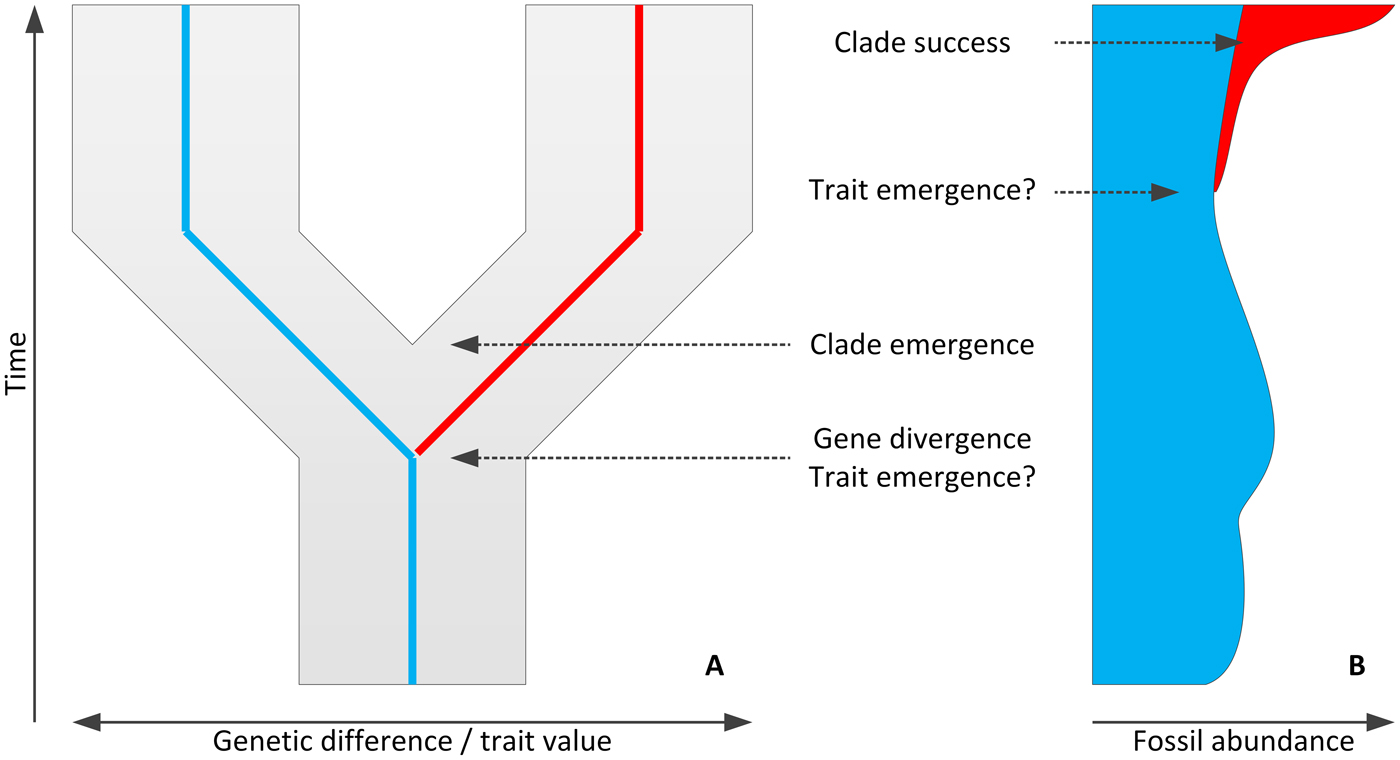
Figure 2. Molecular (A) and fossil (B) chronologies provide information on different phenomena of a macroevolutionary change (here, divergence of a dark/red trait clade form from a pale/blue one) or provide different evidence for these events, often resulting in disparities among gene, trait, and clade divergence times and between emergence and success.
It is therefore important to first understand what is actually dated (e.g., Nichols Reference Nichols2001; Pulquerio and Nichols Reference Pulquerio and Nichols2007; Jablonski Reference Jablonski2008a; Pennell et al. Reference Pennell, Harmon and Uyeda2014; Herendeen et al. Reference Herendeen, Friis, Pedersen and Crane2017). Each macroevolutionary process is inherently composed of two main phases: emergence of a trait or clade (divergence of a derived form from an ancestral one) and success (a trait or clade becoming quantitatively significant). While emergence usually takes place in lower organizational levels and at small temporal and spatial scales (genes to communities, days to millions of years, local to regional), success usually reflects larger scales (communities to ecosphere, decades to hundreds of millions of years, local to global) (Table 1). The study of macroevolutionary processes therefore requires an understanding of what component of the macroevolutionary process is dated and how the dates of these components can complement each other to reveal the more complete, complex, and real story. Here, I describe the variation among date types and how different dates may refer to different components of the macroevolutionary process, and how being aware of these differences allows us to better understand macroevolutionary processes and events.
Table 1. The three main components of success differ in the main factors that can enhance them and in the types of fossil and molecular information that can be used to identify and date them. Key to taxonomic levels at which each any factor or dating method is relevant: I, individual; S, species; H, above species.
Sources of Chronological Information
Fossils of all kinds are the most tangible evidence for past organisms’ existence and attributes and are therefore considered by many to be the least disputed sources of paleobiological information (e.g., Herendeen et al. Reference Herendeen, Friis, Pedersen and Crane2017). Nonetheless, the fossil record is neither complete nor unbiased. Fossil morphologies and anatomies are open to subjective interpretations to some degree, which may result in dubious assignment of fossils to clades (e.g., Rutschmann et al. Reference Rutschmann, Eriksson, Schönenberger and Conti2004; Forest Reference Forest2009; Sansom Reference Sansom2015; Baron et al. Reference Baron, Norman and Barrett2017). Morphometric methods (e.g., Roth-Nebelsick et al. Reference Roth-Nebelsick, Grimm, Mosburger, Hass and Kerp2000; Hughes and Chapman Reference Hughes, Chapman, Adrian, Edgecomb and Lieberman2001; Goswami et al. Reference Goswami, Milne and Wroe2010) and multiple-trait phylogenetic analyses (e.g., Hughes and Chapman Reference Hughes, Chapman, Adrian, Edgecomb and Lieberman2001; Baron et al. Reference Baron, Norman and Barrett2017), for example, have been able to reduce such biases but not to resolve them altogether. Moreover, the fossil record suffers from inherent incompleteness and representational biases due to uneven preservation, for which solutions are also being developed at appreciable rates (e.g., Crampton et al. Reference Crampton, Beu, Cooper, Jones, Marshall and Maxwell2003; Crepet et al. Reference Crepet, Nixon and Gandolfo2004; Forest Reference Forest2009; Sansom et al. Reference Sansom, Gabbott and Purnell2010; Sansom Reference Sansom2015). Therefore, fossil dating can provide valuable information on the occurrence of clades and traits over geologic time, and fossils remain—and are likely to remain—the most reliable source of information about organismal traits; but fossils alone cannot always reliably attest to clade or trait abundance, diversity, and geographic distribution, nor can they always provide undisputed dates for trait or clade emergence (Magallon Reference Magallon2004; Erwin et al. Reference Erwin, Laflamme, Tweedt, Sperling, Pisani and Peterson2011; Fig. 2).
The use of molecular dating (i.e., molecular phylogenetic trees with molecular clocks) in addition to the fossil record is becoming increasingly common, although its reliability is still disputed, especially due to confidence intervals tending to be larger than for fossil dating (Rodriguez-Trelles et al. Reference Rodriguez-Trelles, Tarrio and Ayala2002; Graur and Martin Reference Graur and Martin2004; Hedges and Kumar Reference Hedges and Kumar2004; Pulquerio and Nichols Reference Pulquerio and Nichols2007; Ho and Phillips Reference Ho and Phillips2009; Parham et al. Reference Parham, Donoghue, Bell, Calway, Head, Holroyd, Inoue, Irmis, Joyce, Tsepka, Patane, Smith, Tarver, van Tuinen, Yang, Angielczyk, Greenwood, Hipsley, Jacobs, Makovicky, Müller, Smith, Theodor, Warnock and Benton2012). The main methodological shortcoming of molecular dating is the inability to extract molecular information from extinct species. Despite some methodological advances in extracting DNA and other organics from fossils (Woodward et al. Reference Woodward, Weyand and Bunnell1994; Li et al. Reference Li, Gao, Vinther, Shawkey, Clarke, D'Alba, Meng, Briggs and Prum2010), fossil preservation is rarely sufficient to provide molecular data of the quality required for phylogenetic analyses. Until recently, a common practice was to use noncoding, mitochondrial, and plastid DNA sequences—or genes that code organellar structures (e.g., ribosomal DNA)—over sequences that code specific proteins and traits, because the former have more consistent nucleotide substitution rates and are less affected by natural selection. However, nuclear DNA sequences tend to be more informative in deeper geologic time (e.g., Brower and DeSalle Reference Brower and DeSalle1998), and if they code traits of interest, they are more appropriate for understanding the evolutionary history of these traits (e.g., Xiong et al. Reference Xiong, Fischer, Inoue, Nakahara and Bauer2000; Trembath-Reichert et al. Reference Trembath-Reichert, Wilson, McGlynn and Fischer2015). It is therefore unsurprising that the choice of molecular data source is a matter of much debate and can substantially affect results and interpretations (Brower and DeSalle Reference Brower and DeSalle1998; Soltis and Soltis Reference Soltis, Soltis, Soltis, Soltis and Doyle1998; Heckman et al. Reference Heckman, Geiser, Eidell, Stauffer, Kardos and Hedges2001; Shaw Reference Shaw2002; Small et al. Reference Small, Cronn and Wendel2004; Sole-Cava and Wörheide Reference Sole-Cava, Wörheide, Custodio, Lobo-Hajdu, Hajdu and Muricy2007).
Regardless of the type of molecular data source and specific method, molecular dating requires reliable estimates of nucleotide substitution rates (Graur and Martin Reference Graur and Martin2004; Hedges and Kumar Reference Hedges and Kumar2004; Rutschmann Reference Rutschmann2006; Pulquerio and Nichols Reference Pulquerio and Nichols2007; Ho and Phillips Reference Ho and Phillips2009). This is usually achieved by calibrating the molecular phylogenetic tree with fossil evidence (Parham et al. Reference Parham, Donoghue, Bell, Calway, Head, Holroyd, Inoue, Irmis, Joyce, Tsepka, Patane, Smith, Tarver, van Tuinen, Yang, Angielczyk, Greenwood, Hipsley, Jacobs, Makovicky, Müller, Smith, Theodor, Warnock and Benton2012). This calibration can be done in two ways. More traditional node-dating approaches use the date of the oldest known fossil as a minimum age constraint on internal nodes among which the relationships are predefined (e.g., Magallon Reference Magallon2004; Rutschmann et al. Reference Rutschmann, Eriksson, Schönenberger and Conti2004; Hug and Roger Reference Hug and Roger2007; Marjanovic and Laurin Reference Marjanovic and Laurin2007; Gandolfo et al. Reference Gandolfo, Nixon and Crepet2008; Ho and Phillips Reference Ho and Phillips2009; Quental and Marshall Reference Quental and Marshall2010). However, the oldest fossils to bear a trait are almost never the remains of the first bearers of the trait and thus cannot directly attest to the time of gene or clade divergence (Magallon Reference Magallon2004). More recently, tip-dating approaches have been introduced, which simultaneously assign fossils to nodes and date node branching without pre-assuming the relationships among fossils (e.g., Pyron Reference Pyron2011; Bapst et al. Reference Bapst, Wright, Matzke and Lloyd2016). Others calibrate phylogenetic trees using tectonic events that explain vicariance (e.g., Rutschmann et al. Reference Rutschmann, Eriksson, Schönenberger and Conti2004; Ho and Phillips Reference Ho and Phillips2009), which comes with its own set of potential errors and risk of circular argumentation (Rutschmann et al. Reference Rutschmann, Eriksson, Schönenberger and Conti2004; Kodandaramaiah Reference Kodandaramaiah2011; De Baets et al. Reference De Baets, Antonelli and Donoghue2016).
Therefore, having reliable molecular clocks and molecular dates is in itself not an easy task, and the uncertainty around the reliability of molecular dating techniques is a major challenge for constructing correct chronologies, and there is (rightfully) much debate over how to construct evolutionary chronologies using paleontological and molecular dating techniques. In extreme cases, scholars may categorically dismiss dates that are retrieved from one type of method in favor of another (e.g., Herendeen et al. Reference Herendeen, Friis, Pedersen and Crane2017). In addition to these methodological challenges, I wish to bring forward another set of challenges in interpretation of chronologies. Eventually, even if we are able to resolve all methodological challenges and achieve near-perfect dating methods (from both fossil and molecular data), it is unlikely that fossil and molecular chronologies will be in full agreement, for the simple reason that different methods date different macroevolutionary events. In this paper, I explain and discuss the challenge of chronological discrepancies and how this challenge may be harnessed to improve our understanding of the macroevolutionary process.
Emergence: Genes, Traits, and Clades
Trait emergence begins with genetic or developmental changes within an individual organism or a small number of organisms and is therefore driven by intrinsic forces. Nevertheless, one cannot simply equate gene divergence times with trait emergence times (Fig. 2). First, genotypes do not always reflect phenotypes, due to phenotypic plasticity or genotype by environment interactions (Pigliucci Reference Pigliucci2005; Whitman and Agrawal Reference Whitman, Agrawal, Whitman and Ananthakrishnan2009). Phenotypic plasticity can also initiate trait shifts that are later canalized through genetic assimilation (Pigliucci et al. Reference Pigliucci, Murren and Schlichting2006). Conversely, some complex traits are composed of several interacting components (developmental, physiological, biochemical, etc.) that are coded by networks of polygenes, quantitative trait loci, or master genes (McKay Reference McKay2001). Because such complex traits truly emerge only when all their genotypic and phenotypic components are coordinated (cf. Donoghue Reference Donoghue2005), the prerequisites to take any gene divergence time as a trait emergence time are to construct the underlying genetic network and identify the genes whose changes are the critical turning points. These challenges are exacerbated as trait complexity and diversity increases and as its origins lie deeper in geologic time, as has been demonstrated by the limited success in the attempts to trace the evolutionary history of photosynthesis (Xiong et al. Reference Xiong, Fischer, Inoue, Nakahara and Bauer2000; Hohmann-Marriott and Blankenship Reference Hohmann-Marriott and Blankenship2011). Traits and clades should also not be equated, and thus neither should trait and clade phylogenetic trees and divergence times (Figs. 1 and 2). Trait trees differ from clade trees, because the former are constructed from specific trait-coding genes and the latter from whole genome sequences (e.g., Xiong et al. Reference Xiong, Fischer, Inoue, Nakahara and Bauer2000) or from noncoding, mitochondrial, and plastid sequences (e.g., Bowe et al. Reference Bowe, Coat and dePamphilis2000).
A key question is, therefore, what roles traits and trait emergence play in speciation, if any, and whether and how trait and clade divergence times can be used to understand macroevolutionary processes. To avoid an overly exhausting discussion that is outside the focus of this paper and is extensively present in the literature (e.g., Wiens Reference Wiens2004; Hansen and Orzack Reference Hansen and Orzack2005; Jablonski Reference Jablonski2008a; Schluter Reference Schluter2009; Butlin et al. Reference Butlin, Debelle, Kerth, Snook, Beukeboom, Castillo Cajas, Diao, Maan, Paolucci, Weissing, Van de Zande, Hoikkala, Geuverink, Jennings, Kankare, Knott, Tyukmaeva, Zoumadakis, Ritchie, Barker, Immonen, Kirkpatrick, Noor, Macias, Schmitt and Schilthuizen2012; Pennell et al. Reference Pennell, Harmon and Uyeda2014), I will briefly claim that trait variations and emergence of novel traits do not necessarily lead to speciation and that, conversely, speciation does not necessarily arise from trait variations. First, the roles of sexual and natural selection and of genetic drift in speciation are still an open question (Butlin et al. Reference Butlin, Debelle, Kerth, Snook, Beukeboom, Castillo Cajas, Diao, Maan, Paolucci, Weissing, Van de Zande, Hoikkala, Geuverink, Jennings, Kankare, Knott, Tyukmaeva, Zoumadakis, Ritchie, Barker, Immonen, Kirkpatrick, Noor, Macias, Schmitt and Schilthuizen2012). Second, trait variations are not always subjected to sexual or natural selection to a degree that can result in reproductive isolation. Third, that different traits or trait states imply different fitness is an assumption rather than a rule, and speciation is sometimes decoupled from adaptation and natural selection (e.g., Wiens Reference Wiens2004; Pennell et al. Reference Pennell, Harmon and Uyeda2014). Fourth, reproductive isolation can precede trait divergence, for example, in allopatric speciation, so one cannot simply assume that trait emergence precedes clade divergence or that chronological relationships between the two can provide clear patterns (Fig. 1; see also section on angiosperm origins below). Finally, speciation may be independent of trait change altogether, and may even be a result of phylogenetic niche conservatism that hinders species from maintaining reproductive connectivity following habitat fragmentation (Wiens Reference Wiens2004).
Therefore, gene trees and clade trees are also not the same, and hence neither are gene divergence times and clade divergence times (Edwards and Beerli Reference Edwards and Beerli2000; Nichols Reference Nichols2001; Wall Reference Wall2003; Fig. 2A). This disparity is not so much a result of complex interactions between genes and traits, as it is a result of disparity between traits and clades, as manifested in the multiple ways by which traits and speciation may be linked. Furthermore, molecular phylogenetics “skips over” traits to directly associate certain genes with clades (e.g., Fig. 1C). Put together, the complexities of gene–trait and trait–clade relationships result in “the threads connecting genes and selection [being] still few” (Schluter Reference Schluter2009) and the question of “speciation genes” remaining unresolved (Butlin et al. Reference Butlin, Debelle, Kerth, Snook, Beukeboom, Castillo Cajas, Diao, Maan, Paolucci, Weissing, Van de Zande, Hoikkala, Geuverink, Jennings, Kankare, Knott, Tyukmaeva, Zoumadakis, Ritchie, Barker, Immonen, Kirkpatrick, Noor, Macias, Schmitt and Schilthuizen2012). Therefore, one must ask oneself what is dated (genes, traits, or clades?), and how any one date should be inferred as a stand-alone and in conjunction with other dates.
What Is “Success” and How Can We Quantify It?
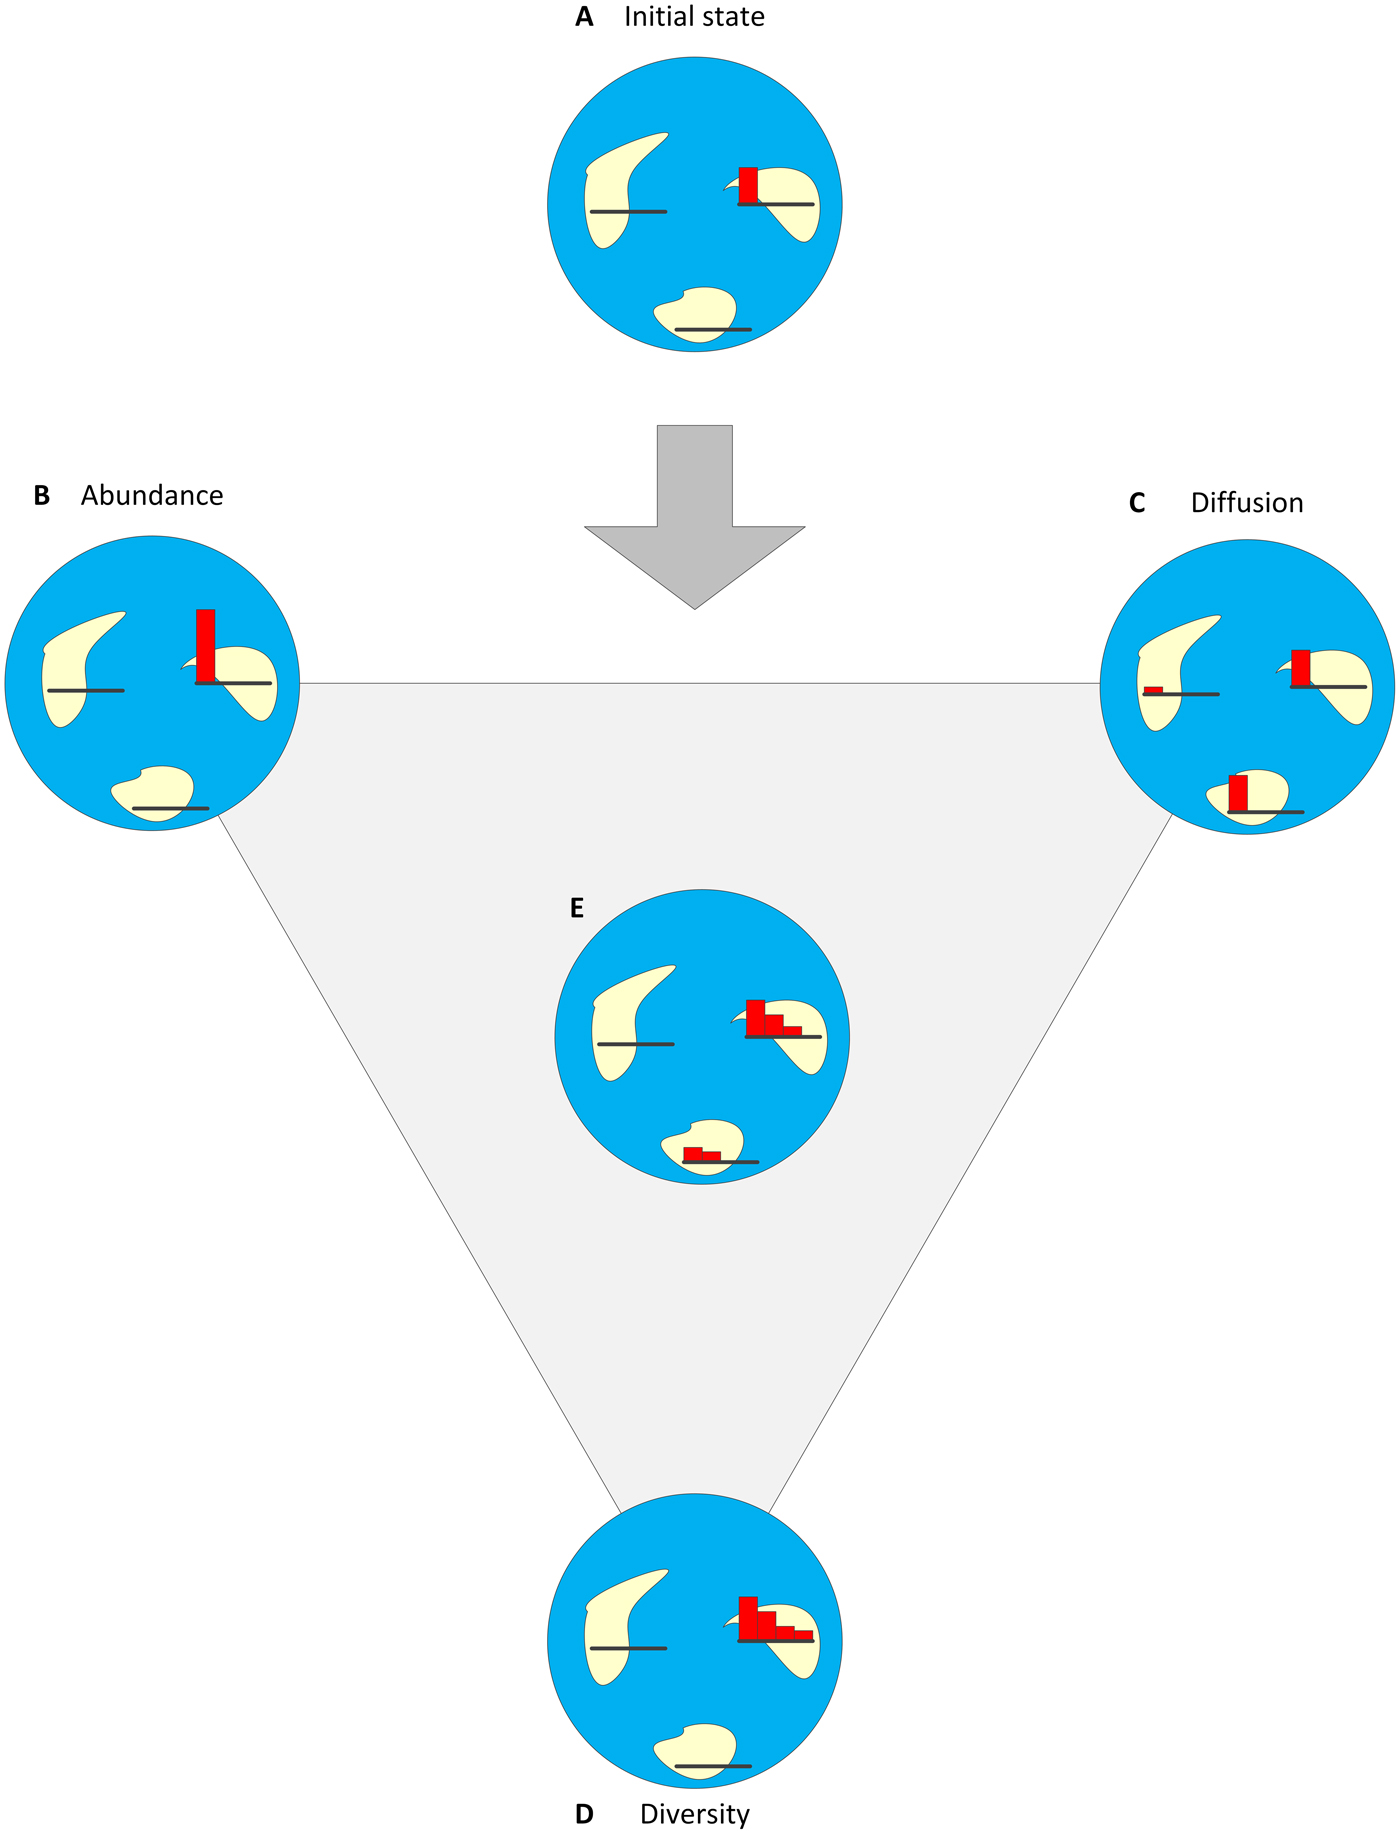
The term “success” appears to follow the descriptive form of “I know one when I see one,” an attribute shared with other terms like “key innovations” (Hunter Reference Hunter1998), “niches” (Godsoe Reference Godsoe2010), and “novelty” (Pigliucci Reference Pigliucci2008). Different scholars use and interpret the term “success” in various ways, and thus also translate it to operational terms differently. Success is usually used to denote that a trait or clade is abundant, dominant, geographically widespread, morphologically diverse, or persistent through geologic time (Wilson Reference Wilson1987; Hunter Reference Hunter1998; Poulin et al. Reference Poulin, Palma and Feral2002; Gheerbrandt and Rage Reference Gheerbrandt and Rage2006; Erwin et al. Reference Erwin, Laflamme, Tweedt, Sperling, Pisani and Peterson2011; Katz Reference Katz2015, Reference Katz2018). Following these past uses of the term, I suggest that three readily quantifiable criteria to determine the degree of success are abundance (number of individuals), diffusion (realized geographic range), and diversity (variance) (Fig. 3; Table 1). These three criteria are measurable at any discrete point or interval in geologic time, assuming that the fossil record for this point or interval is sufficiently complete and unbiased.

Figure 3. Success has three components and can be described as a combination of the degrees of abundance, diversity, and diffusion through geologic time. In this example, a trait/clade that emerged on one island and has reached a certain level of abundance (A) can become more successful if it becomes more abundant (B), diffused (C), diversified (D), or some combination of the three (E). For each island, a small histogram describes the abundances of up to four variants (species/phenotypes) from the clade.
To these three, I suggest adding Wilson's (Reference Wilson1987) criterion of persistence through geologic time, which is likely a strong outcome of the three. Persistence through geologic time is also potentially quantifiable by measuring the duration a clade existed through geologic time. However, devising a quantitative universal persistence index is hindered by several issues regarding the end date of a clade's existence. One challenge is how to treat mass extinctions that can nonselectively wipe out multiple clades, regardless of their success before the event (Lockwood Reference Lockwood2003). Another challenge is a bias with regard to extant clades: we simply do not have end dates for them, and thus older extant clades will seem more persistent than younger ones. Regarding these two challenges, it appears that the number of genera that persist more than 45 Myr is higher in more recent geologic time and less affected by mass extinctions (Rohde and Muller Reference Rohde and Muller2005; Jablonski Reference Jablonski2008b), which suggests further bias in using persistence over geologic time as a measure of success. Moreover, persistence through geologic time is cumulative, so unlike the other three criteria, for which we can potentially identify changes over time (e.g., an increase in diversification rate can be taken as the time of a clade becoming diverse), a clade does not become persistent at any point in time.
The four proposed criteria are often linked (Wilson Reference Wilson1987; Heard and Hauser Reference Heard and Hauser1995). Net diversification rate is calculated by subtracting extinction rate from diversification rate. However, because high abundance may reduce extinction probability, it can indirectly be positively linked with net diversification rate. Successful diffusion (i.e., establishment of a population) also depends on size (abundance). If diffusion leads to geographic isolation, genetic isolation, and speciation, it increases diversity. Finally, diffused and diverse clades have higher probabilities to persist through geologic time (Wilson Reference Wilson1987; McKinney Reference McKinney1997), while the effects of abundance on extinction risk are yet unclear (Harnik Reference Harnik2011; Harnik et al. Reference Harnik, Simpson and Payne2012).
Taxon geographic range is negatively correlated with extinction probability (Payne and Finnegan Reference Payne and Finnegan2007; Jablonski Reference Jablonski2008b; Harnik Reference Harnik2011; Harnik et al. Reference Harnik, Simpson and Payne2012), a correlation that is stronger for background extinctions than for mass extinction events (Payne and Finnegan Reference Payne and Finnegan2007; Jablonski Reference Jablonski2008b). If the extinction risk of any species is equal to that of others, it is less likely that all species within a larger clade become extinct. If a clade is not only more taxonomically diverse (i.e., has a larger species number) but is also more functionally diverse (i.e., its species differ more from one another), then it is more likely that at least one species bears a trait (or traits) that reduce its extinction risk. Kolbe et al. (Reference Kolbe, Lockwood and Hunt2011), for example, found that more morphologically diverse bivalve taxa were more likely to survive the Plio-Pleistocene extinction. Extant animal species in some clades are at higher extinction risks than species in other clades (Purvis et al. Reference Purvis, Agapow, Gittleman and Mace2000), with higher extinction risks found in more species-poor genera (Russell et al. Reference Russell, Brooks, McKinney and Anderson2008). In contrast, more species-rich plant families are more likely to have rare species (Dominguez Lozano and Schwartz Reference Dominguez Lozano and Schwartz2005), and young and rapidly diversifying plant clades are at greater risk of extinction (Davies et al. Reference Davies, Smith, Bellstedt, Boatwright, Bytebier, Cowling, Forest, Harmon, Muasya, Schrire, Steenkamp, van der Bank and Savolainen2011). This difference between plants and animals may be explained if speciation among plants is driven more by reproductive isolation than by functional disparity.
The degree of overall success is a combination of the four criteria but does not require a high degree of any single one of them (Fig. 3). Developing a success index will require first devising good measurements of each criterion and then modeling the relationship among the four criteria. However, the usefulness of a success index is probably very limited: one will not be able to simply determine that one clade is more successful than another using such an index, because any clade's success index value may be driven by another criterion. How can we tell what degree of abundance is equivalent to what degree of diversity, or how can we equate an abundant but nondiffused clade to a rare but diffused clade? I will therefore discuss each of the three first criteria (abundance, diffusion, and diversity) separately, focusing on how it can be made quantifiable and how we can detect changes in abundance, diffusion and diversity over geologic time.
Dating Abundance, Diffusion, and Diversity
Local increase in abundance (Fig. 3B) is first and foremost the result of individualistic properties: fecundity, fitness, and life span. For a species’ abundance to increase, it needs to reproduce and not have traits that drastically reduce survival rates in a given environment, and if individuals live longer, there is greater overlap among generations. Being measured relative to others, fitness inherently encompasses the ecological perspective of how individuals perform and their ability to outperform competitors or benefit from facilitation by others. Geographic connectivity may also contribute to abundance if it provides refuge from abiotic and biotic stressors or more opportunities to reproduce; nevertheless, these processes are more likely to prevent local extinction or inbreeding depression than to effectively increase abundance per se (Wilson Reference Wilson1987). Increase or decrease in abundance can be observed in the fossil record if it is sufficiently continuous and accounts for representational biases (e.g., Wignall and Benton Reference Wignall and Benton1999). The use of molecular methods to identify and date increases in abundance is more limited, mostly because it relies on extant or very recently extinct species rather than on remains of ones that may have perished millions of years ago. Ancestral effective population sizes can be estimated from molecular data (e.g., Rannala and Yang Reference Rannala and Yang2003; Wall Reference Wall2003; Schiffels and Durbin Reference Schiffels and Durbin2014, and references therein), but cannot be equated with population size, and are still constrained by the inability to sample extinct clades.
Diffusion (Fig. 3C) demonstrates the ability of a trait or clade to exceed the confines of its initial range and to expand in physical space. Because such spatial expansion often requires expanding beyond the initial niche or crossing geographic and ecological barriers, diffusion often encompasses not only expansion and flexibility in physical space but also in niche space, and can be taken as a measure of wide-range adaptedness or fitness. Diffusion depends on factors such as physical mobility, niche size, and niche range, which are translatable to geographic range (Wiens and Donoghue Reference Wiens and Donoghue2004; Sen Reference Sen2013; Godsoe Reference Godsoe2010). Although geographic connectivity can contribute to increased diffusion, it can also be a confounding factor if a clade diffuses simply because geographic connectivity exists (or becomes possible due to tectonic changes), rather than because of its intrinsic traits. Diffusion due to a trait that overcomes geographic fragmentation or ecological limitations often makes a more convincing case for success (e.g., Gheerbrandt and Rage Reference Gheerbrandt and Rage2006; Godsoe Reference Godsoe2010). Diffusion can be observed in the fossil record as the expansion of geographic and niche spaces in which fossils are found. Phylogeography can contribute to reconstructing the chronology of diffusion by indicating when and how a clade diffused in physical space (e.g., Bouchenak-Khelladi et al. Reference Bouchenak-Khelldai, Verbooom, Savolainen and Hodjinson2010; Prieto-Marquez Reference Prieto-Marquez2010). Nevertheless, phylogeographic analyses are less effective in identifying diffusion, because conducting such analyses requires a wide geographic range of extant clade members that is by itself evidence of diffusion, and because such analyses are unable to identify areas that clades have occupied in the past but abandoned since then.
Diversity (Fig. 3D) is probably the most commonly used measure of success (e.g., Heard and Hauser Reference Heard and Hauser1995; Donoghue Reference Donoghue2005), for three main reasons. First, diversification takes time and is therefore likely to be positively correlated with persistence through geologic time. However, some clades can persist for hundreds of millions of years without being extremely diverse at any time throughout their long history or well after their diversity decreased, as exemplified by the 445 Myr history of horseshoe crabs (Rudkin and Young Reference Rudkin, Young, Tanacredi, Botton and Smith2009; Lamsdell Reference Lamsdell2015). Second, the existence of many forms sharing a trait increases the probability that the trait survives over time (Wilson Reference Wilson1987). Third, diversity is often conceived as demonstrating that a shared trait confers an ecological advantage to a variety of organismal forms and niches (Heard and Hauser Reference Heard and Hauser1995; Hunter Reference Hunter1998; but see Donoghue [2005] and Pigliucci [2008], who present a more pessimistic view of what key innovations mean for diversification). Notwithstanding this, diversity differs from abundance and diffusion in several aspects (Table 1). Reflecting genotypic and/or phenotypic variance within a derived clade (or group of clades sharing a common key trait), diversity mirrors emergence is certain ways. It is more strongly affected by genetic processes than by processes more closely associated with population ecology and is probably driven more by niche partitioning than by competitive superiority or niche range. While abundance and diffusion are often increased by geographic connectivity, diversification may require geographic isolation. Finally, both the fossil and the molecular records strongly attest to periods of high diversification rates. The fossil record provides information on morphological species numbers (e.g., Crepet et al. Reference Crepet, Nixon and Gandolfo2004; Benton Reference Benton2010; Prieto-Marquez Reference Prieto-Marquez2010; Herenden et al. Reference Herendeen, Friis, Pedersen and Crane2017), whereas molecular data can directly attest only to current within-clade variance but can indicate the time most of this variance stems from (e.g., Magallon and Castillo Reference Magallon and Castillo2009; Erwin et al. Reference Erwin, Laflamme, Tweedt, Sperling, Pisani and Peterson2011; Magallon et al. Reference Magallon, Gomez-Acevedo, Sanchez-Reyes and Hernandez-Hernandez2015).
The criteria for success differ in the abiotic, ecological, and geographic variables and processes that drive their dynamics (Table 1). Therefore, defining and quantifying the components that contribute to success at different points in geologic time can improve our understanding of macroevolutionary processes and the external factors that may have contributed to a trait's or clade's success. The fossil record can be especially important in such analyses, because each criterion of success is potentially identifiable and datable by a different type of fossil information (Table 1). Molecular methods also hold great potential for quantifying and dating different stages in the rise to success, albeit possibly to a lesser extent than and with some reliance on the fossil record.
Three Examples
Oxygenic Photosynthesis and the Great Oxidation Event
Approximately 2.4–2.2 Ga, atmospheric O2 concentrations increased from 0.1% to nearly 10%. This increase, the Great Oxidation Event (GOE), is thought to have been caused by intense activity of oxygenic photosynthesizing cyanobacteria (Lyons et al. Reference Lyons, Reinhard and Planavsky2014), and it is often taken as evidence for a great cyanobacterial increase in abundance. Nevertheless, we now have mounting evidence from fossils (Wacey Reference Wacey2010; Schopf Reference Schopf and Whitton2012), geochemistry (Planavsky et al. Reference Planavsky, Asael, Hofmann, Reinhard, Lalonde, Knudsen, Wang, Ossa Ossa, Pecoits, Smith, Beukes, Bekker, Johnson, Konhauser, Lyons and Rouxel2014), and phylogenetics (Schirrmeister et al. Reference Schirrmeister, Gugger and Donoghue2015) that oxygenic photosynthesizing cyanobacteria had already existed as far back as 0.3–1 Gyr before the GOE (see reviews in Buick [Reference Buick2008], Hohmann-Marriott and Blankenship [Reference Hohmann-Marriott and Blankenship2011], and Schopf [Reference Schopf and Whitton2012]; and critique of some of this evidence in Rasmussen et al. [Reference Rasmussen, Fletcher, Brocks and Kilburn2008]). This is possibly one of the largest chronological gaps between trait emergence and evidence for its success. One explanation is that cyanobacterial oxygenation before the GOE was absorbed and buffered by the oceans (Goldblatt et al. Reference Goldblatt, Lenton and Watson2006). Another explanation is that early cyanobacterial oxygenation limited cyanobacterial nitrogen-fixing ability (an anaerobic process) and that cyanobacteria evolved the ability to segregate nitrogen fixation from oxygenation only shortly before the GOE (Berman-Frank et al. Reference Berman-Frank, Lundgern and Falkowski2003; Schirrmeister et al. Reference Schirrmeister, Gugger and Donoghue2015). It was only once these adaptations evolved that oxygenizing cyanobacteria's fitness increased, leading to them outcompeting non-oxygenic photosynthesizing species (Schopf Reference Schopf and Whitton2012), increasing in abundance, and eventually causing the GOE.
This example demonstrates that differences in emergence and success times (Fig. 2) can be evidence for complex macroevolutionary processes and for the complex reciprocity that can exist among traits. It also demonstrates the impaired ability to clearly define key innovations as phenotypic “game changers” (Donoghue Reference Donoghue2005). In this example, it appears that it is not oxygenic photosynthesis itself that caused an increase in abundance and eventually the GOE, but the subsequent adaptations to the high intracellular oxygen concentrations. So what is, if any, the key innovation?
Angiosperm Origins
A large body of fossil evidence shows that the key morphological and anatomical traits that define angiosperms (e.g., double fertilization, dense leaf-vein systems, and advanced durable vascular tissues) all emerged approximately 200–150 Ma, with no earlier fossil evidence for these traits (Crepet et al. Reference Crepet, Nixon and Gandolfo2004; Herendeen et al. Reference Herendeen, Friis, Pedersen and Crane2017). However, molecular analyses of mitochondrial, plastid, and nuclear sequences suggest that the angiosperm clade and its sibling gymnosperm clade had diverged at least 250 Ma, with some studies even suggesting 350 Ma (Qiu et al. Reference Qiu, Lee, Bernasconi-Quadroni, Soltis, Soltis, Zanis, Zimmer, Chen, Savolainen and Chase1999; Bowe et al. Reference Bowe, Coat and dePamphilis2000; Magallon and Castillo Reference Magallon and Castillo2009; Magallon et al. Reference Magallon, Gomez-Acevedo, Sanchez-Reyes and Hernandez-Hernandez2015; and see supporting pollen evidence in Zavada [Reference Zavada2007]). Molecular dating of crown angiosperms’ emergence, however, agrees with the fossil record, setting dates of approximately 141–135 Ma (Magallon and Castillo Reference Magallon and Castillo2009; Magallon et al. Reference Magallon, Gomez-Acevedo, Sanchez-Reyes and Hernandez-Hernandez2015). Zavada's (Reference Zavada2007) report of angiosperm-like pollen in the Triassic suggests that some angiosperm-like or angiosperm ancestral plants did exist at least 250 Ma, but there is no mesofossil or macrofossil evidence for plants with other angiosperm-like traits until 200 Ma. These lines of evidence suggest a 50–200 Myr stasis, in which the ancestral angiosperm and the gymnosperm clades were separated genetically but had indistinguishable morphologies (Sanderson Reference Sanderson2015; Katz Reference Katz2018); that is, ancestral angiosperms were a paleontologically cryptic clade (Sanderson Reference Sanderson2015; Struck et al. Reference Struck, Feder, Bendiksby, Birkeland, Cerca, Gusarov, Kistenich, Larsson, Liow, Nowak, Stedje, Bachmann and Dimitrov2018; Fig. 1).
This possible chronological gap raises questions like how such a long stasis was maintained, or whether distinguishing features exist but are yet invisible to us (Katz Reference Katz2018). A further question is how quickly after acquiring their distinct traits did true angiosperms diversify and become dominant in various ecosystems (e.g., Krassilov and Silantieva Reference Krassilov and Silantieva2005; Magallon and Castillo Reference Magallon and Castillo2009; Magallon et al. Reference Magallon, Gomez-Acevedo, Sanchez-Reyes and Hernandez-Hernandez2015; but see conflicting pollen evidence in Zavada [Reference Zavada2007]). Was there a reason that after a long stasis, all angiosperms’ key defining traits emerged in such a short time and led to their success? Moreover, it is still disputed whether and which of these traits were the key innovations responsible for angiosperm success (Berendse and Scheffer Reference Berendse and Scheffer2009; Katz Reference Katz2018), and morphological and anatomical innovations long thought to be key may be abandoned in favor of life cycle traits (Berendse and Scheffer Reference Berendse and Scheffer2009).
Plant Silicon
Silicon confers various benefits to plants that can accumulate it in large amounts, including defense from herbivores and improved resistance and tolerance to aridity (Katz Reference Katz2014). Trembath-Reichert et al.’s (Reference Trembath-Reichert, Wilson, McGlynn and Fischer2015) analysis of plant silicon transporters’ phylogeny revealed that the genetic infrastructure for silicon accumulation is shared by all land plants and may precede the invasion of the land. Strömberg et al. (Reference Strömberg, Di Stilio and Song2016) found that despite the shared genetic infrastructure (Trembath-Reichert et al. Reference Trembath-Reichert, Wilson, McGlynn and Fischer2015), active silicon accumulation evolved independently several times among land plants and angiosperms, but found no temporal coalescences with possible environmental drivers (e.g., aridity or herbivory). Finally, Katz (Reference Katz2015) found that silicon-rich angiosperms’ early success (reflected by the diversification of angiosperm orders with silicon-rich species compared with clades with only silicon-poor species) is possibly contemporaneous with the evolution of abrasion-adapted dentition in several dinosaur and mammalian clades, suggesting a possible coevolution of the two traits. These three studies allegedly tell three different stories.
The contradiction between Strömberg et al.’s (Reference Strömberg, Di Stilio and Song2016) failure to identify external drivers and Katz's (Reference Katz2015) suggested coalescence can be explained by Katz (Reference Katz2015) referring to success time, which reflects increased fitness that can more strongly be related to external drivers than Strömberg et al.’s (Reference Strömberg, Di Stilio and Song2016) emergence times (Fig. 2). The difference between Trembath-Reichert et al.’s (Reference Trembath-Reichert, Wilson, McGlynn and Fischer2015) and Strömberg et al.’s (Reference Strömberg, Di Stilio and Song2016) emergence times can be explained by silicon accumulation being a complex trait that involves several transporters (Ma and Yamaji Reference Ma and Yamaji2015), whose physiology and ecology vary among plant clades (Katz Reference Katz2014). The shared genetic infrastructure for silicon accumulation that Trembath-Reichert et al. (Reference Trembath-Reichert, Wilson, McGlynn and Fischer2015) studied is only partial, so the trait's later independent emergences possibly follow the emergence of other components of the complete silicon-accumulation system or the removal of certain physiological barriers (Fig. 1). Therefore, each of the three studies or research approaches tells only a part of the full story: the emergence of genetic and physiological infrastructure (Trembath-Reichert et al. Reference Trembath-Reichert, Wilson, McGlynn and Fischer2015), the emergence of the trait and the clades bearing it (Strömberg et al. Reference Strömberg, Di Stilio and Song2016; Fig. 2), and its ecological success (Katz Reference Katz2015; Fig. 3).
Concluding Notes
Genes, traits, and clades; fitness, diversity, and biogeography—each is a part of the macroevolutionary process. The mechanistic and chronological linkages among these turn macroevolution from a series of events into a process. Therefore, a correct reading of the full story relies on our ability to distinguish the various components that make a macroevolutionary process and how they are mechanistically and chronologically linked. Any new date assigned to a part of the macroevolutionary process—whether it is obtained from a newly discovered fossil or from analyses of the fossil and molecular record—needs to be examined by asking and answering the fundamental question of what component is actually being dated. Then the new date needs to be compared with other dates (again, considering which components of the macroevolutionary process they date). Conflicts exist if dates for the same component (e.g., the emergence of a gene or a trait) differ greatly or if the chronological order of two or more components is highly improbable (e.g., a trait emerging before the genes that code it). Such conflicts most likely indicate a methodological problem.
However, other cases, such as the ones described in the three examples presented earlier, do not reflect real conflicts. Such chronological gaps can potentially exist because of real biological phenomena (e.g., the cases of cyanobacteria and angiosperm ancestry) or because of differences in data sources (e.g., the cases of cyanobacteria and plant silicon). Such chronological gaps may also not exist—or at least may be undetectable—if gene emergence, trait emergence, clade emergence, and rise to success all take place in a tight time frame. However, when such gaps exist, they present new questions and new avenues of research. The ecology of early cyanobacterial oxygenation and the possibility of ancestral angiosperm crypticity are only two examples. Hence, looking into these gaps can increase our understanding of macroevolution itself, and even raise principal questions, for example, how traits and clades evolve, or how and what we perceive as key innovations.
Acknowledgments
I am grateful to Amir Szitenberg from the Dead Sea and Arava Science Center for fruitful discussions and for directing my attention to several issues in the text that required clarification. The Israel Ministry of Science and Technology's support of the Dead Sea and Arava Science Center allowed the compilation of this article. I thank the anonymous reviewers for their insightful comments.