


1. Introduction
There are two types of detonation waves, normal and oblique, depending on whether the pre-shock inflow is perpendicular or not to the detonation surface. Benefiting from high thermal efficiency and fast heat release, oblique detonation waves (ODWs) have the potential to be used in air-breathing hypersonic engines. Compared with traditional Scramjets (supersonic combustion ramjet), ODW-based engines have several theoretical advantages, such as their high specific pulse and reduced size (Wolański Reference Wolański2013). To harness the ODW within supersonic inflows, it is first necessary to clarify the morphology of ODWs. In early works, e.g. Pratt, Humphrey & Glenn (Reference Pratt, Humphrey and Glenn1991), ODWs were treated as oblique shock waves (OSWs) with instant heat release. This model was soon found to be oversimplified: numerical (Li, Kailasanath & Oran Reference Li, Kailasanath and Oran1994) and experimental (Viguier, Gourara & Desbordes Reference Viguier, Gourara and Desbordes1996) studies observed the coexistence of an initiation region and a well-established ODW with finite heat release layer. These findings inspired later studies that revealed many different ODW structures. However, the connections and boundaries of these structures have not been quantitatively studied, and it remains impossible to predict precisely the morphology of ODWs.
Morphological studies of ODWs focus on three aspects, namely the OSW–ODW transition, the ODW surface instability and the wave system of the reactive front in the initiation region. Regarding the first aspect, two OSW–ODW transition types have been observed, named the smooth transition and the abrupt transition. The former is achieved by a curved section of the shock, whereas the latter is formed by an abrupt multi-wave point. The transition type is dependent on various parameters, such as the inflow Mach number, and several criteria have been proposed (Teng & Jiang Reference Teng and Jiang2012; Miao et al. Reference Miao, Zhou, Liu and Cai2018). In terms of the ODW surface instability, the destabilization processes have been examined and found to be sensitive to the overdriven degree and activation energy (Teng, Jiang & Ng Reference Teng, Jiang and Ng2014; Teng et al. Reference Teng, Ng, Li, Luo and Jiang2015; Zhang et al. Reference Zhang, Zhou, Gong, Ng and Teng2018). More recently, the effects of unsteady inflow have been simulated, demonstrating a novel destabilization mechanism triggered by an extraneous source (Yang, Ng & Teng Reference Yang, Ng and Teng2019a). Our latest study of ODW dynamics also considered a more complex engine geometry by investigating the influence of a far-field upper expansion corner. A special wave complex featuring a recirculation zone is revealed due to the flow–wall interaction and ODW decoupling. The enhanced surface instability from the interaction is also shown to induce destabilization of the ODW structure (Wang et al. Reference Wang, Teng, Yang and Ng2020). However, the third aspect, namely the wave system of the reactive front in the initiation region, has not yet been investigated in detail. For simplicity, the wave system is described as either one oblique shock, such as in Ghorbanian & Sterling (Reference Ghorbanian and Sterling1996), or one compression wave (CW) (Li et al. Reference Li, Kailasanath and Oran1994). Coupled with the reactive front, the former leads to an ODW, usually named the secondary ODW (SODW), whereas the latter leads to a deflagration wave. Recently, a fuel mixture (Ar-diluted  $\text {C}_2 \text {H}_2\text {--}\text {O}_2$) was used to study the ODW morphology, illustrating that the wave systems have some new forms beyond the simple CW or SODW (Fang et al. Reference Fang, Zhang, Deng and Teng2019a; Zhang et al. Reference Zhang, Fang, Ng and Teng2019). These results indicate that the wave systems are more complicated than the two classical forms suggest, so it is necessary to investigate their morphology. In essence, the wave system is critical in achieving a fundamental understanding of the morphology of ODWs, as it not only affects the OSW–ODW transition but may also change the surface instability (Yang et al. Reference Yang, Teng, Ng and Jiang2019b).
This study describes a series of simulations and analyses of ODW morphology, especially the wave systems. Based on the most widely used fuel, i.e. stoichiometric hydrogen–air, a parameter-selection method that is different from that of most previous studies is employed. The controlling parameters are chosen to be the flight altitude  $H_{0}$ and Mach number
  $M_{1}$ of an ODW-based engine, rather than the widely used parameters of the pre-detonation mixtures. Hence, the parameters are not artificial, but are related to realistic flight conditions (although the fuel–air mixing is ignored at this stage), and could vary over a wide physical range. The simulation results not only reveal morphological variations that depend on
  $H_{0}$ and
  $M_{1}$, but also demonstrate the existence of two special wave systems. A semi-theoretical approach to the morphology of ODWs is developed by combining two analysis methods, allowing us to clarify the mechanisms of the different wave systems. While conventional wisdom approaches this type of problem in an analytic fashion using shock polar analysis, such as investigations of condensed-phase detonation interaction with confinement (e.g. Short & Quirk Reference Short and Quirk2018; Bdzil, Short & Chiquete Reference Bdzil, Short and Chiquete2020), many simplifying assumptions are unavoidably required (Powers & Stewart Reference Powers and Stewart1992). The analytical results may not always reflect the numerically observed flow pattern in certain cases (Short & Quirk Reference Short and Quirk2018), particularly for a finite-length reaction-zone detonation. Indeed, the finite reaction and complex wave interactions in the initiation zone make a tractable analytic formalism challenging if not impossible. Numerical simulations remain a widely applied technique for tackling such complex phenomena of interaction between gas dynamics and finite heat release in the initiation region and identify possible wave systems with realistic conditions.
2. Physical model and computational method
Schematics of the ODW-based engine considered in this paper and the wedge-induced ODW are shown in figure 1. Following the engine inlet configuration proposed by Dudebout, Sislian & Oppitz (Reference Dudebout, Sislian and Oppitz1998) and adopted in later research (Sislian et al. Reference Sislian, Schirmer, Dudebout and Schumacher2001), the high-altitude air inflow is assumed to be compressed by two equal-strength oblique shock waves. This inlet condition ensures the same ratio of pressure or temperature across the shock. Different from equal-deflection angle employed before (Wang et al. Reference Wang, Zhang, Teng, Jiang and Ng2015), this inlet wave configuration could minimize the entropy increase, which is critical for improving propulsion performance. The fuel and air are also assumed to be well premixed at the inlet and the effect of injection is not considered. In fact, the injection of fuel in the supersonic inflow can lead to complicated cases (Ren et al. Reference Ren, Wang, Xiang, Zhao and Zheng2019a), and this process determining whether the mixture could be well premixed could affect significantly the ODW initiation. Since the flow of the incoming air is supersonic, efficient premixing with fuel in the inlet is inevitably difficult to achieve, resulting in an inhomogeneous mixture (Iwata, Nakaya & Tsue Reference Iwata, Nakaya and Tsue2017). Nonetheless, for the Mach number range considered in this investigation, the mixing length and ignition requirement are less severe (Menees, Adelman & Cambier Reference Menees, Adelman and Cambier1991), and in another research context, several injector design concepts (e.g. strut type, etc.) of providing almost complete premixing of fuel with air at supersonic speeds have been proposed and analysed in a number of studies (Cambier, Adelman & Menees Reference Cambier, Adelman and Menees1990; Menees et al. Reference Menees, Adelman and Cambier1991; Valorani, Di Giacinto & Buongiorno Reference Valorani, Di Giacinto and Buongiorno2001; Alexander, Sislian & Parent Reference Alexander, Sislian and Parent2006). For liquid fuels, the complexity of multiphase flows presents also another hurdle (Ren et al. Reference Ren, Wang, Xiang and Zheng2018, Reference Ren, Wang, Xiang and Zheng2019b). Considering that there are several multi-physics affected by a number of gas-dynamic and geometric parameters, which is hard to be determined because there are no referential engines so far, the injection process is thus not modelled here. In the early stage of engineering design, a coefficient of total pressure recovery is usually introduced to model the injection effects, but we try to avoid any artificial parameters and focus on the fundamental phenomena, so also not utilized here. In the present set-up, the premixed combustible supersonic inflow thus reflects on the two-dimensional wedge and first generates an OSW. The high post-shock temperature may trigger exothermic chemical reactions and subsequently induce ODW initiation downstream. In this study, the computational domain is enclosed by the dashed line in figure 1, whose coordinates are rotated to the direction along the wedge surface. Hence, the Cartesian grid in the rectangular domain is aligned with the wedge surface.

Figure 1. Schematics of an ODW-based engine and the wedge-induced ODW computational domain.
Viscous effects are thought to be negligible because the Reynolds number is very high (Li, Kailasanath & Oran Reference Li, Kailasanath and Oran1993; Figueira da Silva & Deshaies Reference Figueira da Silva and Deshaies2000). Many previous numerical studies (Sislian et al. Reference Sislian, Schirmer, Dudebout and Schumacher2001; Choi et al. Reference Choi, Kim, Jeung, Ma and Yang2007; Choi, Shin & Jeung Reference Choi, Shin and Jeung2009; Verreault, Higgins & Stowe Reference Verreault, Higgins and Stowe2013; Liu et al. Reference Liu, Wu, Yao and Wang2015; Wang et al. Reference Wang, Zhang, Teng, Jiang and Ng2015; Yang et al. Reference Yang, Ng and Teng2019a) are thus based on an inviscid assumption. Recent studies, such as those of Fang, Zhang & Hu (Reference Fang, Zhang and Hu2019b) and Li et al. (Reference Li, Zhang, Zhang, Ji and Gao2020), also demonstrate that the boundary layer may change the ODW structures only in certain circumstances and has a limited impact on the main flow region downstream of the ODW. More recent studies, such as that of Laguarda et al. (Reference Laguarda, Hickel, Schrijer and van Oudheusden2020), show that the inviscid flow model can still provide insight into the dynamics of unsteady shock interactions with moving wedges from a high-Mach-number flow. Despite the fact that a recirculation zone could affect the flow at the vicinity of the wall, creating certain unsteadiness and changing the location of initiation point, the type of global wave configuration remains unaffected. Therefore, this study still employs the inviscid assumption to be consistent with most previous studies, focusing primarily on the shock and heat release interaction. In addition, the role of physical diffusion is not considered in this work, although such an effect needs careful attention if highly unstable detonations, for example in methane–air mixtures, are considered of which the turbulent nature of the front provides another ingredient in the detonation propagation mechanism (Radulescu Reference Radulescu2018). In this investigation, the governing equations are thus simplified to the two-dimensional, multi-species Euler equations given by
 \begin{equation} \frac{\partial {{\boldsymbol{\mathsf{U}}}}}{\partial t}+\frac{\partial {\boldsymbol{\mathsf{F}}}}{\partial x}+\frac{\partial {\boldsymbol{\mathsf{G}}}}{\partial y}={{\boldsymbol{\mathsf{S}}}}, \end{equation}
where
 \begin{equation} {\boldsymbol{\mathsf{U}}}= \begin{bmatrix} \rho_1 \\ \vdots \\ \rho_n \\ \rho u\\ \rho v\\ e \end{bmatrix},\quad {\boldsymbol{\mathsf{F}}}= \begin{bmatrix} \rho_1 u\\ \vdots \\ \rho_n u\\ \rho u^2+P\\ \rho u v\\ (e+P)u \end{bmatrix},\quad {\boldsymbol{\mathsf{G}}}= \begin{bmatrix} \rho_1 v\\ \vdots \\ \rho_n v\\ \rho u v\\ \rho v ^ 2 + P\\ (e+P)v \end{bmatrix},\quad {\boldsymbol{\mathsf{S}}}= \begin{bmatrix} {\dot{\omega}}_1\\ \vdots \\ {\dot{\omega}}_n\\ 0\\ 0\\ 0 \end{bmatrix}. \end{equation}
Here,  $\rho$,
  $u$,
$u$,  $v$ and
  $P$ represent the density, velocity along the
  $x$-axis direction, velocity along the
  $y$-axis direction and pressure, respectively. The density
  $\rho$ and total energy
  $e$ are calculated by
 \begin{gather} \rho=\sum_{i=1}^n\rho_i, \end{gather}
 \begin{gather}e=\rho h - P + \tfrac{1}{2} \rho (u^2+v^2), \end{gather}
where the specific enthalpy can be written as  $h=\sum _{i=1}^n\rho _i h_i/\rho$ with
  $h_i$ obtained from the thermodynamic data of each species. The equation of state is
 \begin{equation} P=\sum_{i=1}^n\rho_i \frac{R_0}{w_i} T, \end{equation}
where  $w_i$ is the molecular weight,
  $T$ is the gas temperature,
  $R_0$ is the universal gas constant and
  ${\dot {\omega }}_i$ is the species’ specific mass production rate, dictated by the chemical reaction model. The chemical kinetic model used in this study is one of the most recent, comprehensive
  $\text {H}_2/\text {O}_2$ kinetic mechanisms suitable for high-pressure combustion (Burke et al. Reference Burke, Chaos, Ju, Dryer and Klippenstein2012). This mechanism involves 27 reversible, elementary reactions among eight species (
 $\text {H}_2$,
  $\text {O}_2$,
  $\text {H}_2\text {O}$, H, O, OH,
  $\text {HO}_2$ and
  $\text {H}_2\text {O}_2$) with five inert species (
 $\text {N}_2$, Ar, He, CO and
  $\text {CO}_2$). The thermodynamic properties of the chemical species are evaluated using the nine-coefficient NASA polynomial representation (McBride, Zehe & Gordon Reference McBride, Zehe and Gordon2002). The governing equations are discretized on Cartesian uniform grids and solved using the DCD (Dispersion Controlled Dissipation) scheme (Jiang Reference Jiang2004) with Strang's splitting. To overcome the stiffness problem, a sufficient number of sub-reaction steps are involved to ensure overall accuracy (Yee et al. Reference Yee, Kotov, Wang and Shu2013). To achieve sufficient numerical grid resolution for the simulations, standard MPI-based parallelization was implemented in the numerical code and the parallel mode of computation was executed on a 96 multi-core CPU high-performance computing facility. The numerical code has been used and validated in our previous studies to investigate different aspects of ODWs (Teng, Ng & Jiang Reference Teng, Ng and Jiang2017; Tian, Teng & Ng Reference Tian, Teng and Ng2019).
The inflow is set to be a homogeneous stoichiometric hydrogen–air mixture with  $\text {H}_2{:}\text {O}_2{:}\text {N}_2=2{:}1{:}3.76$ in all cases. The inflow conditions are fixed at the free-stream values along both the left and upper boundaries of the domain. The outflow conditions extrapolated from the interior under the assumption of zero first-order derivatives are implemented on the right and lower boundaries before the wedge. A slip boundary condition is used on the wedge surface, which starts from
  $x = 0$ on the lower computational boundary. Initially, the whole flow field has uniform density, velocity and pressure, which are calculated according to the inflow conditions and the wedge angle
  $\theta$, fixed at
  $19^\circ$. The simulations do not stop until the ODW flow field converges to a steady state. Because of the multi-scale nature of the phenomena, both the computational domain and mesh scale are adjusted, and so resolution studies are conducted to ensure the global characteristic features are unaffected by the mesh properties. In all subsequent figures, the dimensions of temperature, pressure, density and heat release rate are K, Pa,
  $\text {kg}\ \text {m}^{-3}$ and
  $\text {kJ}\ \textrm {cm}^{-3}\ \textrm {s}^{-1}$, respectively.
In most previous studies, the controlling parameters are those of the pre-detonation mixtures, such as velocity, temperature and pressure. To avoid artificial parametric variations and to cover a wide range of flight conditions, the controlling parameters are set to be the flight altitude  $H_0$ and Mach number
  $M_1$. In the simulations, the parameters of the pre-detonation mixtures are first derived from
  $H_0$ and
  $M_1$, and then used as input variables in the codes. According to the standard atmosphere (King Reference King1978),
  $P_1$ and
  $T_1$ can be determined by the flight altitude
  $H_0$, and the flow velocity
  $V_1$ can be obtained from
  $M_1$. Subsequently, the inflow is compressed twice by the OSW, whose parameters can be calculated through the Rankine–Hugoniot relations for the given oblique shock angle. The implicit relation between the oblique shock angle
  $\beta _i$
  $(i=1,2)$ and the flow deflection angle
  $\varphi _i$
  $(i=1,2)$ is given by
 \begin{equation} \tan^3 \beta_i + A \tan^2 \beta_i +B \tan \beta_i + C = 0, \end{equation}
where
 \begin{equation} \left.\begin{gathered} A=\frac{1-{M_i}^2}{\tan \varphi_i [1+(\gamma-1){M_i}^2/2]},\\ B=\frac{1+(\gamma+1){M_i}^2/2}{1+(\gamma-1){M_i}^2/2},\\ C=\frac{1}{\tan \varphi_i [1+(\gamma-1){M_i}^2/2]}. \end{gathered}\right\}\end{equation}
To satisfy the hypothesis for the inlet configuration of two equal-strength shocks, the normal Mach number in front of each oblique shock should be equal, that is,
 \begin{equation} M_1 \sin \beta_1=M_2 \sin \beta_2. \end{equation}
By combining (2.6)–(2.8), the flow parameters after twice compressing, i.e.  $P_3$,
  $T_3$ and
  $V_3$, can be deduced by the given fixed total flow deflection angle
  $\varphi =24^\circ$. These parameters are also taken as the inflow parameters before the ODW. Again, the mixing process is neglected, and thus a homogeneously premixed mixture enters the combustor.
3. Numerical results and discussion
3.1. Effects of flight altitude and Mach number
In this study, a total of 15 cases are simulated with different  $M_1$ and
  $H_{0}$ values. Using the methods introduced above, the resulting pre-detonation parameters are calculated according to
  $M_1$ and
  $H_{0}$, as listed in table 1. Overall, there are three case groups. The first group includes cases 1 to 7, with a fixed
  $M_1$ = 10.0 and a variable
  $H_{0}$. The second group includes cases 8 to 11, with a variable
  $M_1$ and a fixed
  $H_{0} = 30\ \textrm {km}$. The third group, cases 12 to 15, also uses a variable
  $M_1$ but
  $H_{0}$ is fixed to be 20 km. The first case group is used to investigate the effects of
  $H_{0}$, while the other case groups are mainly for investigating the effects of
  $M_1$ with different altitudes. For the first case group, the pressure
  $P_3$ is sensitive to
  $H_{0}$, but the temperature
  $T_3$ and velocity
  $V_3$ are not: increasing
  $H_{0}$ decreases
  $P_3$ significantly, but there are only slight increases in
  $T_3$ and
  $V_3$.
Table 1. Pressure, temperature and velocity of a stoichiometric hydrogen–air mixture at the combustor entrance of all presented cases.

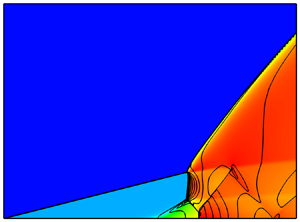
First of all, the ODW fields of case 5, with  $H_{0} = 30\ \textrm {km}$ and
  $M_1 = 10.0$, are displayed in figure 2 by pressure, temperature,
  $\text {H}_2$ density and heat release rate. The morphology indicates a simple structure: the OSW–ODW transition is smooth, and the ODW surface is stable with no fine structure. In the wave system of the initiation region, the pressure increase across the reactive front is trivial near the lower wedge, coupled with a modest temperature rise. When approaching the ODW surface, the pressure variation across the reactive front becomes obvious, coupled with a rapid temperature increase. Meanwhile, a post-shock region with high
  $\text {H}_2$ density can be observed, suggesting that there exists one CW in front of the heat release surface. This CW leads to the maximum heat release rate, as shown in figure 2(d). Despite different chemical reaction mechanisms, similar structures have been observed in previous studies (Teng & Jiang Reference Teng and Jiang2012; Yang et al. Reference Yang, Teng, Jiang and Ng2018, Reference Yang, Ng and Teng2019a).

Figure 2. Pressure (a), temperature (b),  $\text {H}_2$ density (c) and heat release rate (d) with
  $H_{0} = 30\ \textrm {km}$,
  $M_1 = 10.0$.
For the other cases of the first group, the temperature fields and pressure contours are displayed in figure 3. As one important aspect of the ODW morphology, the OSW–ODW transition varies with  $H_{0}$: the transition is smooth for
  $H_{0} = 35$ and 40 km and abrupt in the case of
  $H_{0} = 10$, 15 and 20 km. In case 4 (
 $H_{0} = 25\ \textrm {km}$, shown in figure 3d), the transition is an intermediate type between the abrupt and smooth transitions. The different transition types can be attributed to variations in the inflow depending on
  $H_{0}$. As listed in appendix B, environmental gas temperature changes a little while pressure/density changes significantly when
  $H_{0}$ varies. For instance, the temperature rises from about 960 K in case 1 to about 1070 K in case 7, as shown in table 1. In contrast, the pressure decreases from about 1200 kPa to about 13 kPa, which has much greater variation than the temperature. From the equation of state, the density variation is close to the pressure variation, reflecting a dense inflow with low altitude and rare inflow with high altitude. Thus, the morphology is dominated by pressure or density, rather than by temperature. With a low
  $H_{0}$, the inflow becomes dense, so the angle difference between oblique shock and oblique detonation becomes large, as displayed in figure 3. The angle difference plays an important role in the OSW–ODW transition (Teng & Jiang Reference Teng and Jiang2012), i.e. a large difference induces an abrupt transition and vice versa. Hence, the transition type is abrupt with low
  $H_{0}$ and smooth with high
  $H_{0}$. On the contrary, a high temperature should induce a fast initiation of ODW with a high
  $H_{0}$, which does not occur due to the effects of the low pressure or density.

Figure 3. Temperature fields overlapped with pressure contours in the cases of  $M_1 = 10.0$ and
  $H_{0} = 10\ \textrm {km}$ (a), 15 km (b), 20 km (c), 25 km (d), 35 km (e), 40 km (f).
Regarding the wave system of the initiation region, CWs of different strengths arise from the wedge in all cases. When approaching the OSW–ODW surface, the pressure contours converge gradually to a narrow spatial region. Despite a stationary flow field, this wave distribution can be viewed as a convergence from the bottom up, named ‘CW convergence’. For high values of  $H_{0}$, the CW and its convergence are modest, as shown in figure 3(e,f). In contrast, the CW becomes strong with fast convergence in figure 3(a,b), resulting in the oblique shock. This CW–OSW system also introduces another oblique shock and a slip line in the product, which are necessary to match the parameters of different zones. An intermediate wave system between the CW and CW–OSW may appear, such as that shown in figure 3(c,d).
To study the effects of changes in  $M_1$, the ODWs of the second case group, with different values of
  $M_1$ and
  $H_{0} = 30\ \textrm {km}$, are shown in figure 4 by the temperature fields and pressure contours. As
  $M_1$ decreases from 10.0 to 9.5, the transition remains smooth and the wave system retains the CW, as shown in figure 4(a). Decreasing
  $M_1$ further to 9.0, however, causes the transition to change from smooth to abrupt, coupled with a strong CW overlapping on the reactive front, as shown in figure 4(b). Further decreasing
  $M_1$ to 8.5, one short Mach stem appears below the transition point, resulting in a more complicated wave system beneath the transition point in figure 4(c). In the case of
  $M_1$ = 8.0 (shown in figure 4d), the wave system features a long normal detonation wave (NDW) that covers over half of the length from the surface to the wedge. This long NDW coupled with the reactive front has not been observed in steady ODWs, although it has appeared in transient ODWs (Teng et al. Reference Teng, Jiang and Ng2014). The ODWs of the third group, with different values of
  $M_1$ and
  $H_{0}$ = 20 km, are shown in figure 5. This case group should be compared with that shown in figure 3(c), with an abrupt transition in the case of
  $M_1 = 10.0$. Increasing
  $M_1$ to 10.5 changes the transition to return smooth, and the CW arises clearly in figure 5(a). Decreasing
  $M_1$ leads to the abrupt transition, coupled with the CW–OSW wave system. From figure 5(b) to 5(d), the SODW becomes longer and the angle becomes larger, also leading to a long NDW. This trend of morphology variation is similar to that in figure 4, although a relatively high
  $M_1$ is necessary for generating similar structures. This is because the low
  $H_{0}$ corresponds to a dense inflow or high normalized heat release, so high
  $M_1$ is necessary for the standing of ODW to match the high Chapman–Jouguet (CJ) Mach number of the mixture inflow.

Figure 4. Temperature fields overlapped with pressure contours in the cases of  $H_{0} = 30\ \textrm {km}$ and
  $M_1 = 9.5$ (a), 9.0 (b), 8.5 (c), 8.0 (d).

Figure 5. Temperature fields overlapped with pressure contours in the cases of  $H_{0} = 20\ \textrm {km}$ and
  $M_1 = 10.5$ (a), 9.5 (b), 9.0 (c), 8.5 (d).
3.2. Discussion of the two wave systems
From the morphology observed in § 3.1, some features of ODWs in a stoichiometric hydrogen–air mixture can be clarified. For the first aspect of the morphology, the OSW–ODW transition, both smooth and abrupt types appear. Their variation depends on  $H_{0}$ and
  $M_1$, and can be predicted by previously reported criteria (Teng & Jiang Reference Teng and Jiang2012; Miao et al. Reference Miao, Zhou, Liu and Cai2018). For the second aspect, the ODW surface instability, all the surfaces are stable and free of fine structures. However, for the third aspect of the morphology, the wave system of the reactive front, several different wave configurations are observed. Among them, two wave systems deserve further detailed analysis, namely case 9 shown in figure 4(b) and case 11 shown in figure 4(d).
The ODW of case 9, displayed in figure 4(b), demonstrates a special wave system featuring a CW-induced abrupt transition. The CW usually appears in cases of smooth OSW–ODW transitions, whereas the SODW, which is actually a combination of an OSW and the reactive front, usually appears in cases of abrupt OSW–ODW transition. However, whether the CW could induce the abrupt transition, without the formation of either an OSW or SODW, has not been carefully studied. In case 9, the results reveal that the abrupt transition could appear together with the CW, leading to a morphology that has previously been ignored. To illustrate the characteristics of this morphology, pressure distributions along different lines parallel to the  $x$ axis for cases 9 and 10 are plotted in figure 6. As shown in figure 6(a), there is a gradual pressure increase along each curve, except for the final (pink) one. In contrast, a sharp pressure increase appears on curves 3–6 in figure 6(b), illustrating a shock rather than a CW. Note that the unavoidable diffusion means it is usually difficult to distinguish a shock from a strong CW when analysing the results from shock-capturing methods, although the former has a fixed number of mesh points while the latter does not when the simulation resolution changes. The rapid pressure increase, such as in curves
  $4$ (black) and
  $5$ (orange) in figure 6(a), might be thought of as a weak shock. However, if it is a shock, the coupling with heat release will result in a SODW in the shocked gas, whose peak pressure should be higher than that of the main ODW. This phenomenon is verified in figure 6(b), illustrating that the peak pressure behind the main ODW (curve
  $6$) is less than that of curves 3–5. Nevertheless, in figure 6(a), the peak pressure is greatest on the pink curve, indicating, from another viewpoint, that there is only a CW.

Figure 6. Pressure along different lines parallel to the  $x$ axis in the cases of
  $H_{0} = 30\ \textrm {km}$,
  $M_1 = 9.0$ (a) and 8.5 (b).
To analyse the CW-induced abrupt transition further, the heat release rate fields of cases 9 and 14, with the same  $M_1$ = 9.0, are compared in figure 7. Overlapped with pressure contours, the CW evolution can be observed clearly. As shown in figure 7(a), the heat release induces the CW, indicated by the pressure contours in front of the main heat release layer. The pressure contours converge when they approach the surface, accelerating the heat release through a positive feedback. In case 14 shown in figure 7(b), the CW–OSW wave system appears, demonstrating a different wave configuration. Actually, this wave system is similar to that in figure 7(a) near the wedge, but the fast convergence of CW results in a SODW, which couples tightly with the heat release.

Figure 7. Heat release rate fields overlapped with pressure contours (black): (a)  $H_{0} = 30\ \textrm {km}$,
  $M_1 = 9.0$; (b)
  $H_{0} = 20\ \textrm {km}$,
  $M_1 = 9.0$.
The coexistence of a CW and the abrupt transition helps understand the morphology in physical terms. Previously, the smooth and abrupt transitions were thought to correspond to the CW and OSW/SODW, respectively. The present morphological study demonstrates that, besides the smooth transition, the abrupt transition might be triggered by the CW, challenging the phenomenological connection of the transition type and the wave system. From the viewpoint of initiation, the CW or SODW may be viewed as the ignition source, and the smooth/abrupt transition viewed as the slow/fast initiation. Weak ignition by a CW usually induces the slow initiation, i.e. the smooth transition, and vice versa. However, given a strong enough CW, the fast initiation, i.e. the abrupt initiation, is also possible. This is only a qualitative explanation, and further detailed quantitative analysis is necessary in the future.
It is worth noting that the ODW of case 11, displayed in figure 4(d), is another illustration of the well-known ‘detonation-behind-shock’ wave configurations observed elsewhere. Examples include initiation of high explosives in flyer plate experiments, the critical detonation diffraction problem where the transverse detonation sweeps through the unburnt materials behind the decoupled, diffracted shock and the final stage of the deflagration-to-detonation transition (Oppenheim, Laderman & Urtiew Reference Oppenheim, Laderman and Urtiew1962; Arienti & Shepherd Reference Arienti and Shepherd2005; Khasainov et al. Reference Khasainov, Presles, Desbordes, Demontis and Vidal2005; Menikoff & Shaw Reference Menikoff and Shaw2011). It is, however, noteworthy that the present wave configuration is also stationary. A similar flow field arises in case 15 (figure 5d), indicating it is a universal morphology. To investigate this special wave system, its local fields are shown in figure 8. On the reactive front, the lower part near the wedge is the CW, similar to the other cases. From the bottom up, the CW converges and ends with one NDW, rather than the usual SODW. In the product behind the reactive front, there is one oblique shock (OSW2) extending towards the wedge, and this induces a Mach stem and reflective OSW (R-OSW2). There are two slip lines observed in this wave system, originating from the two ends of the NDW. The near-field flow is subsonic behind the ODW (S1), the NDW (S2) and the Mach stem (S3), as shown in figure 8(b).

Figure 8. Temperature (a) and pressure with black sonic lines (b) in the case of  $H_{0} = 30\ \textrm {km}$,
  $M_1 = 8.0$.
From the viewpoint of morphology, the formation of the NDW leads to a more complicated wave system. An upstream-facing NDW is thought to be impractical and should be avoided in an engine, attributed to the possible large total pressure loss. However, this NDW does not face the inflow directly, but locates behind the main OSW and normal to the pre-shocked gas rather than the inflow, so its effects on the propulsion performance should be examined in the future. For a long time, whether it was possible to have a NDW in the initiation region was not addressed in ODW research. Our recent study (Zhang et al. Reference Zhang, Fang, Ng and Teng2019) has demonstrated the possibility of a NDW in this region, but the spatiotemporal scale is too short for detailed analysis. A similar short stem also appears in case 10, as displayed in figure 6(b). This wave system is composed of three sections, namely a lower CW, middle SODW and upper NDW. In case 11, the CW does not converge to become an OSW or SODW, but instead to become a normal shock or NDW. These structural variations indicate that there are underlying connections among the various wave systems, suggesting a study of the wave system by analysing the flow characteristics, rather than building the phenomenological connection.
3.3. Analysis of the flow characteristics
Using the control parameters of flight altitude  $H_{0}$ and Mach number
  $M_1$, the morphological variation becomes clearer, which might be helpful in engineering applications. Both
  $H_{0}$ and
  $M_1$ influence the morphology, although there is greater sensitivity to
  $M_1$ than to
  $H_{0}$. In the parametric range considered in this study,
  $H_{0} = 10\text {--}40\ \textrm {km}$ and
  $M_1 = 8.0\text {--}10.0$, the smooth transition with simple wave systems appears with high
  $H_{0}$ and
  $M_1$, and the abrupt transition with complicated wave systems appears with low
  $H_{0}$ and
  $M_1$. Moreover, decreasing
  $H_{0}$ and
  $M_1$ may change the morphology, leading to the SODW or the NDW.
The morphology of ODWs has been studied by many researchers, but there are still some structural ambiguities. According to the wave systems presented above, the latest knowledge on the morphology is illustrated in figure 9. There are four different wave systems, named Type I–IV. The first morphology type features the smooth transition and the CW system, which was identified in early research. The CW is generated by the heat release and interacts with the main OSW, which is deflected gradually. Figure 9(b) features the abrupt transition and the CW system, the existence of which was described in the previous subsection. In figure 9(c), the abrupt transition appears with the SODW system, a configuration that has been known for some time (Ghorbanian & Sterling Reference Ghorbanian and Sterling1996). However, prior studies have not determined the existence of the CW near the wedge. By revisiting studies claiming the existence of this SODW, such as Liu et al. (Reference Liu, Liu, Wu and Wang2016), the CW can be observed despite its brief appearance, suggesting that the CW is unavoidable. For the fourth morphology type in figure 9(d), the CW converges rapidly, leading to the special wave system composed of a CW–NDW complex. Note that the morphology transition depends on  $M_1$ and
  $H_{0}$ continuously, so certain ODWs might be hard to classify into one type. To elucidate the morphology transition beyond phenomenological connections, it is necessary to analyse the wave system from the viewpoint of the wave evolution, especially the CW behaviour which is unavoidable in all the wave systems.

Figure 9. Morphology of ODWs with different wave systems.
The origin of the CW is attributable to heat release in the shocked flow. To clarify the physical law, figure 10(a) demonstrates the variations of heat release rate along the lines of  $y = 0\ \textrm {m}$ in cases 9 and 10. It can be observed that the heat release increases first and decreases subsequently, leading to a high temperature downstream. According to the gas-dynamic theory (Liepmann & Roshko Reference Liepmann and Roshko2001), the heat addition of supersonic flow leads to the decrease of local Mach number. Therefore, the Mach lines derived from the streamline of
  $y = 0\ \textrm {m}$ will converge, because the angles upstream are small while the angles downstream are large, as shown in figure 10(b). Similar processes occur along other
  $x$ axis parallel streamlines, and cumulative effects should be considered when the CW approaches the OSW–ODW surface. Therefore, the CW convergence along the reactive front is the critical process determining the wave system.

Figure 10. (a) Heat release rate and temperature along the streamlines of  $y = 0\ \textrm {m}$ in cases 9 and 10. (b) Schematic of Mach lines of supersonic flow with heat addition.
To elucidate the CW-related wave system, a theoretical study based on geometric analysis through double Mach lines has been conducted. This theoretical method depends on two key parameters,  $H_{{CW}}$ and
  $H_{{ini}}$. The former is the height of the CW, above which the CW may be replaced by the SODW or NDW, so it effectively quantifies the CW convergence. The latter is the height of the initiation region, i.e. the distance between the wedge and the transition point of the OSW–ODW surface. If
  $H_{{CW}}$ is less than
  $H_{{ini}}$, the CW will converge to the shock, resulting in either a SODW or NDW; otherwise, there is only one CW in the wave system. Considering that
  $H_{{ini}}$ is available from the numerical results, the critical step is to determine
  $H_{{CW}}$. For simplicity,
  $H_{{CW}}$ is calculated from the double Mach lines, as illustrated in figure 11. The CW front is denoted by the first blue Mach line, starting from the
  $x$ axis at the point where the heat release rate reaches 50 % of its peak value along the near-wedge streamline. The CW tail is denoted by the second red Mach line, starting from the
  $x$ axis at the point where the maximum heat release rate is achieved. In the future, more elaborate methods could be employed to consider several curved Mach lines. The inclination angle of the Mach line is calculated by the local flow Mach number as shown in figure 10(b), resulting in an intersection point at a distance from the wedge of
  $H_{{CW}}$. Figure 11(a) illustrates that
  $H_{{CW}}$ is less than
  $H_{{ini}}$ in case 10, indicating that the CW converges quickly enough to generate a shock wave coupled with the reactive front, i.e. the formation of a SODW. On the contrary,
  $H_{{CW}}$ is larger than
  $H_{{ini}}$ in figure 11(b), so there is only a CW in case 5. Note that the intersection of two Mach lines is unavoidable, being determined by the feature of supersonic flow with energy input. Thus, the determination of double Mach lines offers an effectively quantitative evaluation criterion for the detailed physical mechanism.

Figure 11. Enlarged initiation zone in the cases of (a)  $M_{1} = 8.5$,
  $H_{0} = 30\ \textrm {km}$ and (b)
  $M_{1}= 10.0$,
  $H_{0} = 30\ \textrm {km}$.
Results of geometric analysis for all the cases are listed in table 2, with the corresponding morphology type sketched in figure 9. Obviously,  $H_{{CW}}$ increases when
  $M_1$ remains at 10.0 and
  $H_0$ increases (cases 1–7). For the other two case groups, i.e. cases 8–11 and cases 12–15,
  $H_{{CW}}$ also increases when
  $M_1$ decreases and
  $H_0$ remains at 30 or 20 km. On the other hand,
  $H_{{ini}}$ follows the same trend as
  $H_{{CW}}$, but more modestly. Thus, the ratio of
  $H_{{ini}}/H_{{CW}}$ becomes smaller as
  $H_0$ increases, and larger as
  $M_1$ decreases. For cases 1–7, the ratio decreases and the morphology type changes from III to I, that is, from SODW to CW-induced smooth ODW. For the other groups, the ratio increases and the morphology type changes from I to IV, correspondingly. When the ratio
  $H_{{ini}}/H_{{CW}}$ is greater than about 1.2, the CW convergence induces the shock wave, resulting in either SODW or NDW. The deviation of
  $H_{{ini}}/H_{{CW}}$ from unity can be attributed to the simplification of the double Mach lines, which are supposed to be straight. However, these results indicate that the model of CW convergence can be used to predict the wave system with limited error, providing new insights into the morphology of ODWs. The ratio values in table 2 may be different if we chose other ways to define
  $H_{{CW}}$, but the variation trend and their association with the morphology type should be the same.
Table 2. Geometric parameters determined by the near-wedge streamlines in all cases.

A previous study (Teng et al. Reference Teng, Ng and Jiang2017) has approximated the initial heat release along the near-wedge streamline as a constant volume explosion process, leading to a theoretical model to estimate the ODW initiation length. Inspired by that work, we develop a method considering the detailed interaction of flow and heat release along the near-wedge streamline to determine  $H_{{CW}}$ theoretically. Given mixture parameters
  $P_3$,
  $T_3$,
  $V_3$ and wedge angle
  $\theta$, (2.6) and (2.7) could be used to calculate the gas parameters compressed by the main OSW. Then, an integration of the following equations (Kao & Shepherd Reference Kao and Shepherd2008) is performed from the post-shock state and the beginning of the wedge surface:
 \begin{gather} \frac{\mathrm{d} \rho}{\mathrm{d}\kern0.7pt x}={-}\frac{\rho \dot{\tilde{\sigma}}}{V(1-{Ma}^2)}, \end{gather}
 \begin{gather}\frac{\mathrm{d} V}{\mathrm{d}\kern0.7pt x}=\frac{\dot{\tilde{\sigma}}}{1-{Ma}^2}, \end{gather}
 \begin{gather}\frac{\mathrm{d} P}{\mathrm{d}\kern0.7pt x}={-}\frac{\rho V \dot{\tilde{\sigma}}}{1-{Ma}^2}, \end{gather}
 \begin{gather}\frac{\mathrm{d} Y_i}{\mathrm{d}\kern0.7pt x}={-}\frac{{\dot{\omega}}_i}{\rho V}. \end{gather}
The normalized heat release rate  $\dot {\tilde {\sigma }}$ is calculated by
 \begin{equation} \dot{\tilde{\sigma}}=\sum_{i=1}^n{\left(\frac{\bar{w}}{w_i}-\frac{h_i}{c_p T}\right)} \frac{\mathrm{d} Y_i}{\mathrm{d} t}, \end{equation}
where  $\bar {w}$ is mean molecular weight of the mixture,
  $c_p$ is the mixture frozen specific heat and
  $Y_i$ is species’ mass fraction. These calculations follow the methods of calculating Zel’dovich–von Neumann–Döring structures of one-dimensional steady detonations, leading to a heat release curve like the one in figure 10(a). Thereafter, theoretical
  $H_{CW}$ could be calculated following the same procedure discussed above, and the results are shown in figure 12. Generally speaking, the theoretical
  $H_{{ini}}/H_{{CW}}$ values are higher than the corresponding numerical ones, by about 1.5 times. The decreasing from cases 1 to 7 and increasing of the other two case groups are obvious, which shows the same variation trends as those of the numerical results. These results indicate that an analytical
  $H_{{CW}}$ is applicable for predicting the morphology type, although the detailed values are different from those based on numerical results.

Figure 12. Theoretical results of  $H_{{ini}}/H_{{CW}}$ and corresponding wave systems for all cases.
The theoretical study based on  $H_{{CW}}$ and
  $H_{{ini}}$ explains the mechanism of shock formation induced by a CW in the initiation region, but the formation of SODW (Type III) or NDW (Type IV) requires further clarification. By examining the velocity parameters, we find that the Mach number ratio
  $M_{{S}}/M_{{CJ}}$ provides a good prediction of the wave system difference (see table 3). Here
  $M_{{S}}$ denotes the local Mach number of post-OSW mixtures, whereas
  $M_{{CJ}}$ denotes the CJ Mach number of post-OSW mixtures. The parameters remain almost constant in the initial region of the post-OSW mixture along the near-wedge streamline, facilitating the determination of
  $M_{{S}}$ and
  $M_{{CJ}}$. In particular,
  $M_{{CJ}}$ is calculated based on the mass fractions of all species along with the pressure and temperature. The results in table 3 indicate that
  $M_{{S}}$ changes little from cases 1 to 7, whereas
  $M_{{CJ}}$ decreases slightly, so
  $M_{{S}}/M_{{CJ}}$ increases. From cases 8 to 11, or cases 12 to 15,
  $M_{{S}}$ decreases monotonically while
  $M_{{CJ}}$ increases, which leads to a decrease in
  $M_{{S}}/M_{{CJ}}$. In general, the ratio of
  $M_{{S}}/M_{{CJ}}$ decreases as
  $H_{0}$ and
  $M_1$ decrease, and the wave system changes to become Type IV when the ratio drops close to unity. This indicates that
  $M_{{S}}/M_{{CJ}}$ can be accurately used to distinguish the formation of NDW, although the ratio does not perform as well as the first method in terms of the classification of wave systems.
Table 3. Velocity parameters of post-shock mixture in all cases.

These two analysis results enable us to achieve a further understanding of the morphology of ODWs, especially the complicated wave systems in the initiation region. In essence, these two methods attempt to quantify the key mechanisms in the sophisticated flow concerning the coupling of shock wave, expansion wave and heat release. The former method provides a wave evolution viewpoint, revealing the critical factor of the wave system and the OSW–ODW transition type. The latter analysis of the induction zone Mach number provides an overall assessment, i.e. slow post-OSW flow and large-scale heat release promoting CW convergence, and demonstrates that the NDW may appear when the Mach number ratio  $M_{{S}}/M_{{CJ}}$ is close to unity. This result also suggests that the stationary wedge-induced ODW may be associated with
  $M_{{S}}$, probably leading to the detached ODW when
  $M_{{S}}/M_{{CJ}}$ is less than unity. Both methods have their merits and limitations, but a theoretical approach regarding the morphology of ODWs has been collectively established. These results also suggest that ODWs are too complicated to be described by semi-empirical methods, and so future work should focus on mechanisms beyond phenomenological connections. Moreover, although the present work has used the reactive Euler equations to simplify the problem, future study should take into consideration more non-perfect fluid phenomena such as boundary layers, fuel injection and mixing, turbulence and encompassed deflagration waves and pockets, which would better address the ODW phenomenon in reality.
4. Conclusions
The ODW morphology has been studied numerically and theoretically. Previously, wave systems were usually considered empirically as SODWs or CWs, introducing some structural ambiguities. This study simulated the ODWs in a stoichiometric hydrogen–air mixture first, with the controlling parameters  $H_{0}$ and
  $M_1$. Two wave systems were then analysed and discussed, one indicating that the CW may also induce the abrupt transition and the other suggesting that the classical SODW may evolve into a NDW. Hence, four ODWs with different wave systems were sketched and their relations were discussed based on these phenomena. To clarify the mechanisms of the different wave systems, a semi-theoretical study of the morphology of ODWs has been conducted by two analysis approaches. One relies on geometric analysis through double Mach lines, revealing that the wave system could be predicted from the viewpoint of CW convergence. The other analyses the induction zone flow Mach number in comparison with the corresponding CJ Mach number, providing a criterion for NDW formation.
Funding
This research was supported by the National Natural Science Foundation of China (NSFC; no. 11822202), the Natural Sciences and Engineering Research Council of Canada (NSERC) and the 111 Project (no. B16003) of China.
Declaration of interests
The authors report no conflict of interest.
Appendix A
The numerical detonation simulation results are sensitive to the grid length scale. In this paper, the numerical grid resolution used for different cases varies from a coarse mesh of  $400\ \mathrm {\mu }\textrm {m}$ to a fine mesh of
  $4\ \mathrm {\mu }\textrm {m}$. To ensure the independence of the results with respect to the grid scale, a resolution study is performed by doubling the grid numbers in both the
  $x$ and
  $y$ directions at the same time. For instance, the density contours of case 9 with the default mesh size of
  $400 \ \mathrm {\mu }\textrm {m}$ are shown in figure 13, and compared with the results with the refined mesh size of
  $200\ \mathrm {\mu }\textrm {m}$. It can be seen that the differences between the two wave structures are difficult to distinguish. A quantitative comparison is conducted by plotting the pressure and temperature along three typical lines (i.e.
  $y = 0\ \textrm {m}$, 0.02 m and 0.08 m), as shown in figure 14. These lines correspond to different flow regions of the ODW field, including the wedge surface, NDW structures and steady ODW surface. The curves nearly overlap with trivial differences, so a grid of
  $400\ \mathrm {\mu }\textrm {m}$ is sufficient to capture the main ODW structures of case 9. Another example examining the effect of mesh size in case 5 is shown by the density contours in figure 15 and the quantitative comparison in figure 16. Again, the two wave structures are similar to each other, though a slight quantitative discrepancy appears near the oblique detonation surface. For other cases with different
  $M_1$ and
  $H_0$, similar resolution studies have been performed to eliminate the effects of grid size. Considering the main issues discussed in this work, the chosen grid scale provides converged, global formation structures that are sufficient to guarantee the reliability of the conclusions.

Figure 13. Density fields with different grid scales in the case of  $H_{0} = 30\ \textrm {km}$,
  $M_1 = 8.0$.

Figure 14. (a) Pressure and (b) temperature along different lines parallel to the  $x$ axis with different grid scales in the case of
  $H_{0} = 30\ \textrm {km}$,
  $M_1 = 8.0$.

Figure 15. Density fields with different grid scales in the case of  $H_{0} = 40\ \textrm {km}$,
  $M_1 = 10.0$.

Figure 16. (a) Pressure and (b) temperature along different lines parallel to the  $x$ axis with different grid scales in the case of
  $H_{0} = 40\ \textrm {km}$,
  $M_1 = 10.0$.
Appendix B
Environmental gas pressure, temperature and density for each case are listed in table 4, corresponding to the parameters at state 1 in figure 1. Furthermore, the two flow deflection angles of inlet compression used in the simulations are also listed, which could lead to two equal-strength OSWs.
Table 4. Inflow gas-dynamic parameters and inlet compression angles of all presented cases.


